Final Project: Electric Rickshaw modelling
Aim:-
Create a detailed MATLAB model of an electric rickshaw (three wheel passenger vehicle) as per details below:
Rear wheels driven by PM brushed type motor
Assume efficiency points of motor controller and motor
Make an excel sheet of all input and assumed data
show energy consumption, temperature rise of motor and controller
Abstract:-
Here we are going to build the MATLAB model of the ELECTRIC RICkSHAW by using a PM brushed type DC motor and a suitable Lithium-Ion battery for the motor. Before that, we will know about what is Electric RICKSHAW, how it's works and the benefits of EV RICKSHAW. Then we make an actual EV RICKHAEW model in simulink with suitable blocks from the powertrain block set. Our main aim is that to check "how the RICKSHAW performs for any three standard driving cycles showing energy consumption, the temperature rise of motor and controller for vehicle cover around 100 km at constant speed driving 45 kmph.
Design and Construction:-
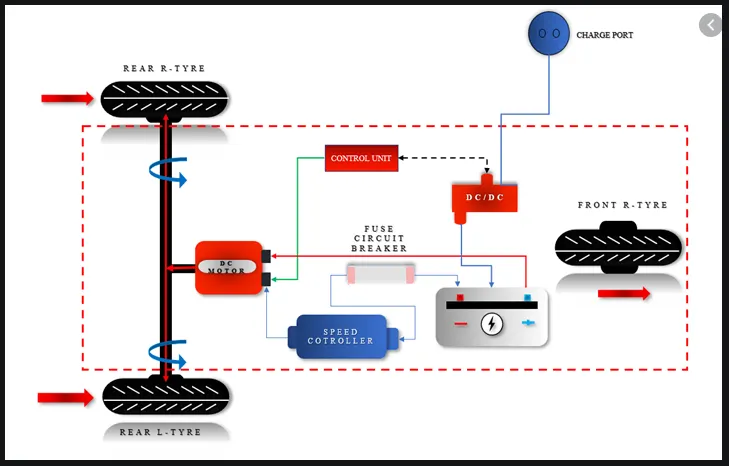
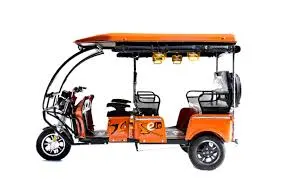
These rickshaws have a mild steel tubular chassis, consisting of three wheels with a differential mechanism at the rear wheels. The motor is a brushless DC motor. The electrical system used in Indian versions is 48V and in Bangladesh is 60V. The body design from the most popular Chinese version is of very thin iron or aluminum sheets. Bodies made of fiberglass are also popular because of their strength and durability, resulting in low maintenance. The body design is varied from load carriers, and passenger vehicles with no roof, to full bodies with windshields for drivers' comfort.
It consists of a controller unit. They are sold on the basis of voltage supplied and current output, also the number or mosfet (metal oxide field effect transistors) used. The vehicle's batteries are typically lithium-ion with a lifespan of 3-4 years. designed for electric Deep cycle battery vehicles are rarely used. The weight of the electric car has also been a recurring design difficulty in them.
Design of electric rikshaw
PROCEDURE:
1) Identify what amount of propulsion power required
2) What is the best suitable motor for that propulsion power.
3) Then type of battery and range of battery according to the range.
Why we should be required to calculate 1st propulsion power?
The final outcome of the vehicle is propulsion power and therefore the start point should be what is propulsion power on the calculation of proper power, therefore, the study must begin with an estimation of propulsion power
An electric vehicle(EV) is defined as a vehicle that uses an electric motor or a traction motor for propulsion instead of internal combustion used by conventional vehicles. Electric vehicle use electricity for power instead of fossil fuels like conventional vehicles . So, they do not produce any exhaust gases and pollution. The power needed in the EV come from batteries, generator or any collector system. Batteries fitted in the EV are of high energy densities in order meet the power requirements and range.
COMPONENTS:
The main components of the EV are:
- Wheels/tires
- Battery
- Motor/generator
- Motor controllers
- Power converters
- Transmission system
- Vehicle Body
Design Module for the EV:-
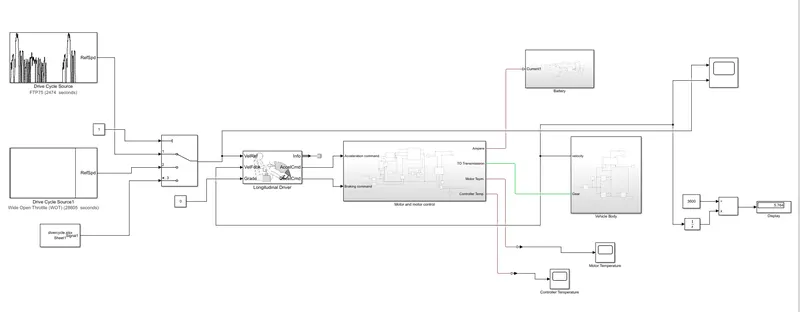
In the below picture , we have done the simulation of an electric vehicle using various drive cycles by using powertrain blockset available in simulink library.First, there is the inputs where we have connected two different drive cycles which provides the reference for the longitudinal driver which compares the two speed and gives accelerator and braking commands to the motor controller block. battery block and vehicle body blocks are further attached and scopes are used for displaying the working status.
1. System level configurations:-
For the above model design in the simulink. we need to model the above mentioned components separately and make them work together.All the main components are available in the library of SIMULINK blocks. so we need to add the components and configure the parameters to fit the the working requirements as per of the model.
Vehicle Body:-
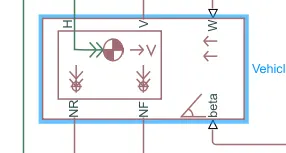
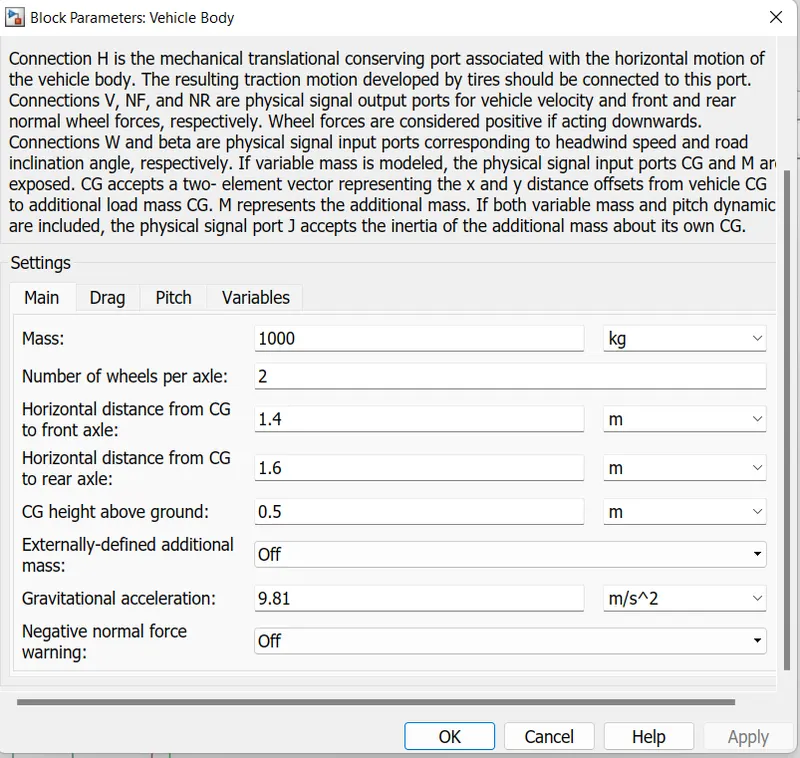
This block contain 6 ports which can be used to model various aspects of the vehicle body. The ports are mentioned below;
- H- This stands for hub and is used to connect the hubs of the wheels to the main body of the vehicle.
- V-Physical signal output port which stands for 'velocity' and is used the output the velocity of the vehicle.
- W- Physical signal input port and allows us to model a wind velocity that acts aginst the vehicle.
- NR- Physical signal output port to connect to connect the rear wheels
- NF- Physical signal output port to connect the front wheels of the vehicle.
- Beta- Physicall signall input port which allows the vehicle to undergo an inclination of hill climbing force.
- Model parameters to set up mass, frontal area amd others.
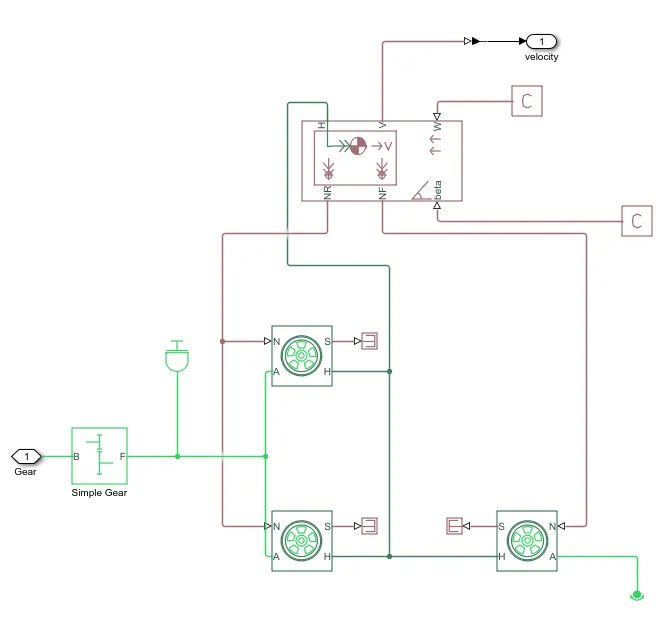
The above blocks are forming a subsystem which serves as a part for the whole vehicle. Four tires are connected, where the right two tires are the front wheels and the remaining two are the rear wheels . they are interconnected to the hub of the vehicle body block. and their respective axles are connected accordingly. We here have connected the rear axle with the gear as we want the model to be a rear wheel drive vehicle. Here the wind velocity port and hill-climbing angle ports are connected to physical constant blocks which is kept as zero.
Tire arrangment:-
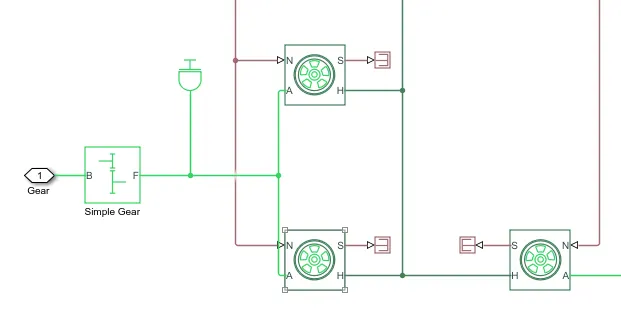
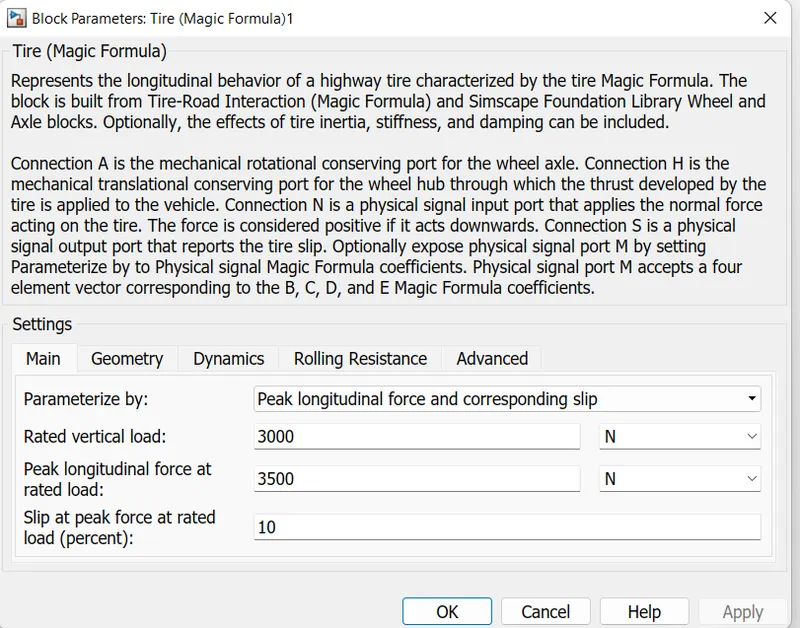
Here the above represents the parameter of the tire we can also used the other as per our requriment. There is also the another block like dyanmics, Rolling resistance, Geometry, Advanced.
Simple Gear block:-
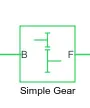
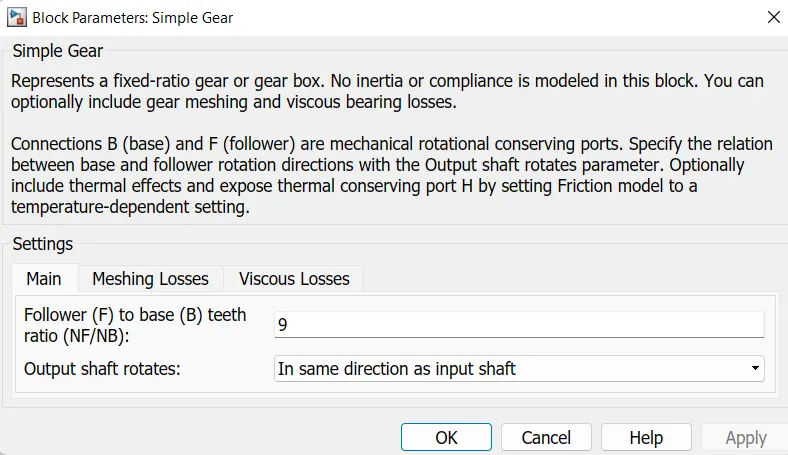
Here we used the gear block .This block models a gear system with fixed gear ratio. However, we can modify the messing of the gear teeth, Here The follower to base teeth ratio has been set to 2 and the output shaft rotates in the same direction as the input shaft. All these blocks are categorised into a single subsystem which we have names as vehicle body block, which takes the mechanical input from the motor and controller block into the gear and displays the velocity at which the vehicle body moves.
2. Model parameters
Motor and Motor Controller System:-
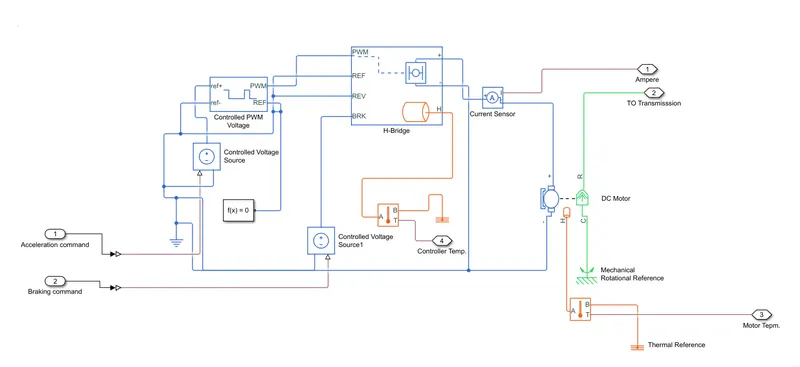
Components:
- DC Motor
- H- Bridge
- Controlled PWM voltage
- Controlled voltage source
- Current sensor
DC-Motor:-
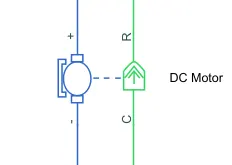
For the above EV model, I have selected to use a DC motor block . There are two sides of the block , the mechanical side is on the right and the electrical side is on the left. mechanical side has tow ports C and R, C stands for casing and is the stable part and R is the rotor which produces a torque. The electrical side has a positive and negetive side for the voltages to be applied. If positive voltage is applied to the motor block from the positive to the negetive terminal then a positive torque will act from C to R port. The direction of the torque can be changed by changing the sign of the back emf or the torque constant. Here i have connected the c port to the mechanical rotational reference because it will be stationary. The R port is connected to the gear in the vehicle body block.
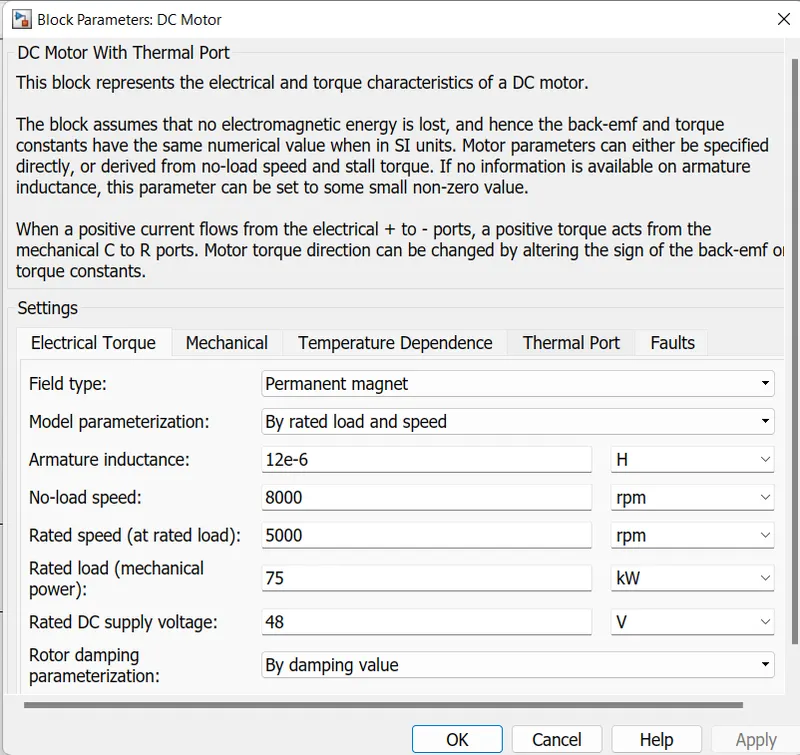
Here the above shows the motor parameter which is selected in the motor block. we can change the paramter as per our requriment. i have selected the motor for the rated load and speed, for the 75 kw.
H-Bridge :-
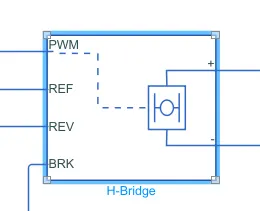
This is a power converter which is needed to provide power in the correct form and magnitude from one component to other. In case of EV,s a power converter is needed to provide a DC voltage from the battery of the EV to the DC motor, so that it can fuction properly at the required parameters.Here i have used an H-bridge motor drive as my power converter. The left side is for controlling the voltage signals and the right side terminals to provide the controlled voltage to the DC motor the left side ports are
- PWM- Pulse width modulation
- REF- Reference
- REV- Reverse
- BRK- Brake
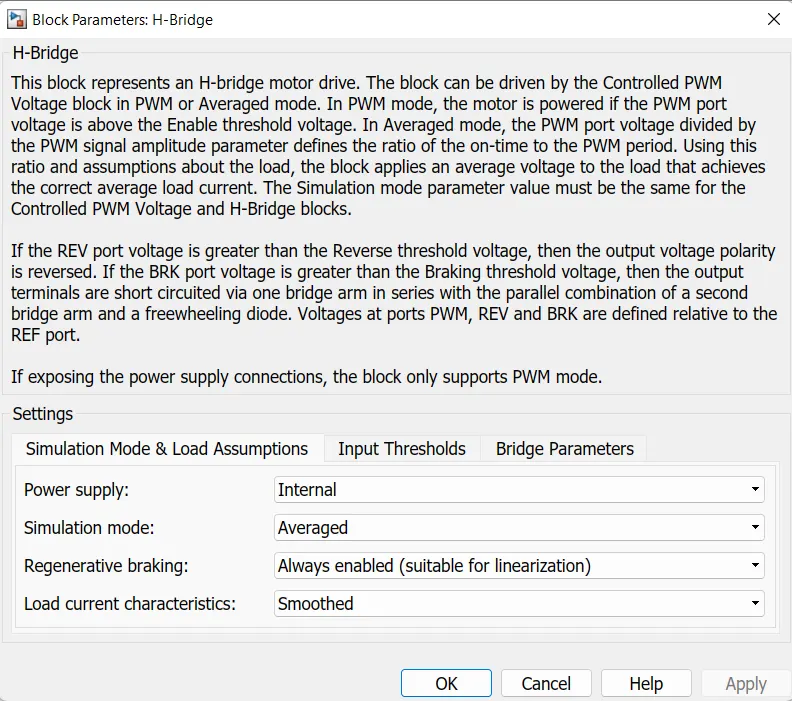
The simulation is kept in average mode beacuse PWM mode will take longer durations of simulation and also the regenerative braking is enable . In the section of bridge parameters the output voltage amplitude was modified to 300 volts according to the DC motor.
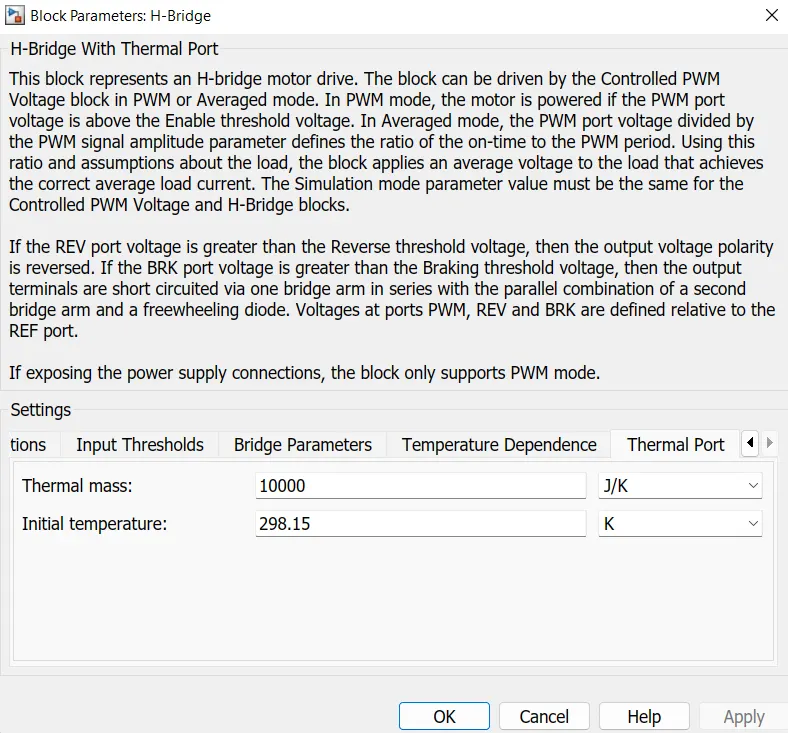
Thermal port Parameter:-
Voltage Control PWM:-
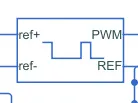
The above block shows the voltage control PWM by this block we can get the contorl voltage. This block provides the control PWM voltage signal to the H bridge block.
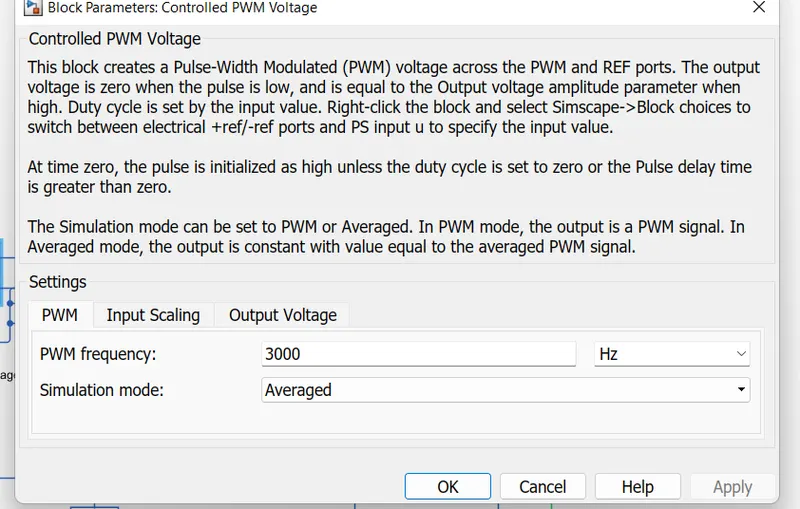
The controlled PWm voltage parameter is set as per the requriment of the vehicle i have set the PWM freqency on the 3000.
The input sccaling and the output voltage is unchanged.
Controlled Voltage Source:-
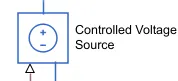
The block represents an ideal voltage source that is powerful enough to maintain the specified voltage at its output regardless of the current passing through it. The output voltage is V = Vs, where Vs is the numerical value presented at the physical signal port.
Current Sensor:-
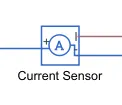
The block represents an ideal current sensor, that is, a device that converts current measured in any electrical branch into a physical signal proportional to the current.Connections + and - are conserving electrical ports through which the sensor is inserted into the circuit. Connection I is a physical signal port that outputs current value. The positive terminal is connected to the h bridge and negative terminal is connected to the motor terminal.
Battery Subsystem:-
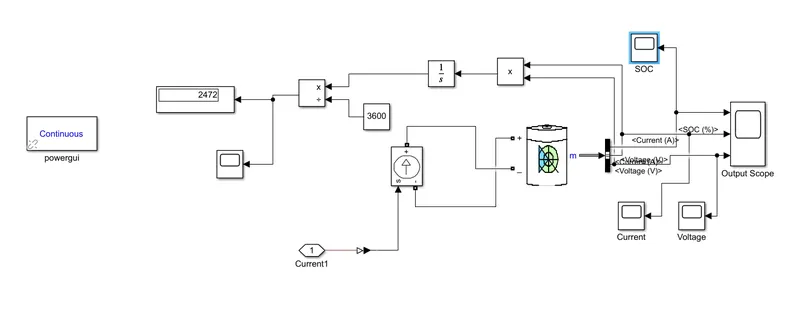
Battery:- The battery stored the energy and provides the EV and will contain the electrical energy in DC form and provide this energy to operate. Nominal voltage has been set to 48 volts, Rated capacity of the battery has been set to 2000 Ah.
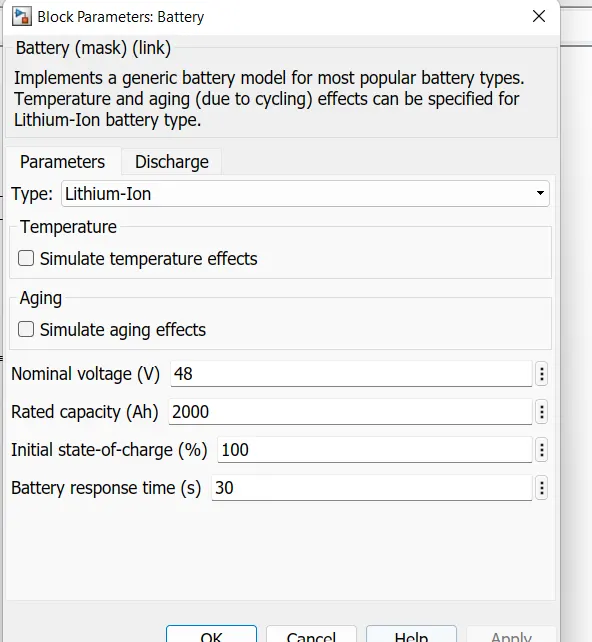
The above nominal voltage is sufficient for the motor and its controller.
Controlled current source:-

The block represents an ideal current source that is powerful enough to maintain the specified current through it regardless of the voltage across it. The output current is I = Is, where Is is the numerical value presented at the physical signal port.
Speed measurement :
In order to measure the speed. I have modified the scope block to have two input ports where one port takes the output velocity signal from the vehicle sub-system block and other port takes the output signall from the drive cycle to the reference velocity port on the longitudinal driver block. This has been done to compare the two speeds and check weather they overlap and achieve the same speed.
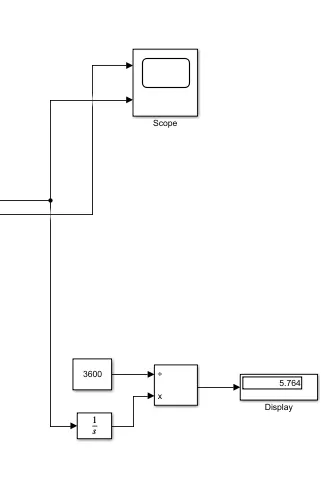
Mathematical blocks and scope block is used to measure the distance travelled by the vehicle. First we had to implement the integrator block to integrate the velocity siganal that is output from the velocity sub-system. Dividen block along with constant block having a value of 3600 is used to divide the integrated speed . This will give us the distance travelled in kilometers.
Multiport Switch:-
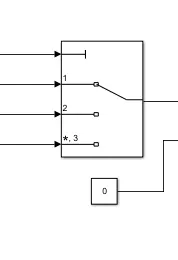
We have use the three input port for the three different drive cycle. The multi-port switch thake input form the drive cycle and deliver the output to the longitidunal drive .Pass through the input signals corresponding to the truncated value of the first input. The inputs are numbered top to bottom (or left to right). The first input port is the control port. The other input ports are data ports.
Longitudinal Driver and the Drive Cycle:-
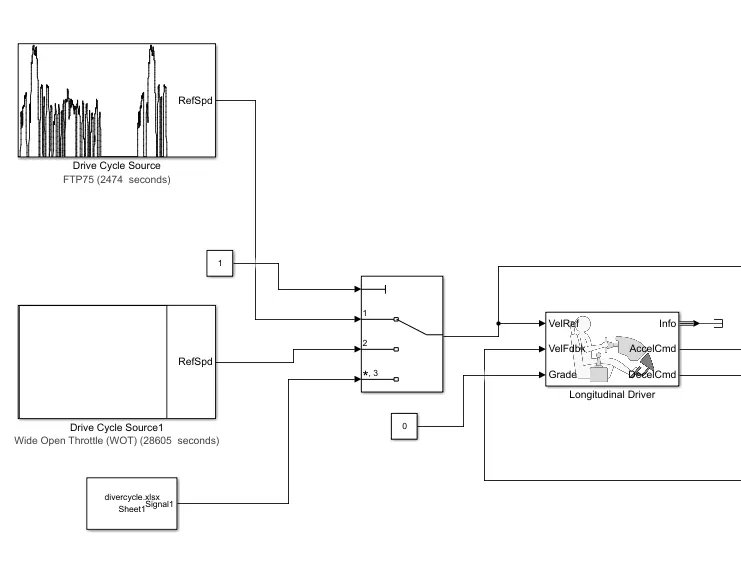
The longitudinal driver block is used for giving normalized acceleration and deacceleration commants to a controller based on two sets of data. The first data is the reference velocity and second data is the feedback velocity.The reference velocity data coming from drive cycle source and is compared to the feedback velocity data coming from the vehicle body. If the reference velocity is greater than the feedback velocity, an acceleration comand will be given as an output to the controlled voltage source. If the reference velocity is lesser than the feedback velocity, a deacceleration command is given as output to anpother controll voltage source. For the output acceleration and deacceleration commands i have used simulink-PS converter block. In this case the input signal; is velocity data and this is logic data which have to be converted to a voltage signal The ports in this block are:
- Velref- This stands for the reference velocity and it is the velocity data provided from a drive cycle source.
- Velfdbl- This stands for feedback velocity and it is coming from the vehicle's body velocity port
- Grade- This port provides a grade or inclination angle on which the vehicle is travelling in degrees.
- Info- This port is for the bus signals which consists of block calculations
- Accelcmd- This port provides the acceleration command to a controlled voltage source
- Deacclcmd- This port provides the deacceleration command to another voltage source.
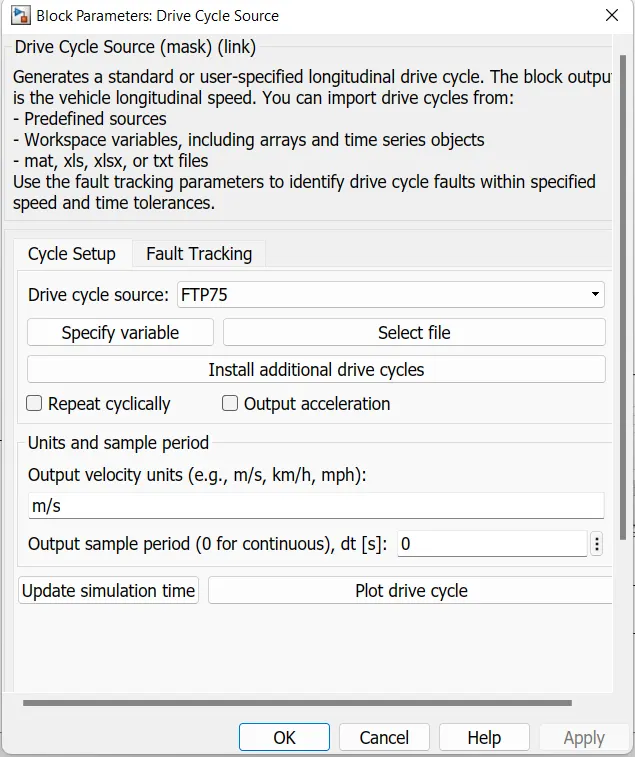
FTP Drive Cycle:- Drive cycle is the velocity to the time data for the purpose of the modelling. By connecting the drive cycle we can run the vehicle as per the velocity and time data in that cycle . It is the plot of vehicle velocity to the time .In the module I have used the Federal Test Drive cycle (FTP2474) for this it will gives the referance cycle to the longitudinal driver .
In the below graph shows the EV ran for the time 2474 sec and and distance cover by the vehicle, current and the soc of the vehicle.
3. Results:-
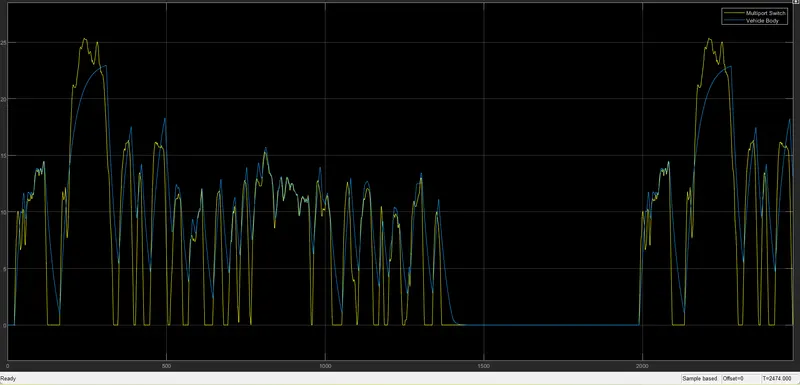
As in the above graph you can see the graph representation of the two signals yellow one is for the referance velocity form the drive cycle and another blue one is for the actual for with the how much the vehical ran. As we can see that the longitudinal driver successfully maintains the drive cycle data , process it and controls the vehicle's speed according to the reference speed. The graph overlaps each other effectively during acceleration and deacceleration.
Current Scope
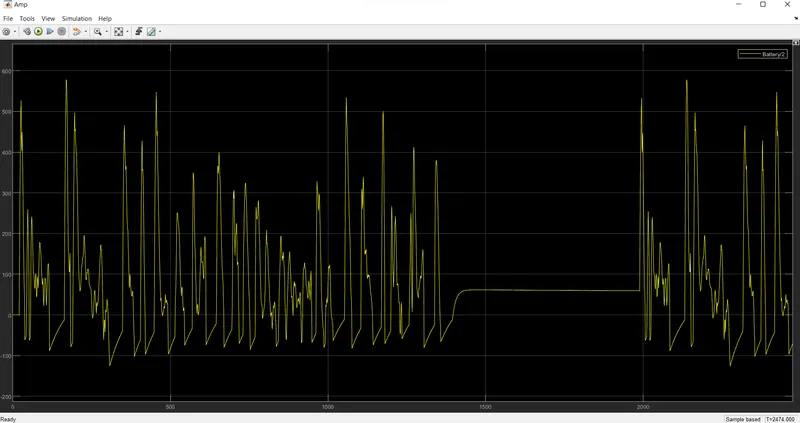
In this graph we can see that the current flowing through the circuit for the time of vehicle ran.
SOC scope:-
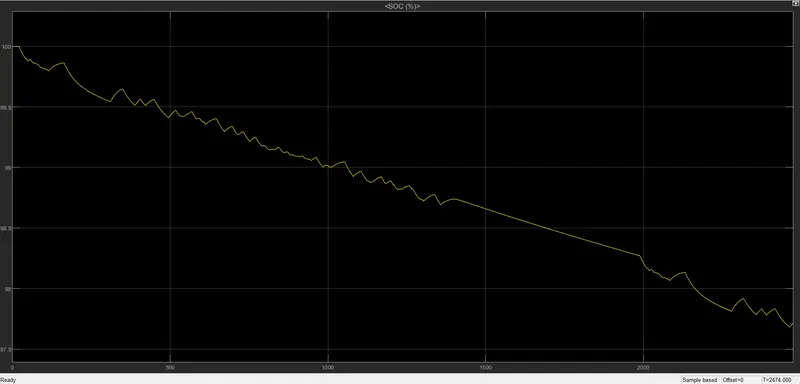
In the above graph we can see that the soc of the battery which varies over the drive cycle time, The battery was moduled to begin with an SOC pf 1 that is 100%. As the simulation starts the charge of the bettery gets decreased and 97.5% remaining the batteery and only 2.3% consume.
Power Consumption:-
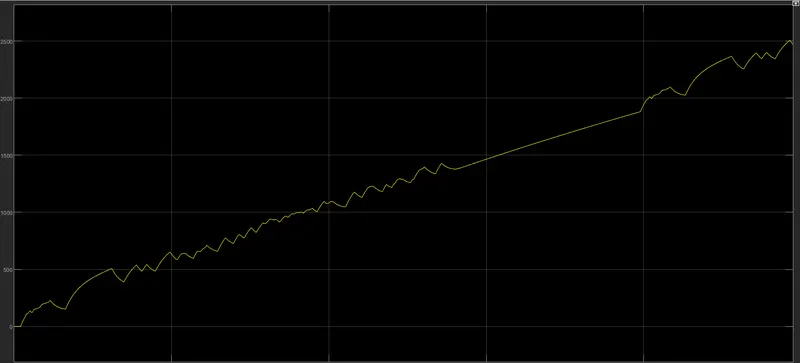
Here we ran the vehicle due to these vehicle consume the power it was about 2472 watt.
Motor Temp.
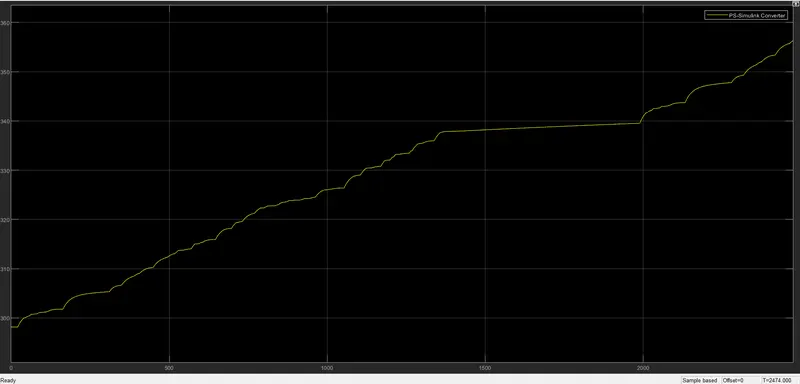
The Temperature of the Motor is increased to 356.3°C, with 10000 as the thermal mass given to the motor.
Controller Temp.
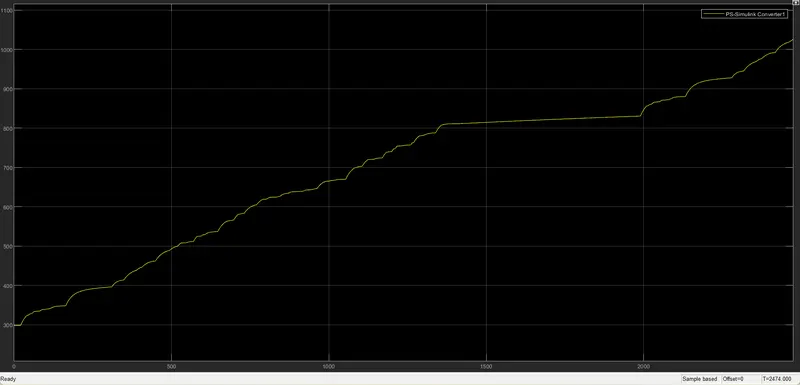
the Temperature of the Controller is 1025°C with 10000 as the thermal mass given to the controller of the H - bridge.
Total Distance Travelled:-
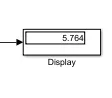
I have ran the vehicle for the FTP2474 drive cylce for this data the vehicle cover the 5.76 kms distance as shows in the display block. This dislpay block is connected to the output came form the vehicle body.
Wot Drive Cycle :-
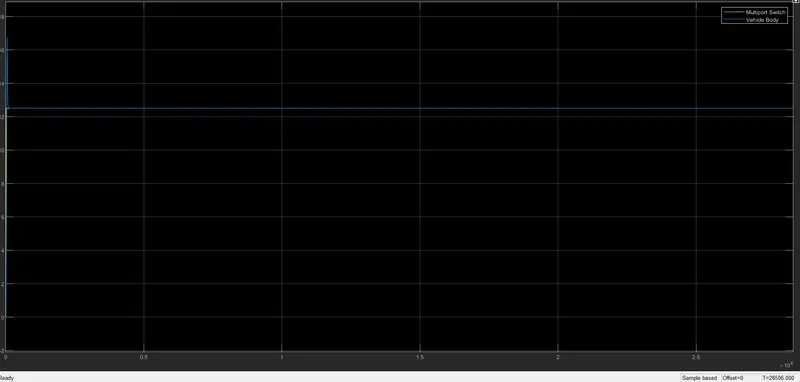
As in the above graph you can see the graph representation of the two signals yellow one is for the referance velocity form the drive cycle and another blue one is for the actual for with the how much the vehical ran. As we can see that the longitudinal driver successfully maintains the drive cycle data , process it and controls the vehicle's speed according to the reference speed. It Have some overshoot but we manage the drive cycly exactly overlaps the referance drive cycle. The graph overlaps each other effectively during acceleration and deacceleration.
Soc:-
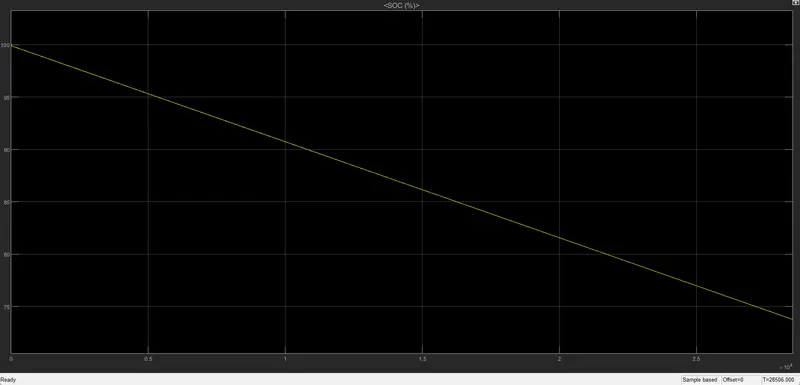
In the above graph we can see that the soc of the battery which varies over the drive cycle time, The battery was moduled to begin with an SOC pf 1 that is 100%. As the simulation starts the charge of the bettery gets decreased upto the 76% approx and only 24 % battery consume by the vehicle.
Power consumption:-
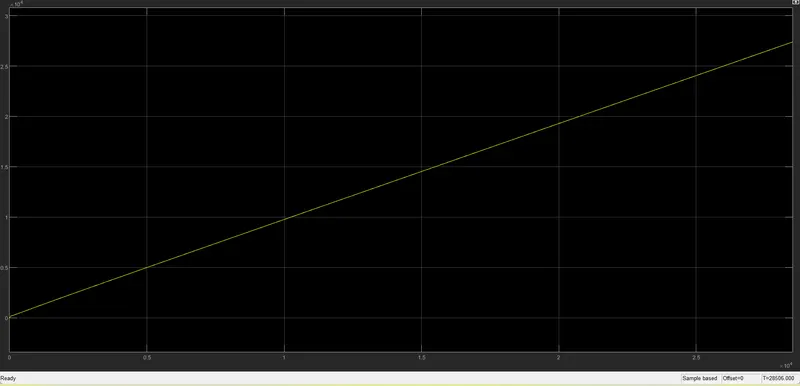
Here we ran the vehicle due to these vehicle consume the power it was about 27 kw approx.
Motor Temperature:-
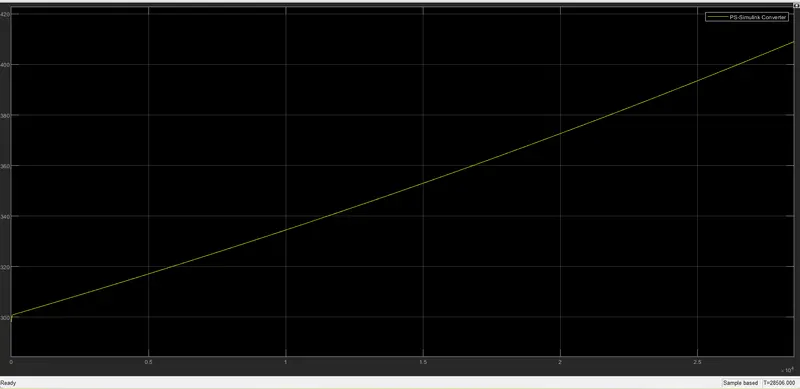
the Temperature of the Controller is 409.6°C with 10000 as the thermal mass given to the controller of the H - bridge.
Controller Temperature:-
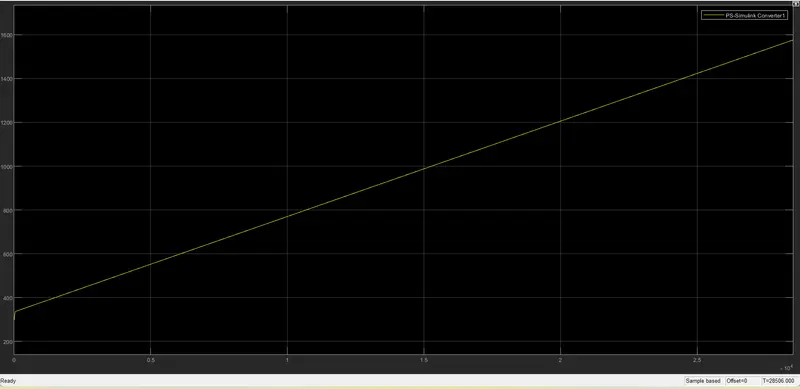
the Temperature of the Controller is 1582°C with 10000 as the thermal mass given to the controller of the H - bridge.
Dictance travelled
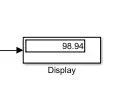
I have ran the vehicle for the WOT drive cycle 28605s drive cylce for this data the vehicle cover the 98.94 kms distance as shows in the display block. This dislpay block is connected to the output came form the vehicle body.
Costum Drive Cycle:-
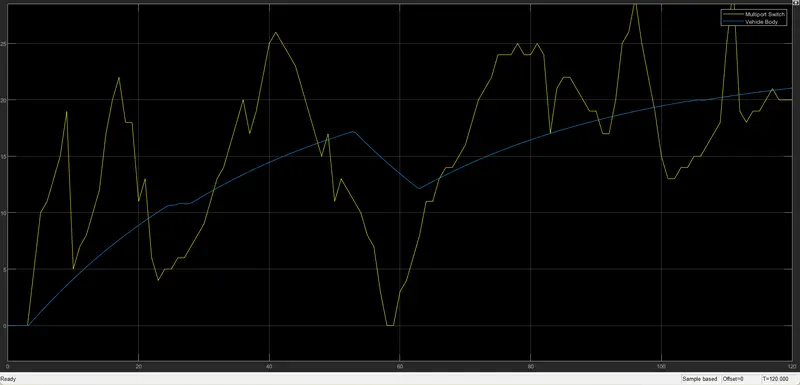
As in the above graph you can see the graph representation of the two signals yellow one is for the referance velocity form the drive cycle and another blue one is for the actual for with the how much the vehical ran. As we can see that the longitudinal driver successfully maintains the drive cycle data , process it and controls the vehicle's speed according to the reference speed. Here we tried to manage the data to overlaps the referance drive cycle. The graph overlaps each other effectively during acceleration and deacceleration.
SOC:-
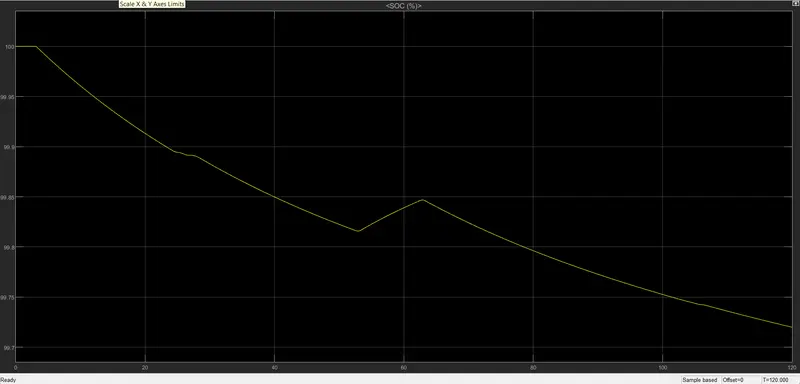
In the above graph we can see that the soc of the battery which varies over the drive cycle time, The battery was moduled to begin with an SOC pf 1 that is 100%. As the simulation starts the charge of the bettery gets decreased upto the 99.7% approx and only 0.3 % battery consume by the vehicle.
Power Consumption:-
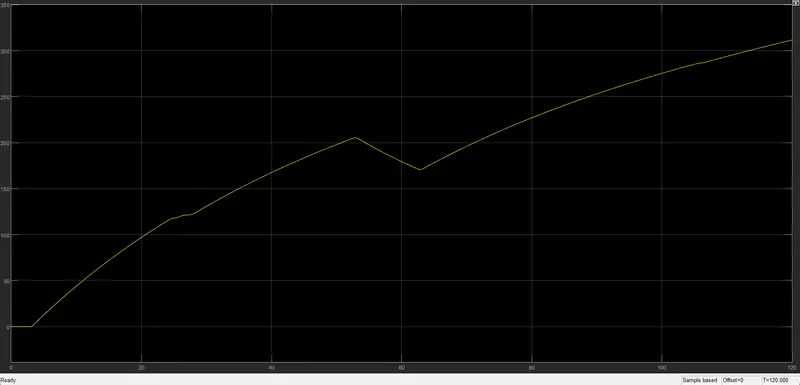
Here we ran the vehicle due to these vehicle consume the power it was about 311.6 watt approx.
Motor Controller:-
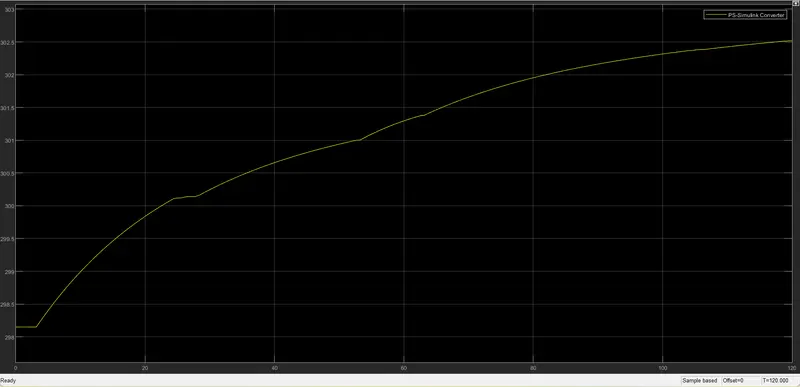
the Temperature of the Controller is 302.5°C with 10000 as the thermal mass given to the controller of the H - bridge.
Controller Temperature:-
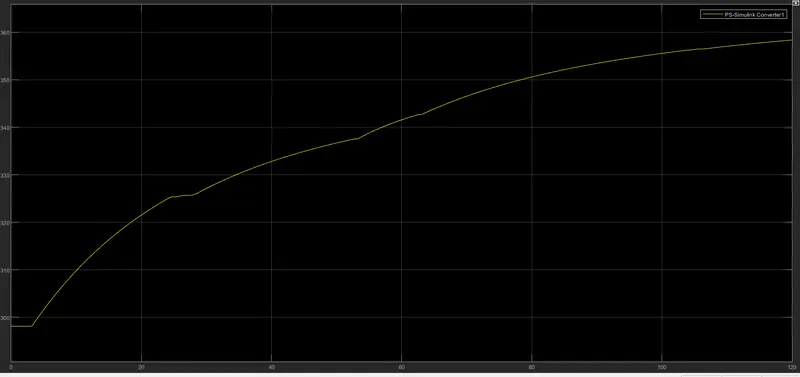
the Temperature of the Controller is 358.4°C with 10000 as the thermal mass given to the controller of the H - bridge.
Distance Travelled:-
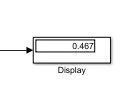
I have ran the vehicle for the Manual drive cylce of 120s for this data the vehicle cover the 0.467kms distance as shows in the display block. This dislpay block is connected to the output came form the vehicle body.
4. Conclusion:-
#Created a MATLAB model of an Electric Rickshaw (three-wheel passenger vehicle) by using a Li-ion battery, PM Brushed DC Motor.
- Detremined the variations of Temperature of Motor and controller, SoC% and Energy consumed by the by vehicle for all the three Reference Drive cycles (.e: FTP75, WOT, Manually prepared).
- For every respective cycle we saw the velocity profile following the given drive cycle data, and attaining the close value to the actual speed of the drive cycle.
- The SOC of the battery for each cycle depends on various factors. The coefficient of rolling resistance, Thermal mass, Gear ratio, etc. By varying these parameters we can change the SOC of the battery for the particular drive cycle.
- Here I have compromised with the temperature of the motor and controller to achieve vehicle speed is near to reference speeds. Since I haven't used any cooling system in the model. In the real-time application, the motor temperature is less than 100 C
- In the real-time application, the motor, battery & controller temperature is controlled by air cooling. Hence, the temperature of these components is not increased to this extent.
- This Battery-powered Rickshaw will be the most popular mode of transport in the future.
Here I attatched the drive cycle data taking for the manual drive cycle, also attatched the project module.