Electric Rickshaw modelling
An electric vehicle is a vehicle that uses an electric motor for propulsion. It is controlled by an electric controller and powered by a battery pack. Due to the increased consumption of gasoline and pollutions caused by conventional vehicles in the late 20 and 21st century, vehicles powered by alternate fuels like CNG, fuel cells, and electric vehicles have started growing. After a lot of technological advances and breakthroughs, electric vehicles can perform almost as efficiently as a combustion engine thus leading to an increased market for electric vehicles.
MODEL DESCRIPTION:
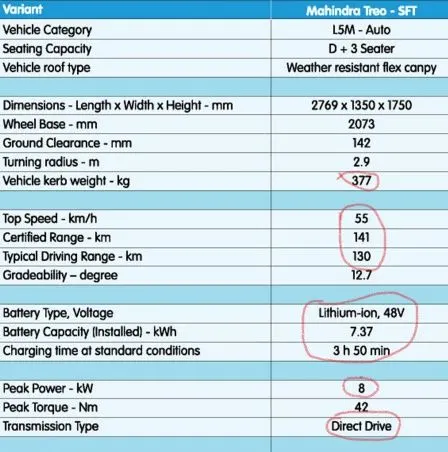
With the help of MATLAB, a three-wheeled passenger vehicle is modeled. The three-wheeled passenger vehicle is driven by a permanent magnet brushed motor. For the other important parameters, Mahindra Treo sft electric auto model is considered and from its specifications, the following data are utilized for modeling the rikshaw.
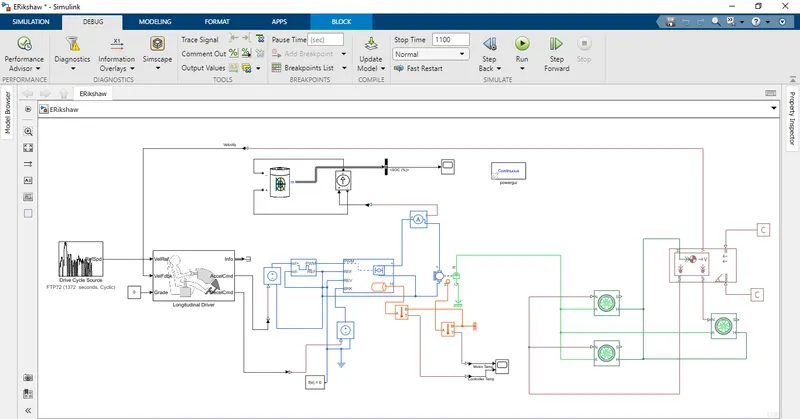
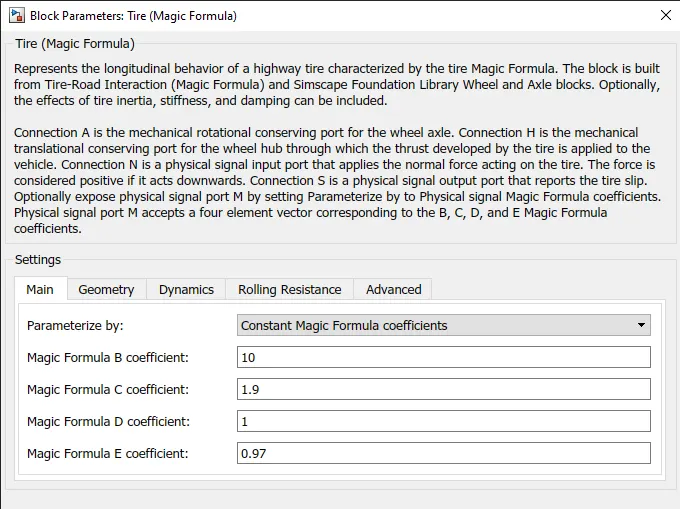
Based on the initial parameters, the model can be created from right to left starting from wheels. Here, wheels with a magic formula block are used. As determining the slip is not considered for this application, the wheels have been provided with default magic formula coefficients, and these signals are provided to the vehicle body.
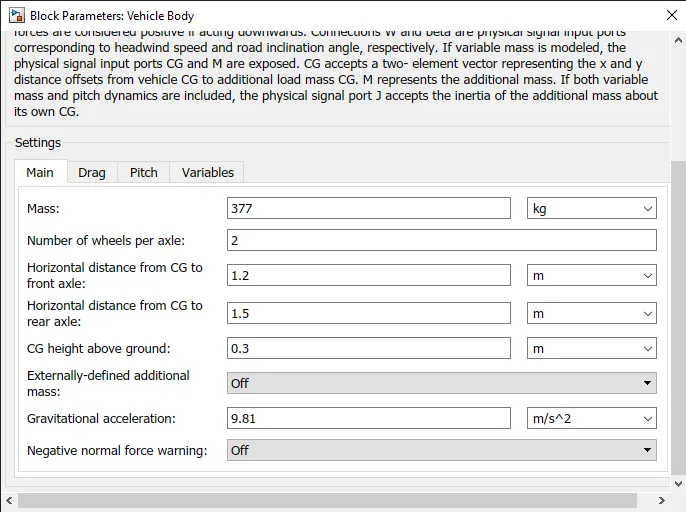
It is assumed that the vehicle is moving on flat terrain and the headwind speed is assumed to have an average value of ~5 m/s. The weight of the vehicle is assumed to have the kerb weight of the vehicle. The approximate horizontal distance from the center of gravity to the axles is provided.
A brushed DC motor block is used for propulsion and as this is a direct drive, the torque produced by the motor is directed directly to the wheels through axles. The DC brushed motor with default parameters.
A motor controller is required to step up and provide the required voltage to drive the motor. H bridge controller is used which takes the input voltage from the battery and based on the drive cycle data's speed requirements, the required voltage is provided to the motor.
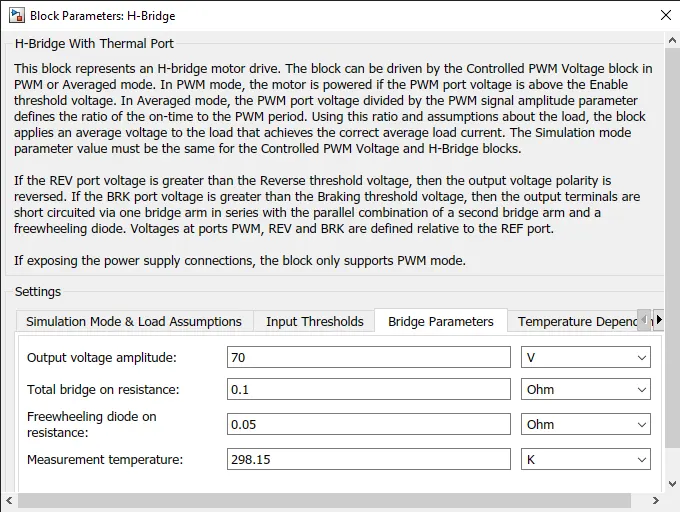
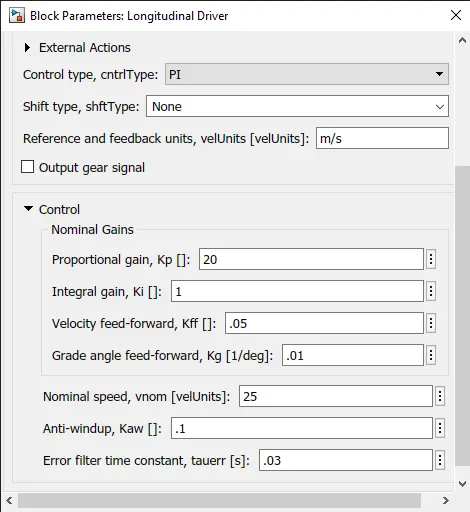
As the temperature has to be measured for the motor controller and the motor, temperature sensors are attached to the motor controller and motor with a temperature reference block to determine the change in temperature over a period of time. A scope is attached to the temperature sensors to plot the change in temperature over a period of time. A drive cycle source is required to determine the voltage/current required by the motor at a particular speed at a particular period of time. The longitudinal driver blocks help to convert the incoming Simulink signals from the drive cycle source to required acceleration and deceleration speed values before providing them to the h bridge motor controller through a controlled voltage source.
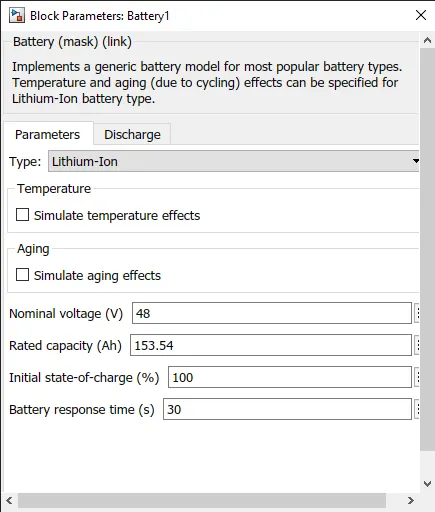
A battery pack is required to power up the whole system thus a generic battery block is used and the whole battery pack is assumed as a single module in this case thus a single battery block is used. Through a controlled current source, the required current is provided to the motor controller to run the motor based on the voltage required by the drive cycle. As the SOC of the battery pack is to be measured over a period of time, a bus selector block is used to get the SOC signal from the battery block and the obtained signal's plot over a period of time can be observed in the scope.
SCOPE AND RESULTS:
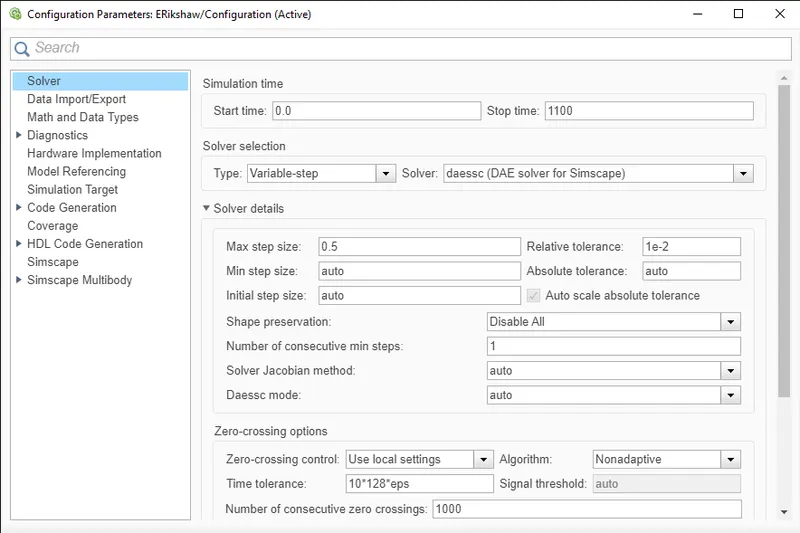
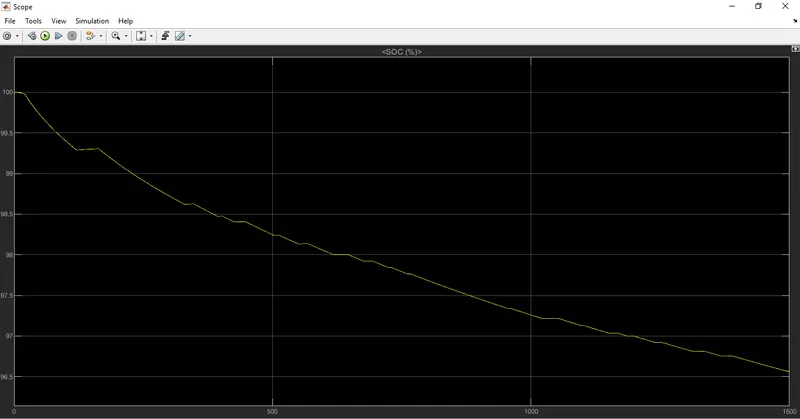
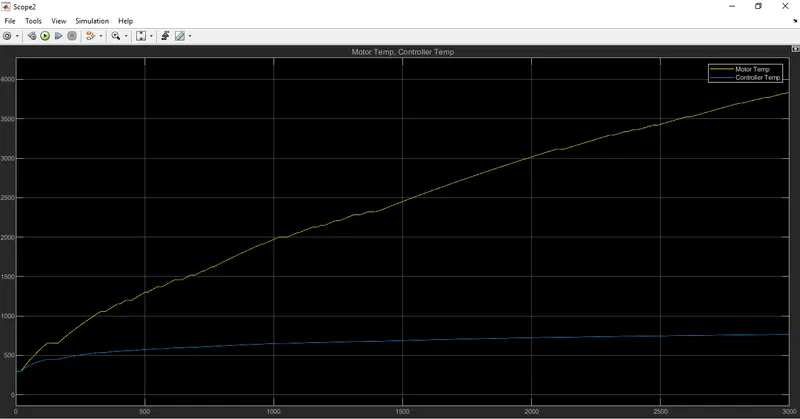
Here 3 drive cycles are used: FTP75, FTP72, HUDDS, and these cycles repeat over a period of time till the stopping time. For FTP75, FTP72, and HUDDS the stopping time was set to 3000s, 1500s, and 1100s respectively. Due to the error posted by the solver for its inability to solve with smaller step size and relative tolerance, the relative tolerance was changed where the solver could form the equation and solve them without any errors while slightly compromising the accuracy of the results obtained.
After simulating the model, the following results are obtained for different driving cycles and stopping times.
FTP75:
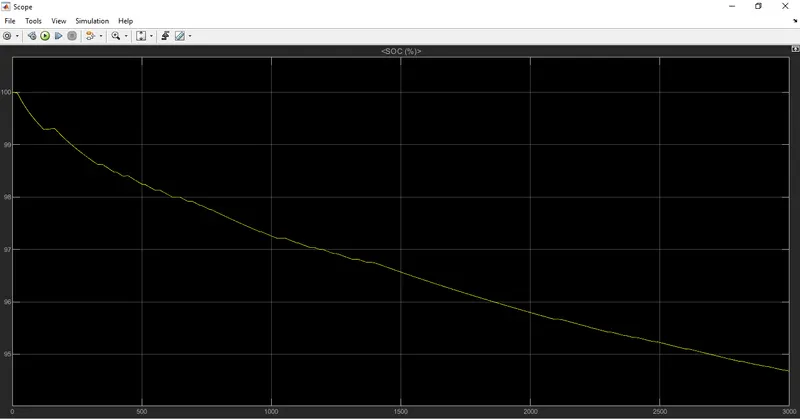
The SOC graph shows that the battery pack got drained a bit from 100% to ~94% over a period of 3000 seconds. The smaller down spikes are due to the change in voltage requirements to run the motor based on the drive cycle data and the straight regions represent the motion of the vehicle at a constant speed.
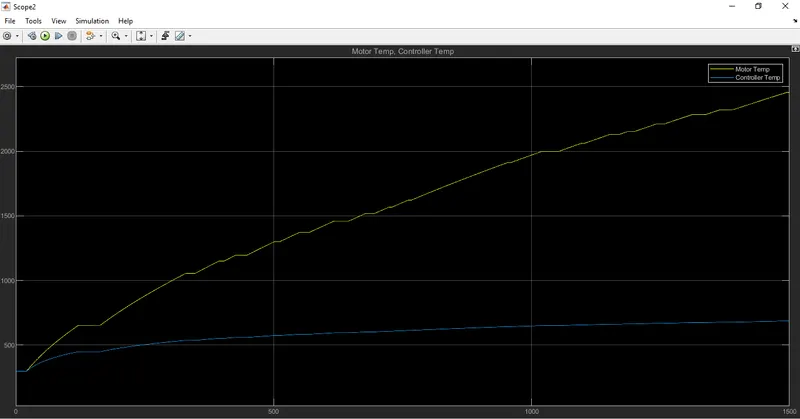
Both the motor controller(H bridge) and the motor temperatures are at atm temperature (~273K). When there is a higher voltage requirement by the motor and its continuous usage, the motor temperature gradually rises and remains almost constant for a while at constant speed regions. To provide a steady voltage to the motor, the motor controller temperature gradually rises till a constant voltage is provided to the motor. Due to the continuous change in voltage required by the drive cycle, the motor controller temperature rises. The motor controller reaches almost a constant temperature of ~600K and these smaller temperature change provides an idea on how quickly and efficiently the motor controller is operated to step up and stabilize the voltage.
FTP72:
HUDDS:
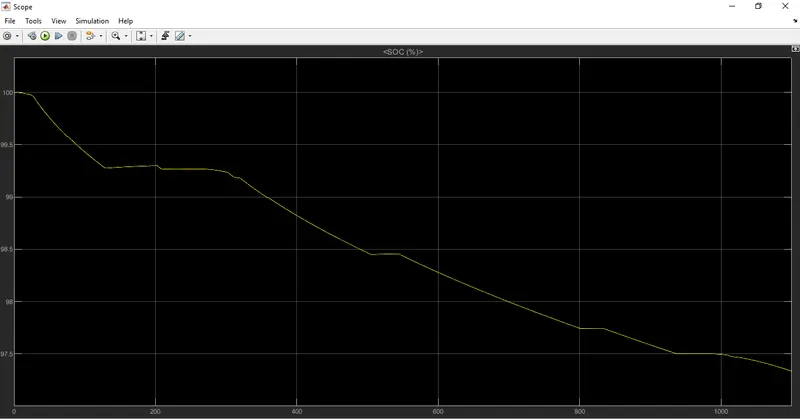
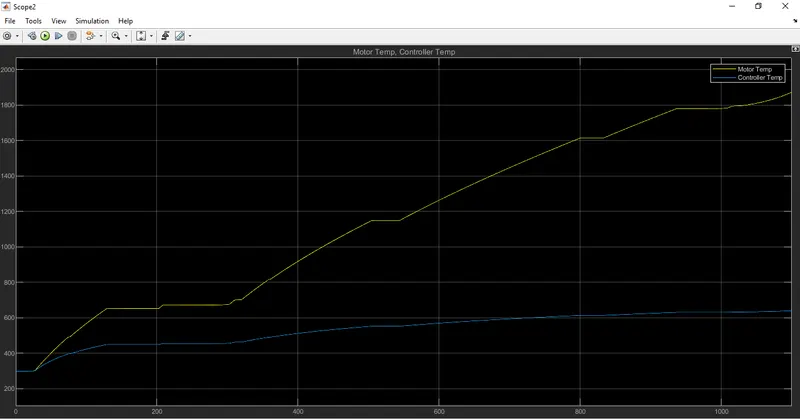
Similar to FTP75, FTP72 and HUDDS drive cycles show the change in SOC and temperatures of the motor controller and the motor over the period of 1500 and 1100 seconds. in FTP72, the battery soc reaches ~96% from 100% at 1500th second. The steady states are quite similar to the FTP75 drive cycle. The motor temperature and the motor controller temperature rises to ~4000K and ~800K which is quite higher than the FTP75 drive cycle. In the case of the HUDDS cycle, the SOC of the battery gets decreased from 100% to ~96.5% by 1100 seconds. The constant states are quite higher than both FTP75 and FTP72 cycles. The motor controller and motor temperatures are lower than the other drive cycles (~1900K and ~530K) due to the higher number of steady states at the drive cycle data thus leading to decreased operation of the motor controller to step up and stabilize the voltage.