Final Project: Electric Rickshaw modelling
Aim: To design a MATLAB model for electric rickshaw.
specification:
DC Motor: V_rated=200v, Pout_rated=7kw, speed_rated=3000rpm, rotot inertia=0.001 g*cm^2
Components used for modelling:
Vehicle body:
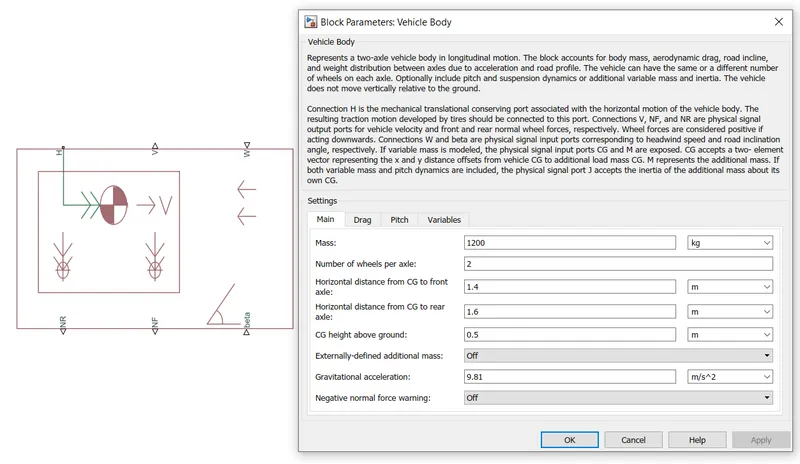
All the values are taken default that are present in the block
The drag force coefficients and the parameters required for calculation of forces are given in this block like frontal area, air density, acceleration due to gravity.
ports:
H= mechanical translational conserving port.
V= vehicle velocity
W= wind velocity
NR= normal force acting on real wheel
NF= normal force acting on front wheel
Wheel:
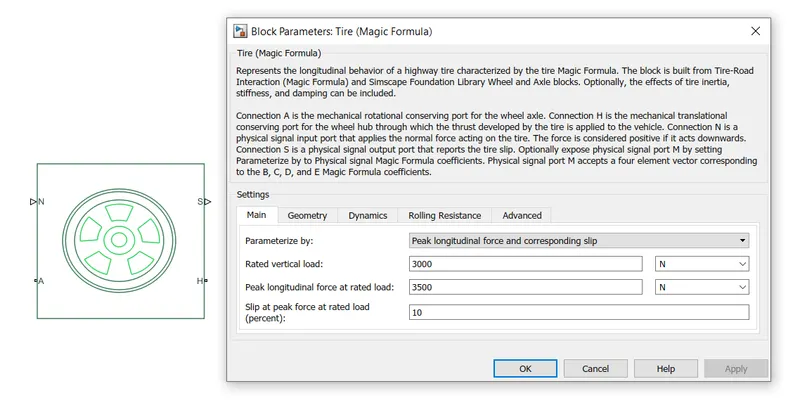
We can specify the rolling resistance of the wheels and all other values are taken as default.
ports:
N= normal force acting on wheel , if wheel in connected as rear wheel NR of vehicle body should be connected to N simililary if it is a front wheel then NF port should be connected to N.
A= axle
H= hub
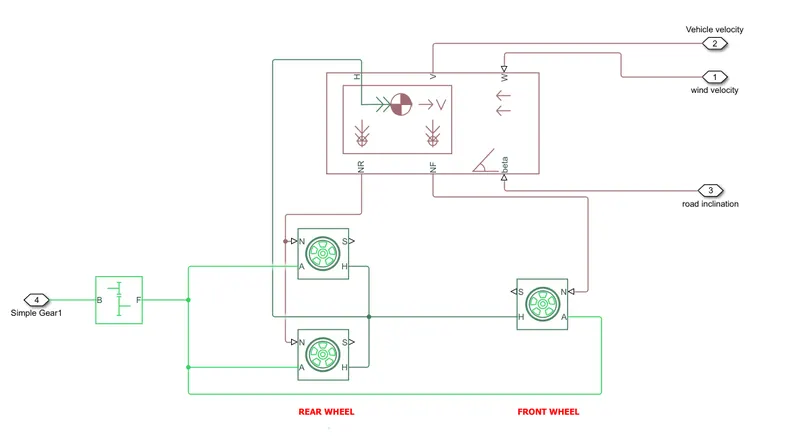
All axle port of three wheels of rickshaw are connected with each other and the gear is connected to the common axle point.
Gear:
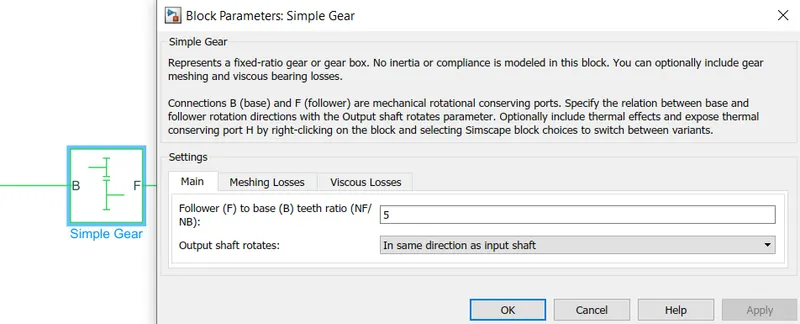
The rotor of DC motor is connected to the Base(B) port of gear and Follower(F) is connected to the axle.
The vehicle body, wheel and gear internconnections are as shown,
DC Motor arrangement:
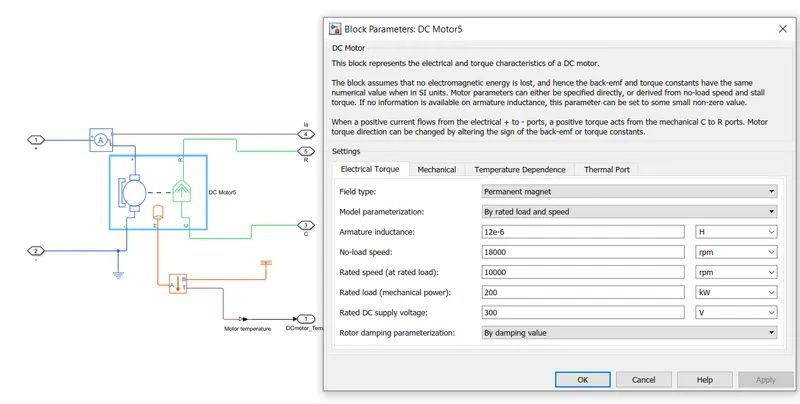
Generally the DC motor block do not have any thermal port so to enable the thermal port right click on the DC motor block
click on simscape on the top > Block choice > click on enable thermal port.
A temperature sensor is used to sense the temperature rise of the DC motor.
All the thermal dependence and thermal port parameters are taken default.
the model parameterization is done based rated power and rated speed. The main field field of DC motor is assumed as permanent magnet.
H bridge controller:
The supply to the motor comes from H bridge where there is an internal supply which is not visible. Here in this model is not actuallu used in the model to supply the H bridge and to motor but we using it virtually to take SOC estimate calculation.
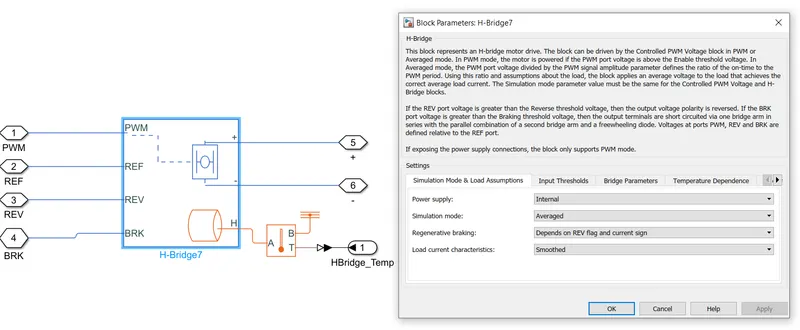
Just like DC motor H bridge do not have thermal port so follow the same procedure as for DC motor to enable the thermal port to get the temperature rise.
Simulation mode is choosen averaged because the output voltage is a constant whose value is equal to the average value of the PWM signal.
Regenerative braking is enabled based on the REV input port and current sign.
Input ports:
PWM: takes the PWM signals from output of controlled PWM block
REF: connected to ground.
REV: reverse port, when signal to this port is greater than the Reverse threshold voltage defined in the Input thresholds in the block then H bridge supply polarity is reversed, so as to allow for reverse current from the supply. The source for this signal is Longitudinal driver block.
BRK:Brake port, when signal to this port is greater than the Brake threshold voltage defined in the Input thresholds in the block then H bridge shorts the supply terminals of H bridge , so as to allow for reverse current from the supply. The source for this signal is Longitudinal driver block.
Controlled PWM Voltage:
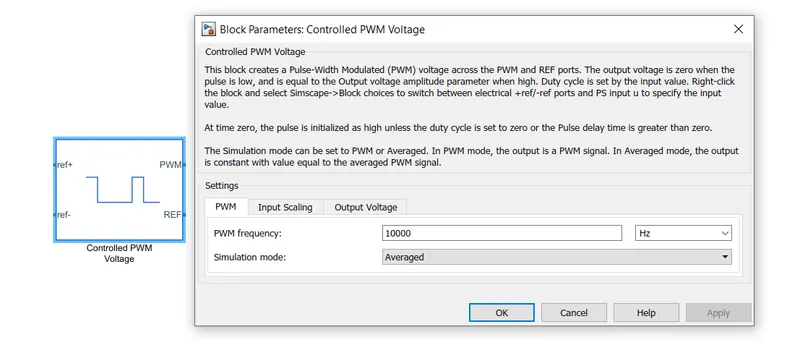
The swithching frequency of carrier wave is set in the block itself alsp the output voltage voltage of the PWM block is also set.
The switching mode must be set averaged in both h bridge and controlled pwm voltage block
Input scaling implies that at how the output voltage vary with the duty cycle percentage.
Input ports:
ref+: reference signal for pwm generation which the acceleration command from the Longitudinal driver block.
Ref-: connected to ground(0V).
Output port:
PWM: the generator PWM signal is fed to Hbridge
REF: connected to ground.
Longitudinal driver:
Its acts the driver in a vehicle producing the accelerating ans decelerating commands.
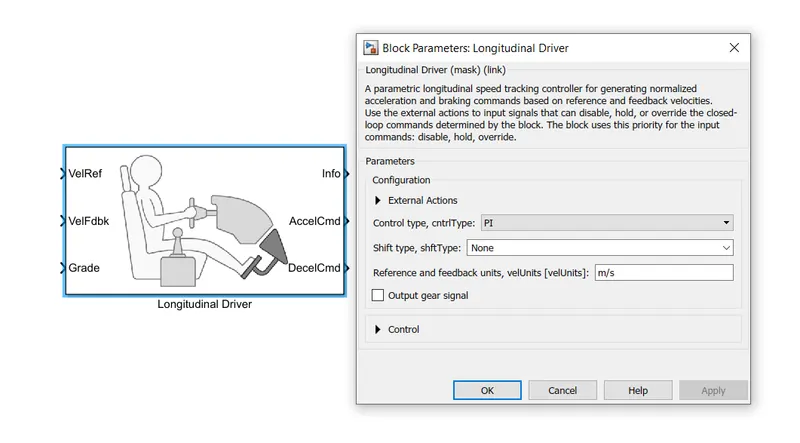
The deceleration command is given to the BRK port of H bridge such that it performs braking operation only when the command voltage level is greater than the threshold voltage.
The acceleration command is given to the ref+ port of controlled PWM voltage which generates PWM pulses to the H bridge.
Both the command are given through controlled voltage sources as shown in the main model.
The velocity reference is given from the drive cycle source, vehicle feedback is the output velocity feb back from vehicle body block, so the driver tries to minimize the error between reference and feedback and make vehicle follow the reference.
Drive cycle:
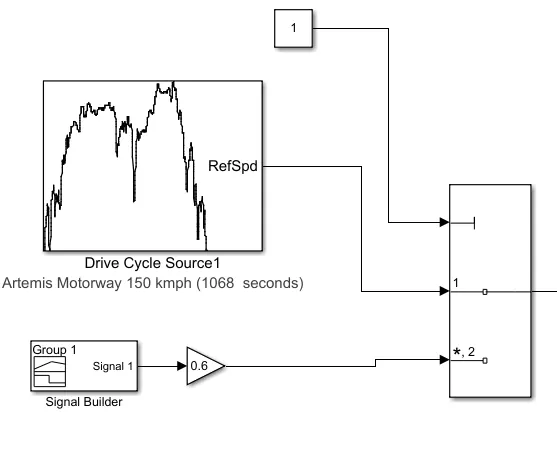
The drive cycle source block provide the vehilce velocity reference so that output velocity of vehicle follows the reference velocity. Drive cycles can also be generated by singal builder block manually creating a drive cycle, the various drive cycle source are interfaced with longitudinal driver block through a multiport switch, where the top most input port decides which drive cycle to be given to driver.
State of Charge(SOC) Estimate:
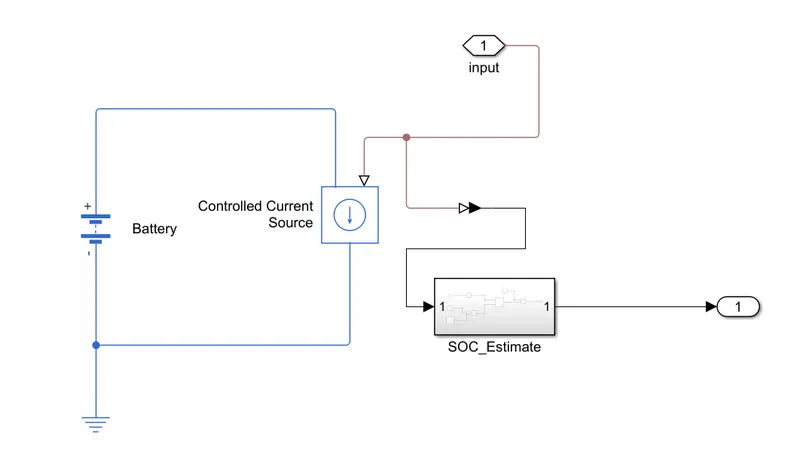
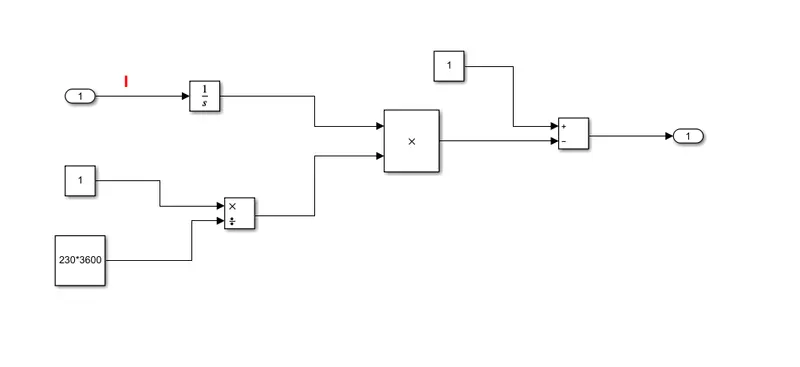
The armature current from the DC motor is fed as a control signal to controlled current source connected to the battery.
Here Current source is connected in such direction that when I_a is positive(Motoring of DC motor) the battery current should be flowing out of Battery indicating discharge and when I_a is negative(braking or regenerative braking) the battery current should be into the battery indicating charging of the battery.
For SOC estimation formula,
SOC %= 1- (I_a * 1/(Ah*3600))
Ah the ampere hour rating of the battery.
Energy consumption calculation:
model:
controller: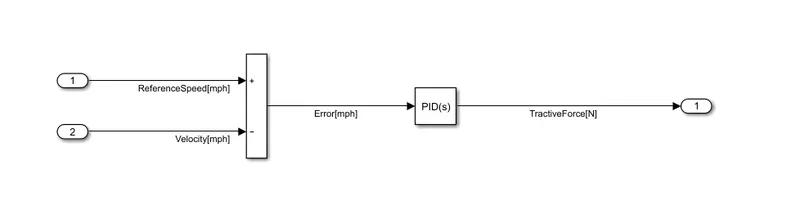
Energy_calculation: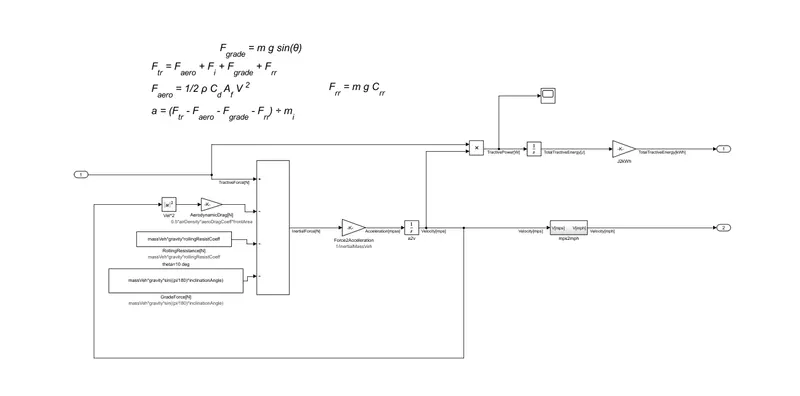
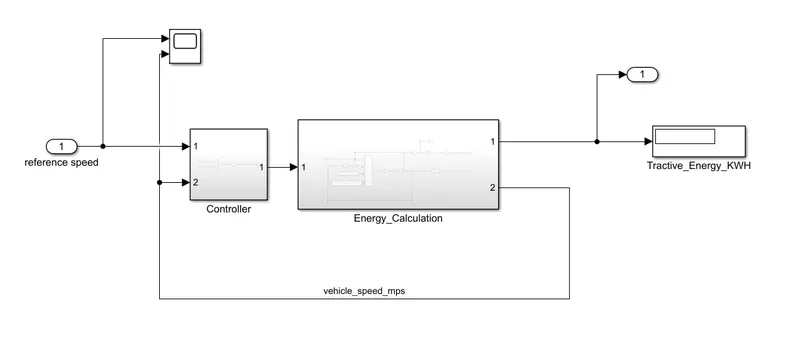
Based on the formula for tractive force, a mathematical model is created.
since the force is dependent on velocity of the vehicle we need to always track velocity and error between reference and vehicle velocity is 0, for this the difference between reference and actual velocity is fed to a controller who ouput is tractive force.
vehicle model: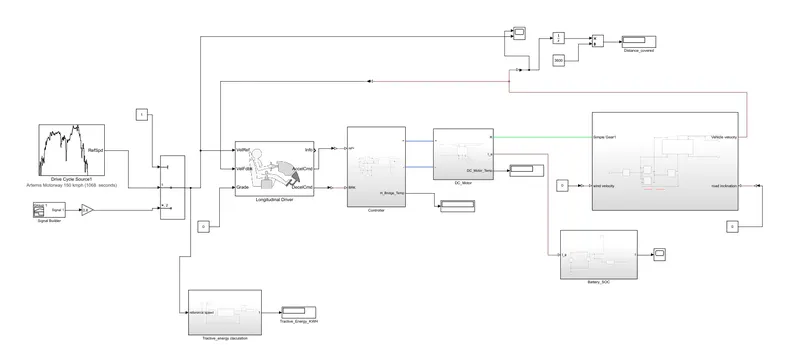
Results:
1. drive cycle: Artremis Motorway 150kmph
Energy_consumed: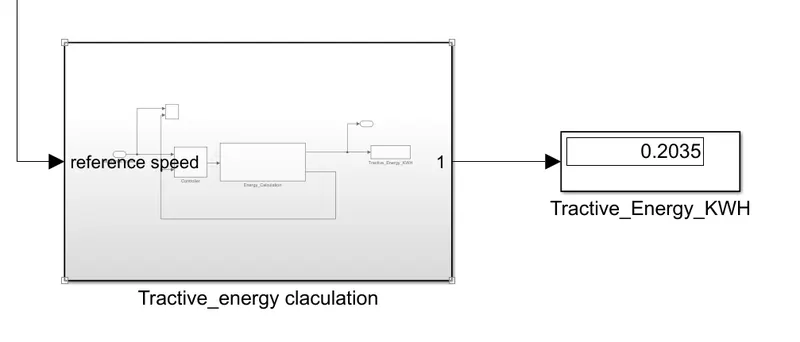
Temperature rise of controller and DC motor: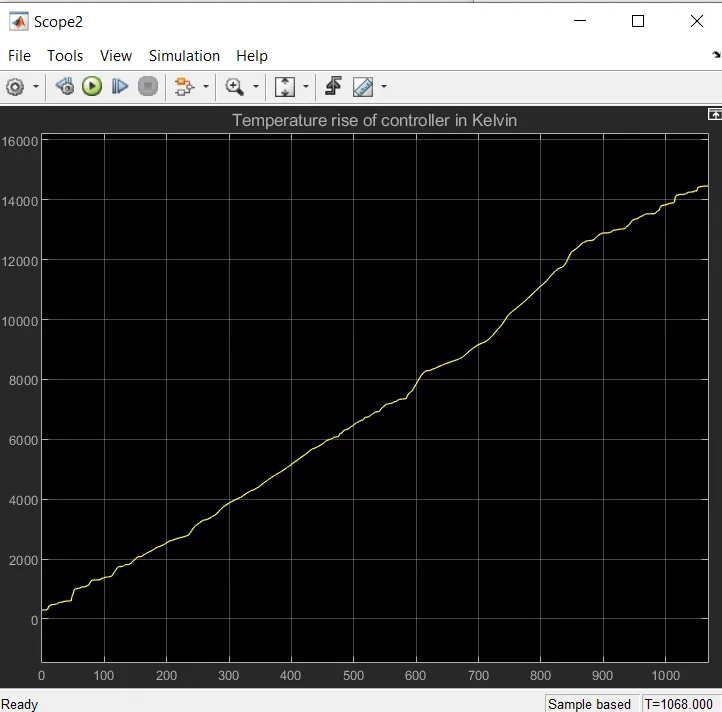
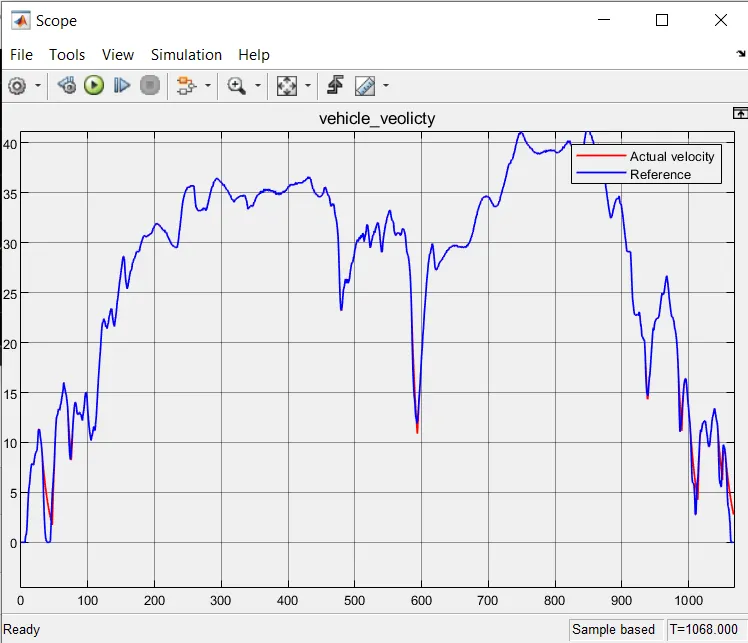
When the acceleration of vehicle is more there is quite fast rate of increase in temperature rise, consider at 600 sec instant where there is steep acceleration in velocity and also in temperature rise. similarly when there is decelaration or less steep acceleration the rate of increase in temperature is also considerably less.
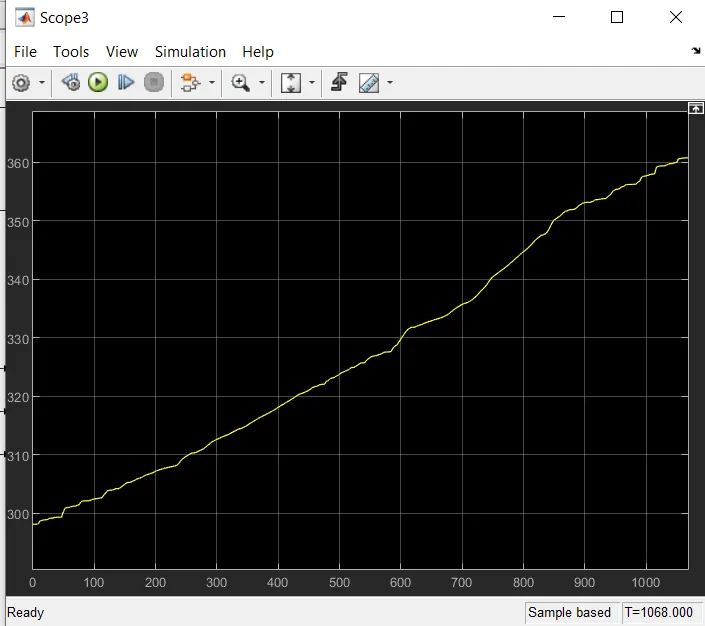
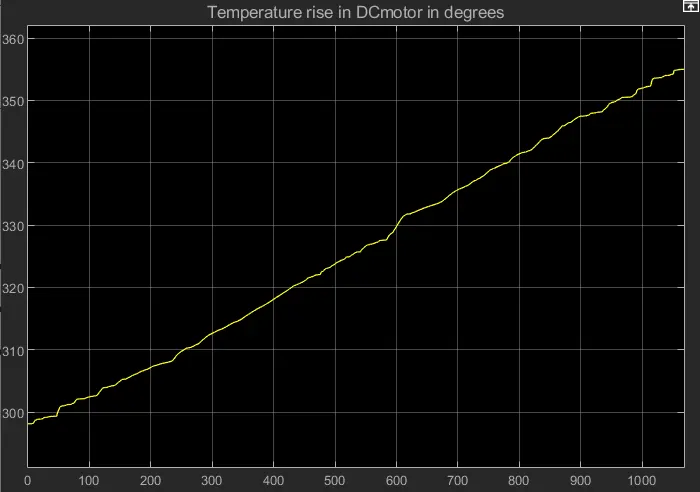
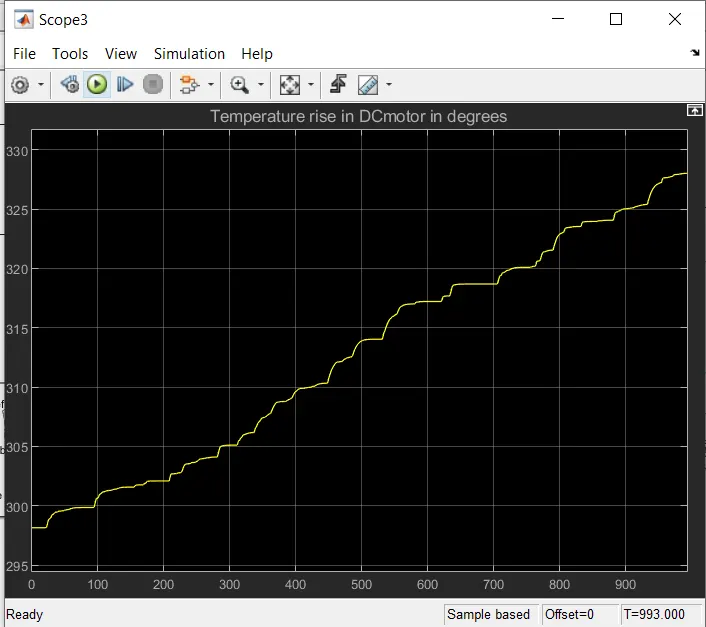
The same explanation goes with temperature rise of DC motor but here the thermal mass of DCmotor is more than compared with Motor controller so the magnitude of temperature is less compared to controller. Thermal mass value denotes the amount of joules required for 1 degree increment in Kelvin temperature.
2.drive cycle: Artremis Motorway 130kmph
Energy consumed: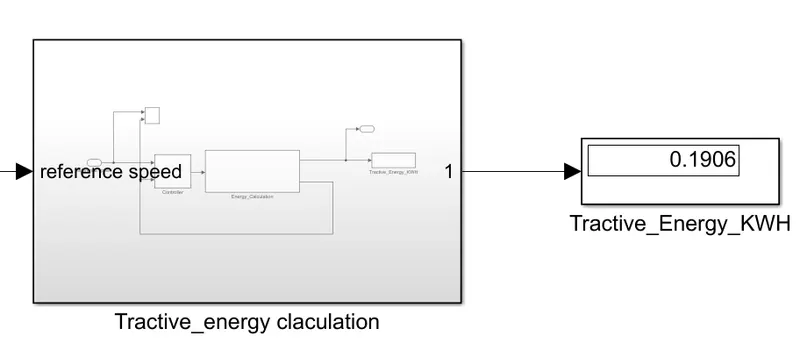
Temperature rise of controller and DC motor:
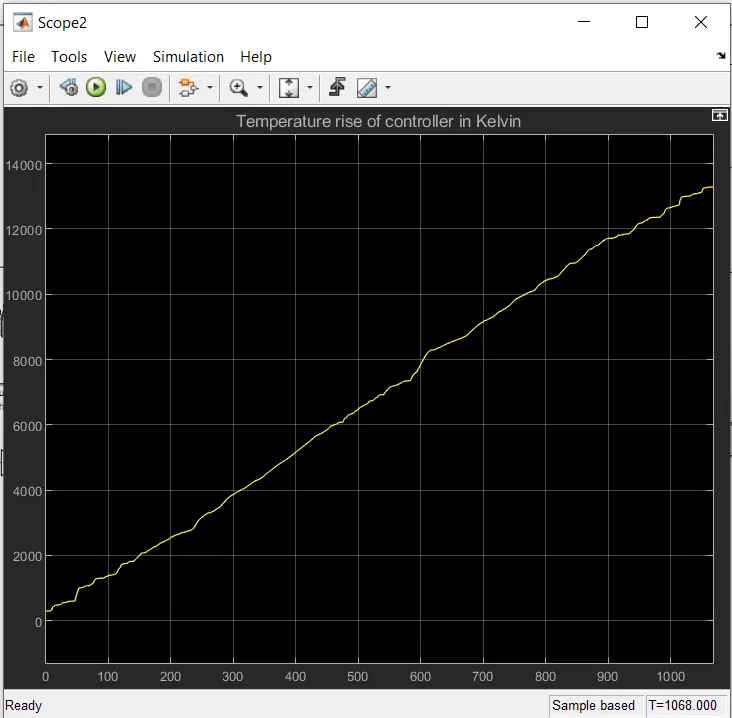
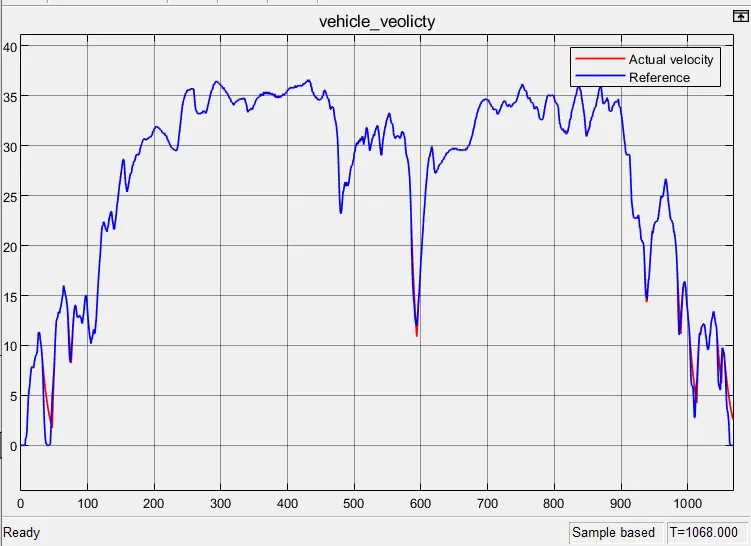
The same goes with the explanation as previous drive, but here the energy consumed is less comapared previous drive cycle because speed is less and also time for which the drive cycle exists is less compared to previous one.
3. drive cycle: Artemis Urban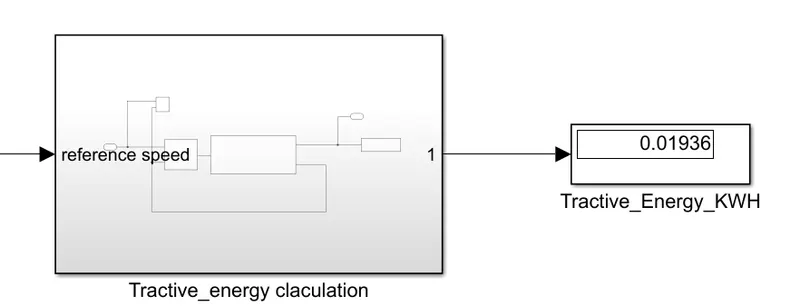
Temperatue rise in controller and motor: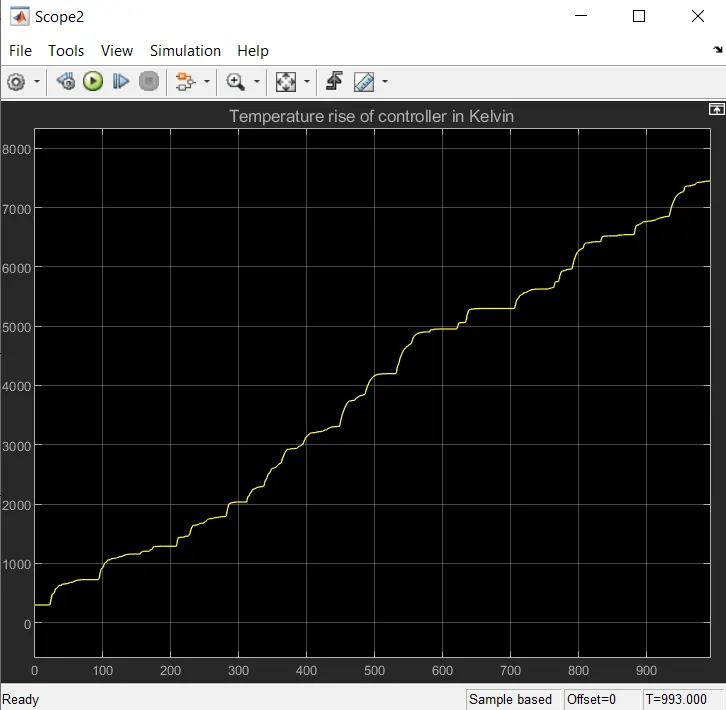
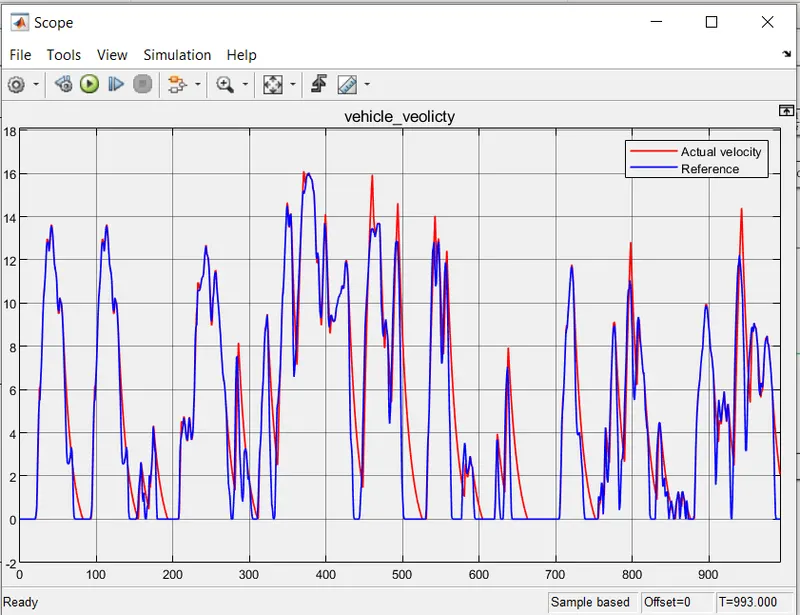
The temperature rise is less because there are more number of times where the vehicle speed is 0, so the temperature is compared to other two drive cycles., also we can see in the graph of actual velocity, reference where the actual velocity (red colour) is not following the reference velocity exactly because of the mass of the vehicle which inturn has more intertia.
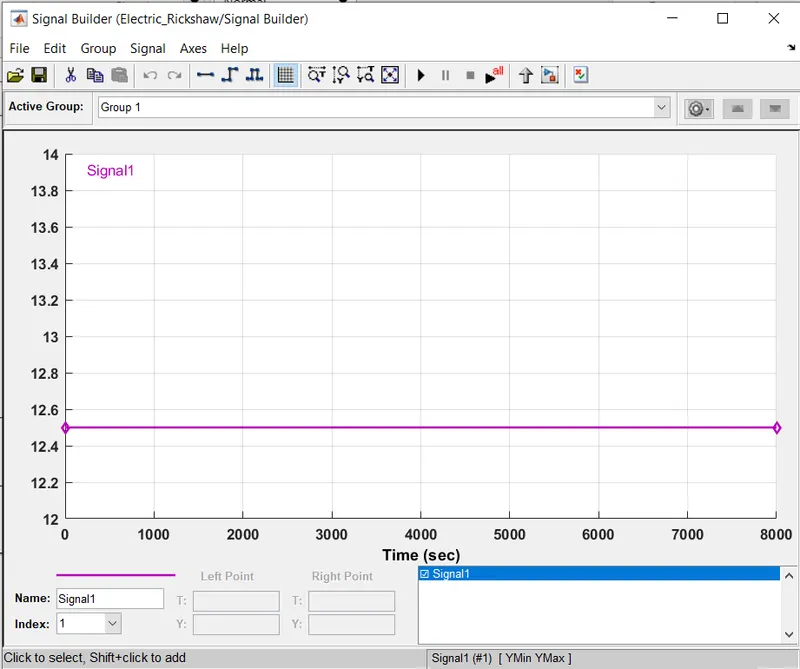
4. cosntant speed of 45kmph for 100km:
45kmph= 45*5/18=12.5 m/sec
Time required= distance/speed = 100000/12.5= 8000 sec
velocity reference plot using signal builder
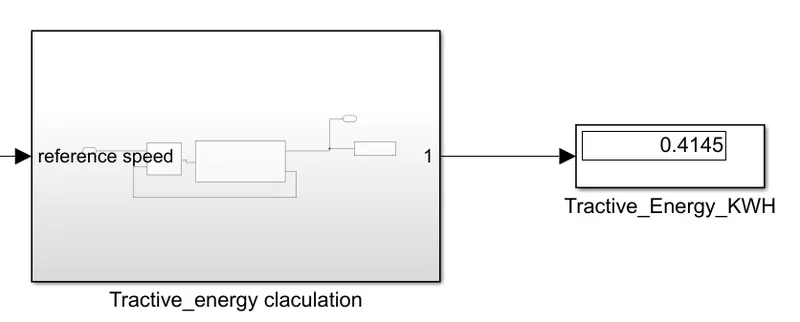
energy consumed:
temperature rise in controller and motor:
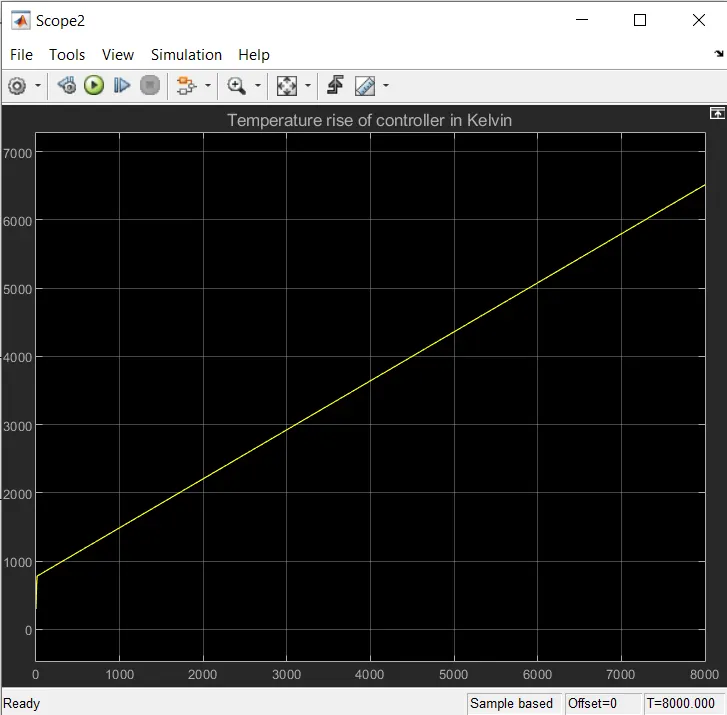
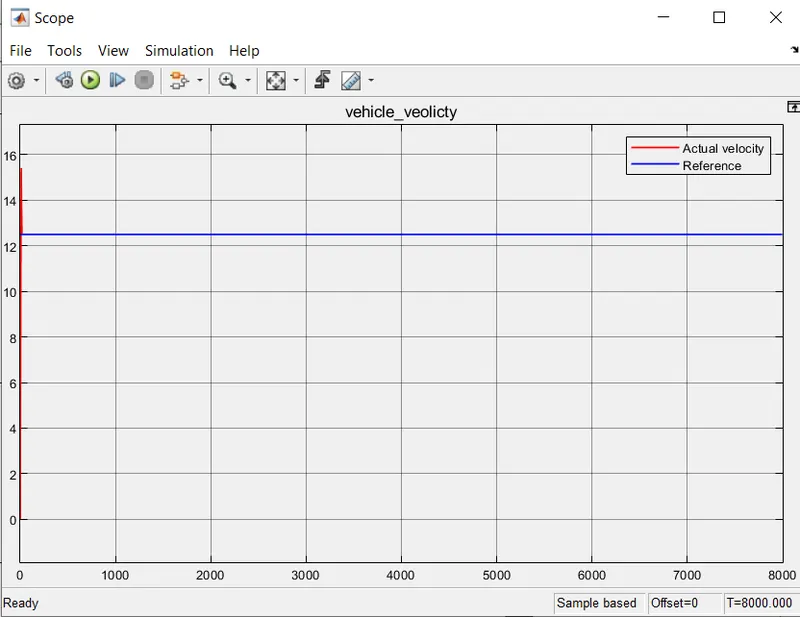
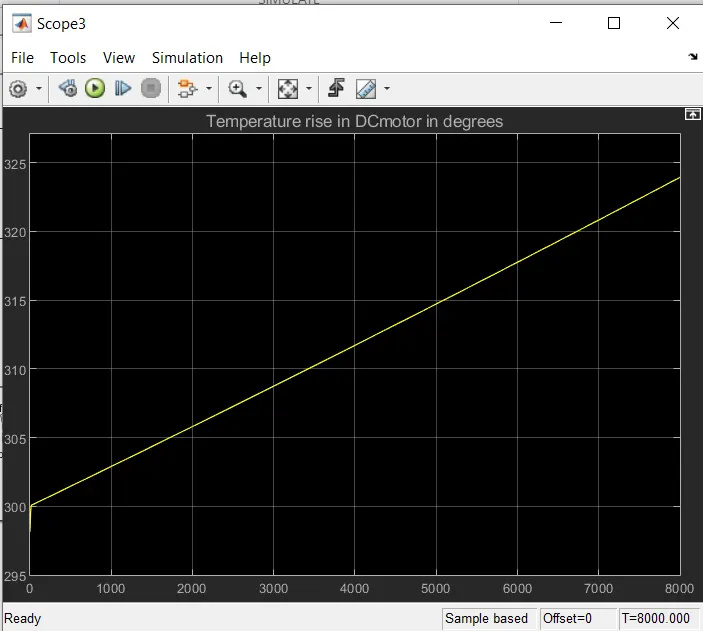
Since the velocity is constant the temperatiure rise is linearly increasing in both motor and controller