Final Project: Design of an Electric Vehicle
Design of electric vehicle model using MATLAB / SIMULINK:
What is an electric Vehicle?
An electric vehicle (EV) is one that operates on an electric motor, instead of an internal-combustion engine that generates power by burning a mix of fuel and gases.
Types of Electric vehicles
HYBRID ELECTRIC VEHICLE
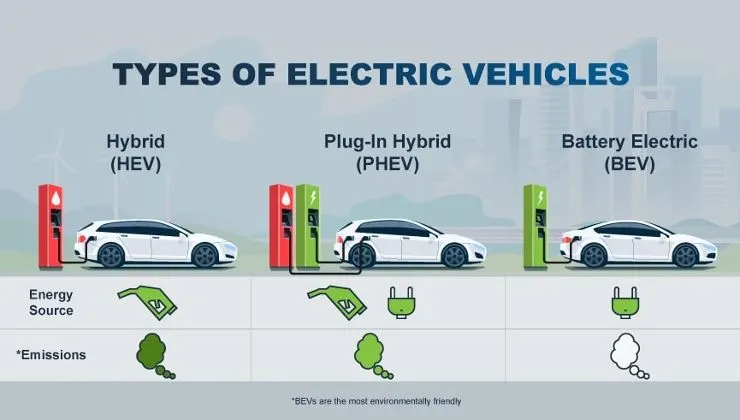
A hybrid electric vehicle (HEV) is a type of hybrid vehicle that combines a conventional internal combustion engine(ICE) system with an electric propulsion system (hybrid electric drivetrain).
PLUG IN HYBRID VEHICLE
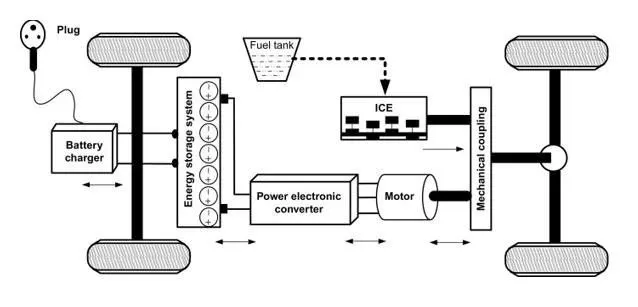
A plug-in hybrid electric vehicle (PHEV) is a type of hybrid electric vehicle that combines a gasoline or diesel engine with an electric motor and a large battery that can be recharged by plugging into an electrical outlet or electric vehicle charging station.
Plug-in hybrids can run in at least two modes: "all-electric," in which the motor and battery provide all the car's energy; and "hybrid," in which both electricity and gasoline are employed.
BATTERY ELECTRIC VEHICLE
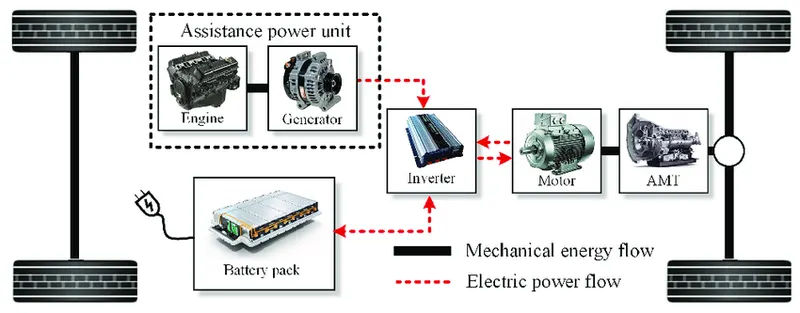
Battery Electric Vehicles, also called BEVs and more frequently called EVs, are fully electric vehicles with rechargeable batteries and no gasoline engine.
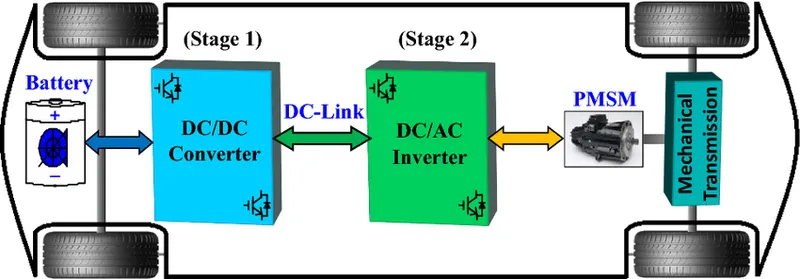
Basic block model of EV:
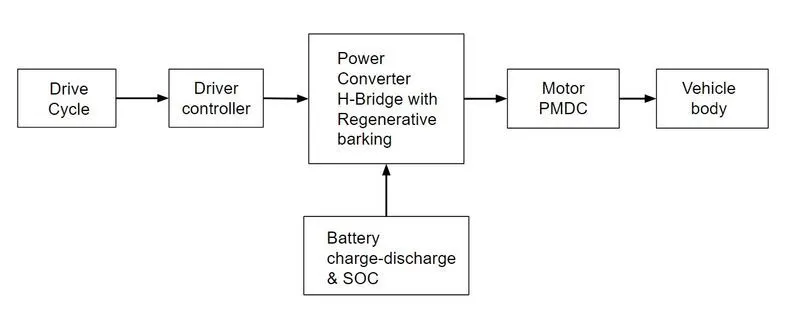
Drive cycle: A drive cycle is typically represented by a series of data points which plots vehicle speed against time. Driving cycles are produced to assess the performance of vehicles in various ways, including fuel consumption and pollutant emissions.
Driver controller: The electric vehicle controller is the electronics package that operates between the batteries and the motor to control the electric vehicle's speed and acceleration much like a carburetor does in a gasoline-powered vehicle.
Power converter with regenerative braking:They are used to process and control the flow of electrical energy by supplying required voltages and current to the motor.
Battery: This the powerhouse which supplies the energy required to drive the vehicle.
Motor: Motor which converts the electrical energy into the mechanical energy at the vehicle through a transmission system.
Vehicle body: This is where the output is achieved via the motor power is transferred to the wheel considering the different forces and resistance and compare with the input drive cycle.
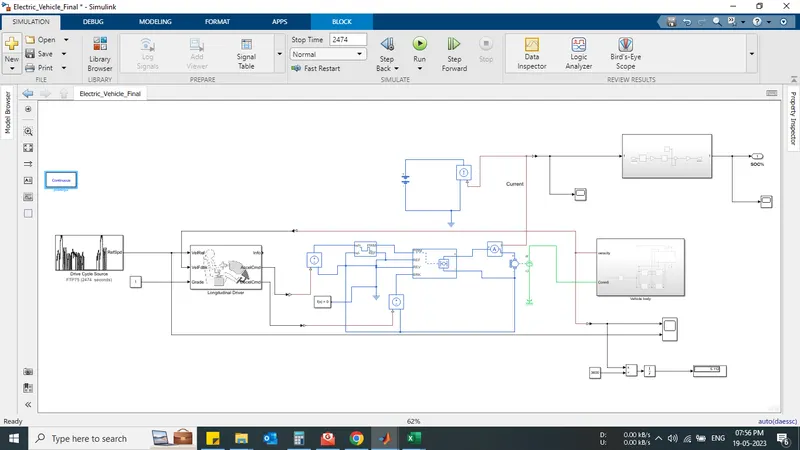
Electric vehicle model:
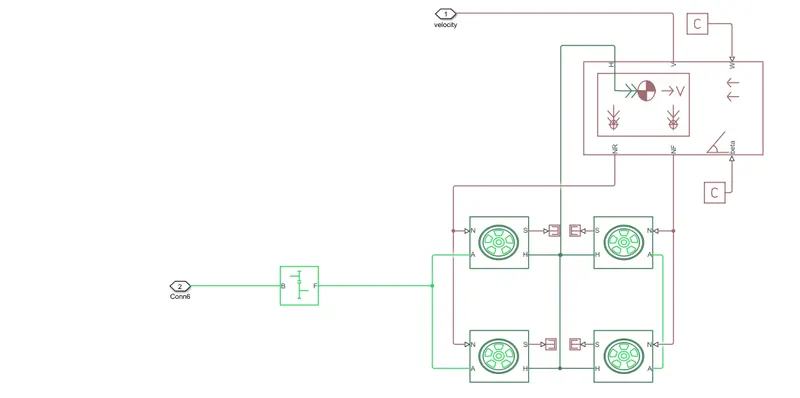
Vehicle Body system:
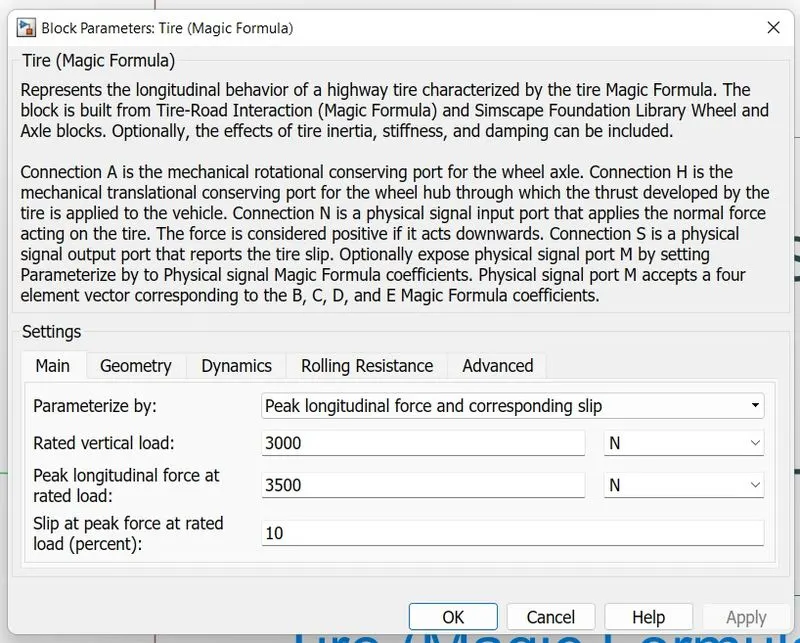
Tire ( magic frame):
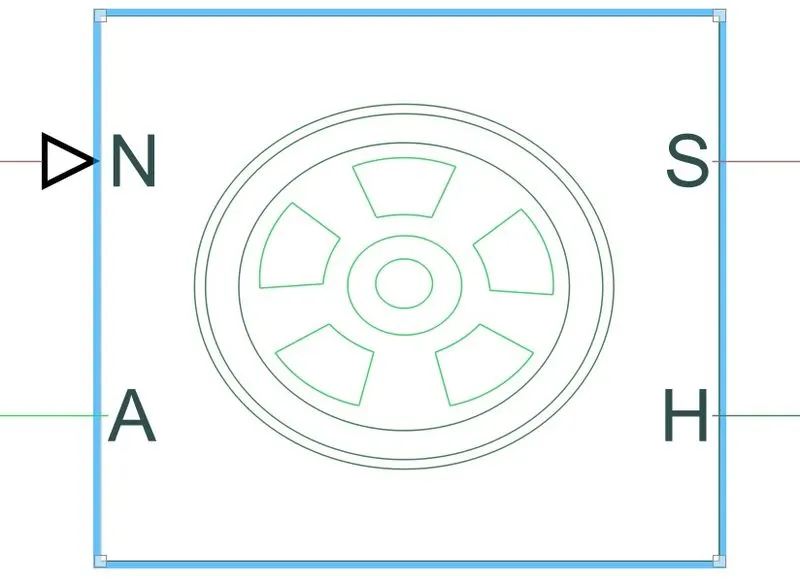
The Tire-Road Interaction (Magic Formula) block models the interaction between the tire tread and road pavement. The longitudinal force arising from this interaction is given by the magic formula, an empirical equation based on four fitting coefficients. Tire properties such as compliance and inertia are ignored.
Simple Gear:
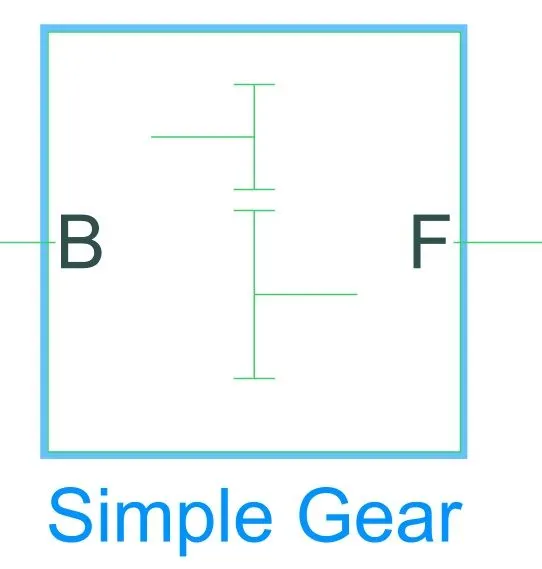
This example shows a simple gear coupling two inertias (shafts). The gear ratio between the follower (F) and base (B) is 2:1. Thus the angular velocity of the follower shaft is half the angular velocity of the base shaft. The follower shaft torque is twice the base shaft torque.
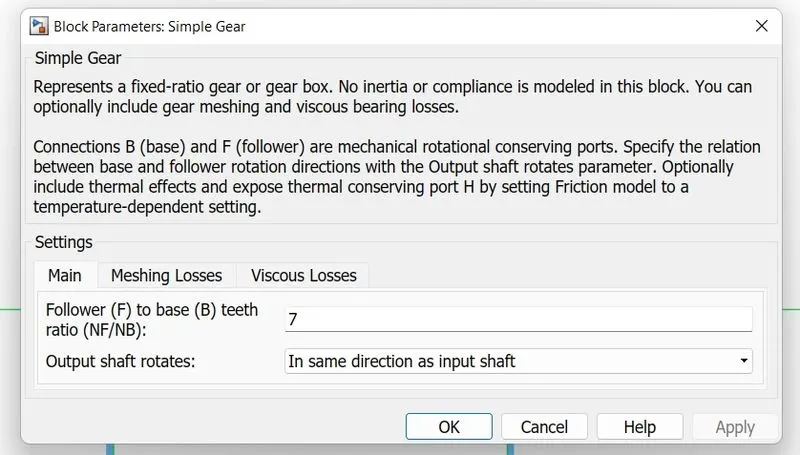
here we had kept a gear ratio of 7 more the gear ratio give better speed with better traction power. beacuse torque is directly is directly proportional to the speed. The gear ratio is high at the start of the vehicle as it requires more torque and as the speed increases,
Vehicle Body :
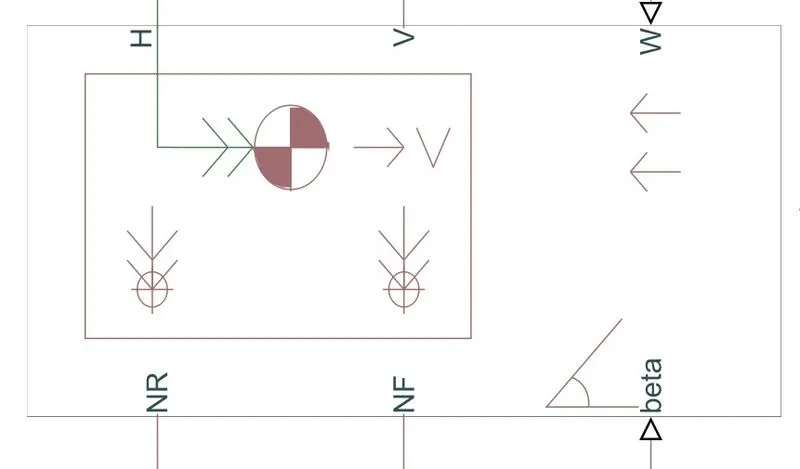
The Vehicle Body block represents a two-axle vehicle body in longitudinal motion.
H- It is the mechanical translation converting port associated with the horizontal motion of the vehicle body
NR- Rear normal wheel forces
NF- Front normal wheel forces
V- Vehicle velocity
Beta- Road inclination angle
W- Headwind speed
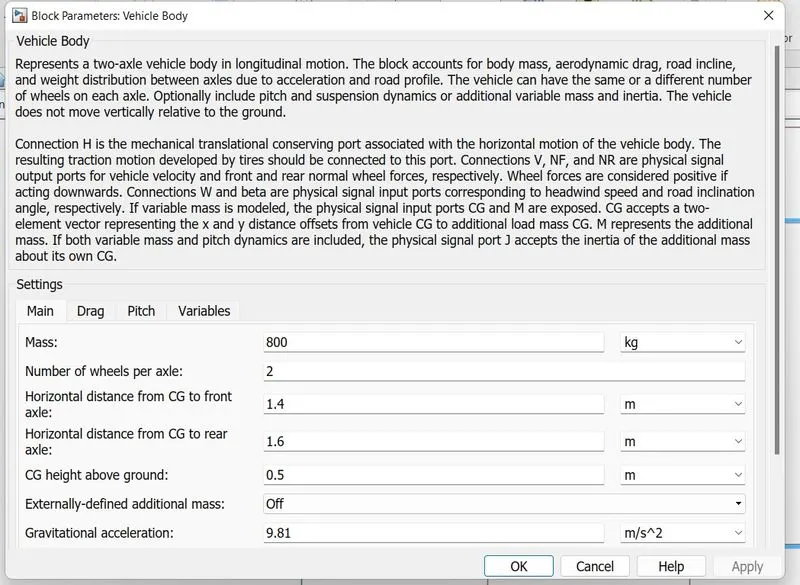
SOC AND BATTERY SYSTEM:
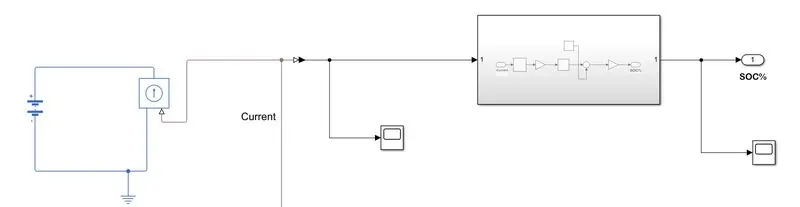
SOC:
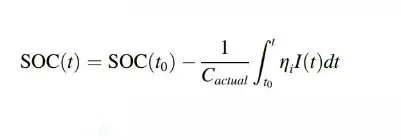
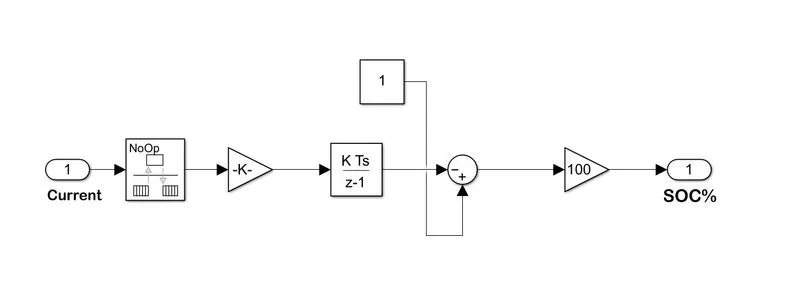
This will determine the voltage level in the battery at each point of simulation.
BATTERY:
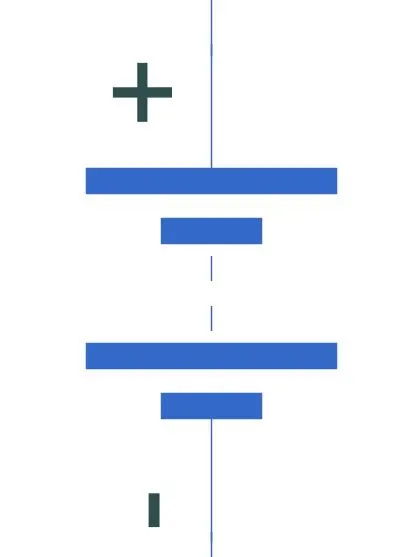
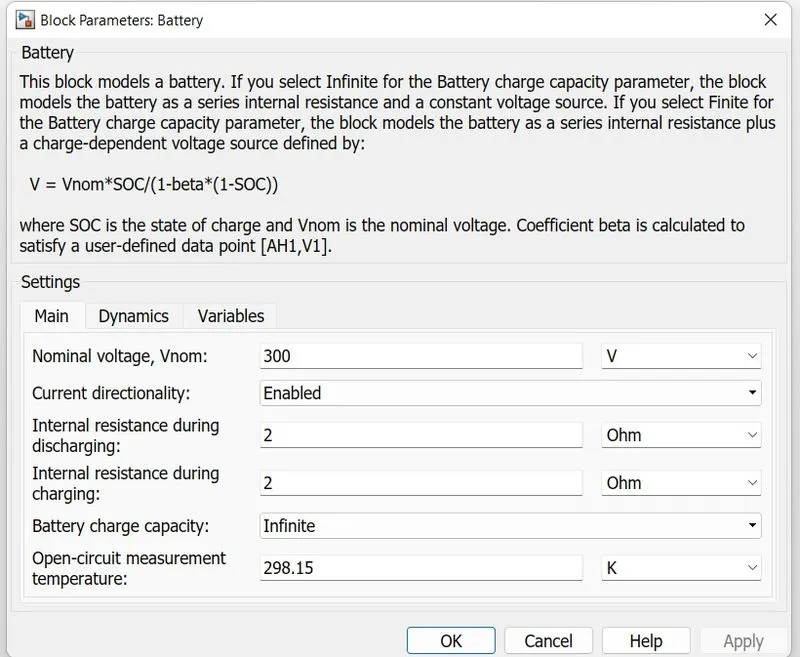
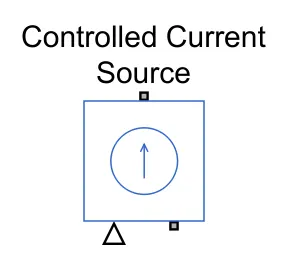
Controlled current source:
The block represents an ideal current source that is powerful enough to maintain the specified current through it regardless of the voltage across it. The output current is I = Is, where Is is the numerical value presented at the physical signal port.
Power converter:
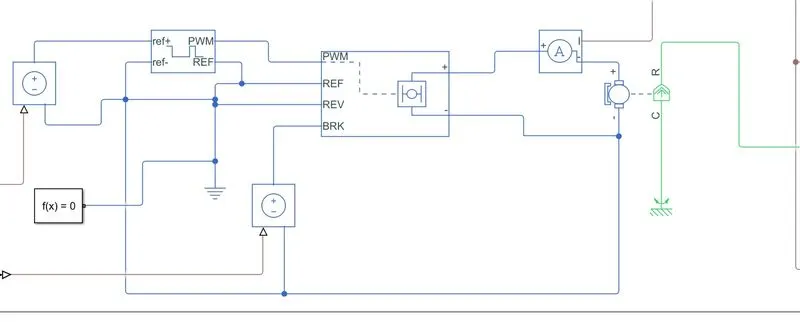
DC MOTOR:
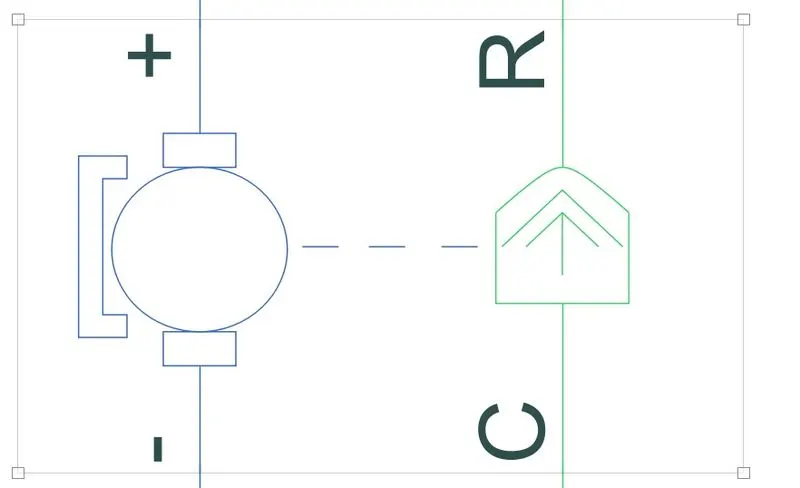
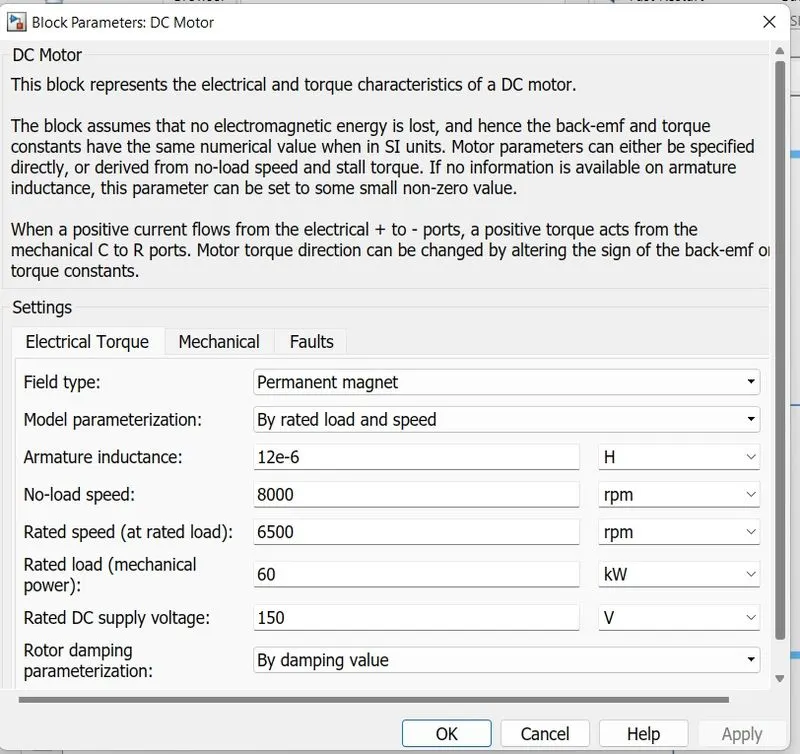
This block represents the electrical and torque characteristics of a DC motor.
When a positive current flows from the electrical + to - ports, a positive torque acts from the mechanical C to R ports. Motor torque direction can be changed by altering the sign of the back-emf or torque constants.
H BRIDGE:
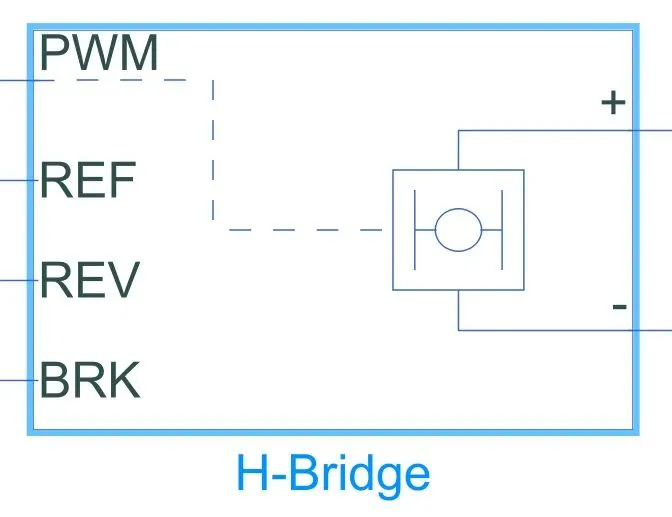
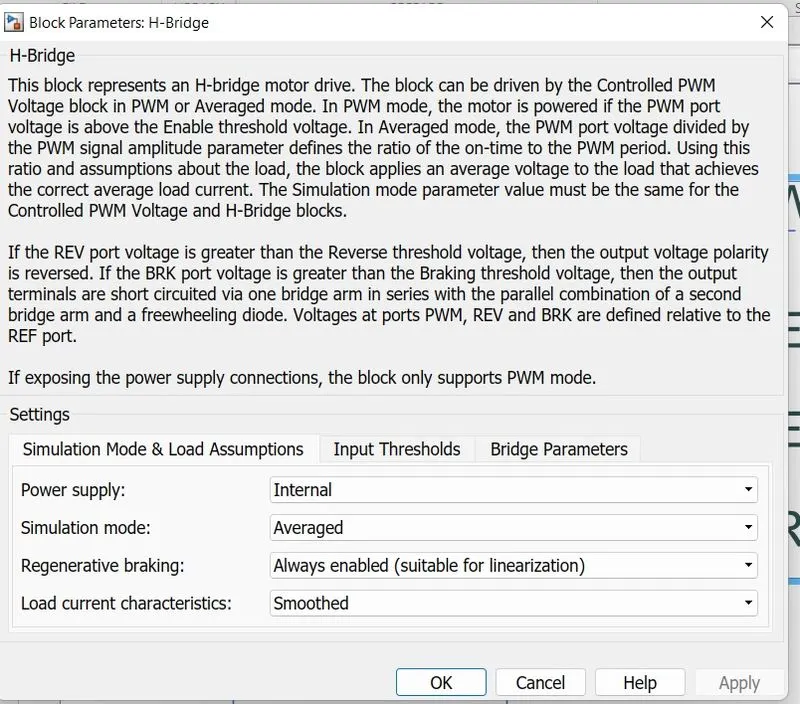
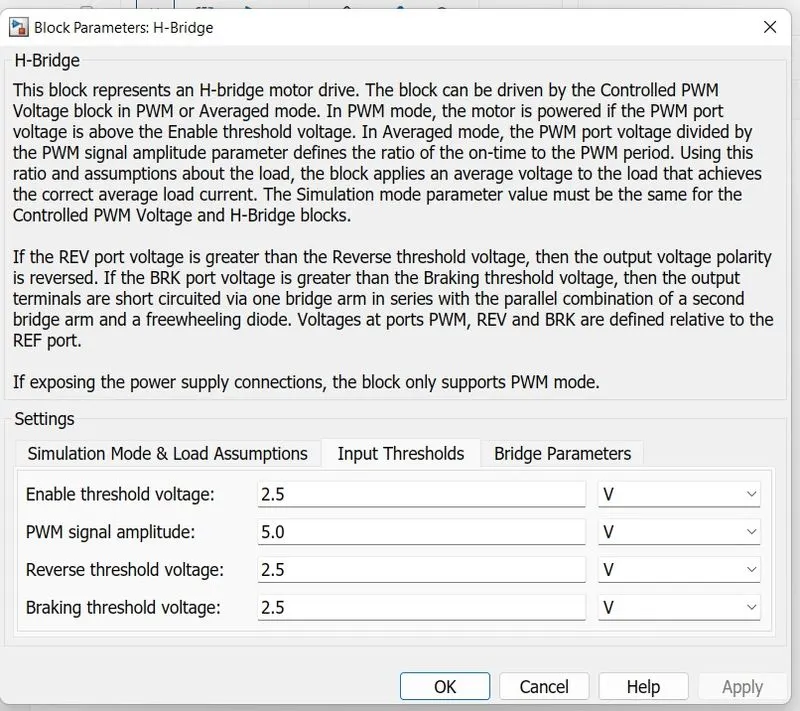
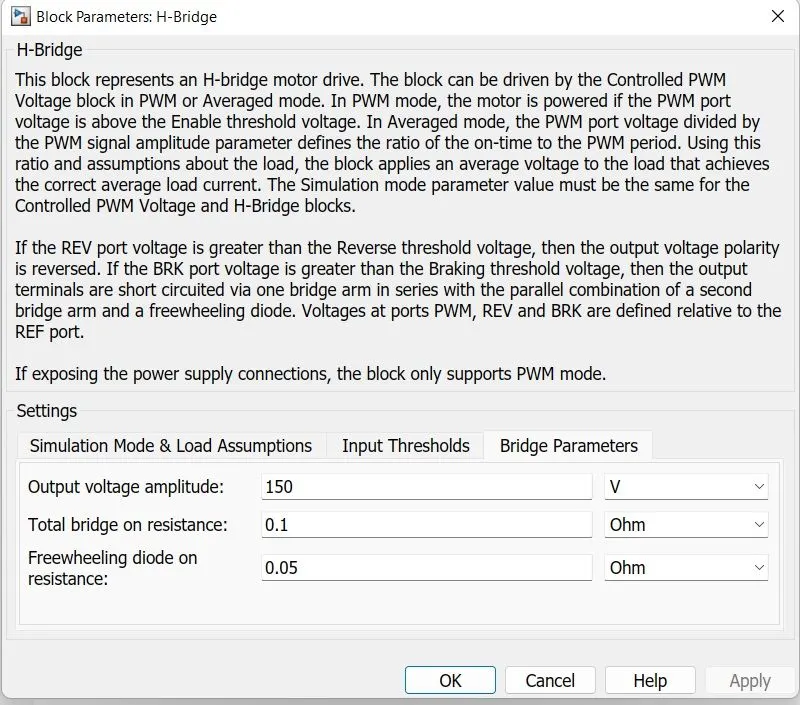
The H-Bridge block output is a controlled voltage that depends on the input signal at the PWM port. If the input signal has a value greater than the Enable threshold voltage parameter value, the H-Bridge block output is on and has a value equal to the value of the Output voltage amplitude parameter. If it has a value less than the Enable threshold voltage parameter value, the block maintains the load circuit.
Controlled PWM Source:
This block creates a Pulse-Width Modulated (PWM) voltage across the PWM and REF ports. The output voltage is zero when the pulse is low, and is equal to the Output voltage amplitude parameter when high. Duty cycle is set by the input value.
The Simulation mode can be set to PWM or Averaged. In PWM mode, the output is a PWM signal. In Averaged mode, the output is constant with value equal to the averaged PWM signal.
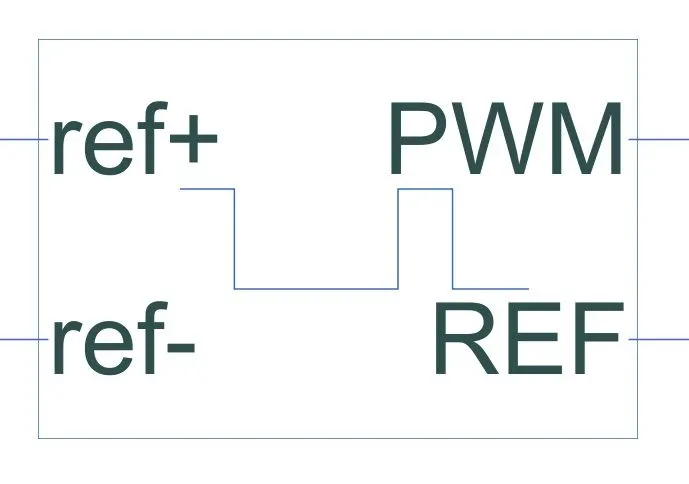
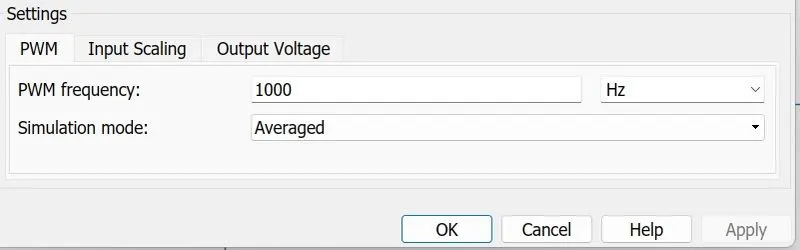
PWM frequency is set to 1000 Hz and the simulation mode is set to average .
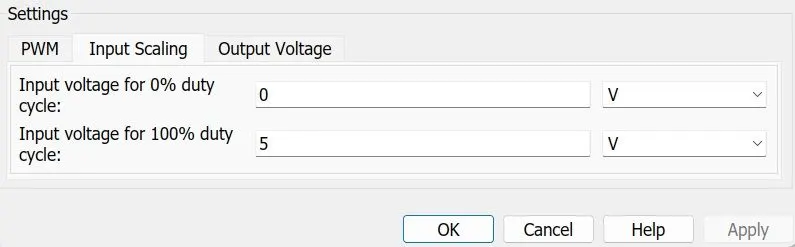
input voltage for 100% duty cycle is keep at 5 V as default value.
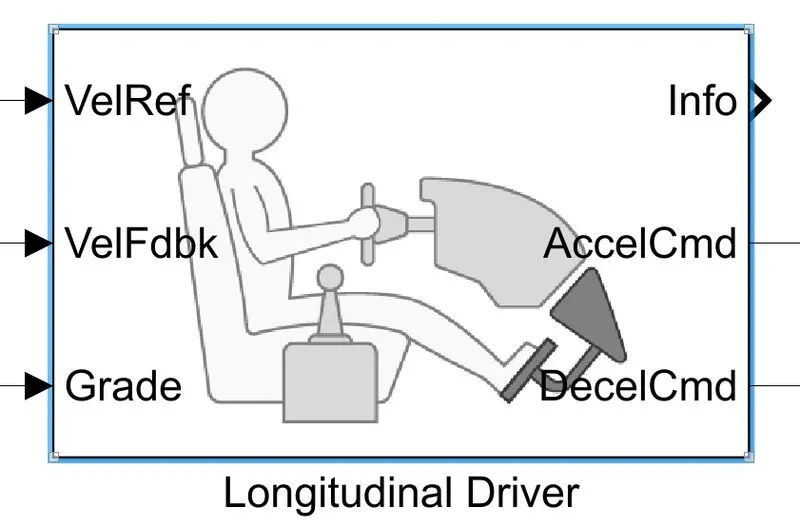
Longitudinal driver:
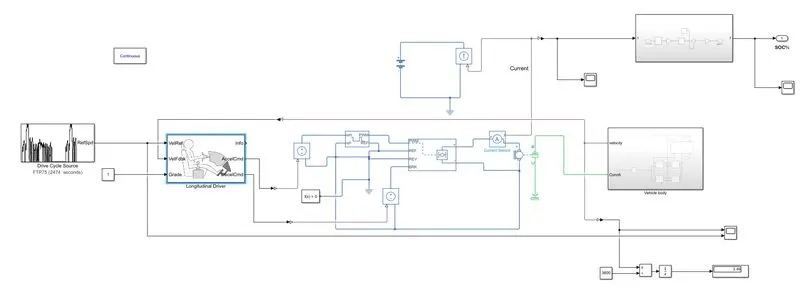
The input from the drive cycle is attached to VelRef port, the feedback is gained from the vehicle body which acts as feedback signal is connected to VelFdbk. The AccelCmd & DecelCmd are the output signal given for accelerating and braking to the vehicle. A constant block is attached to the Grade port as road grade angle is 0 in our case, i.e the vehicle is running at a straight road.
Drive cycle:
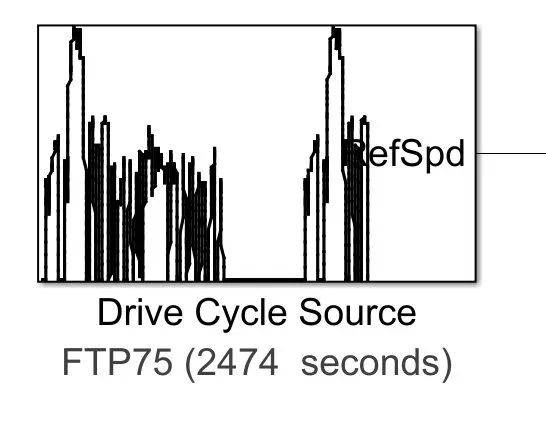
The Drive Cycle Source block generates a standard or user-specified longitudinal drive cycle. The block output is the specified vehicle longitudinal speed, which you can use to
-
Predict the engine torque and fuel consumption that a vehicle requires to achieve desired speed and acceleration.
-
Study, tune, and optimize vehicle control, system performance, and system robustness over multiple drive cycle
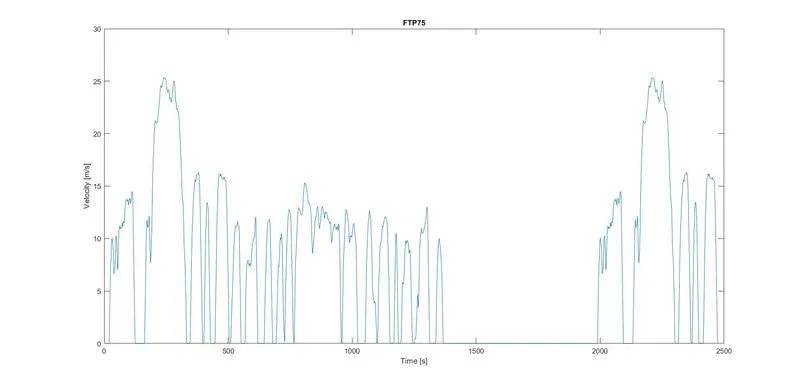
Here FTP75 Drive cycle is used
Plot of ftp 75 drive cycle:
Vehicle model of electric vehicle:
Simulation Results:
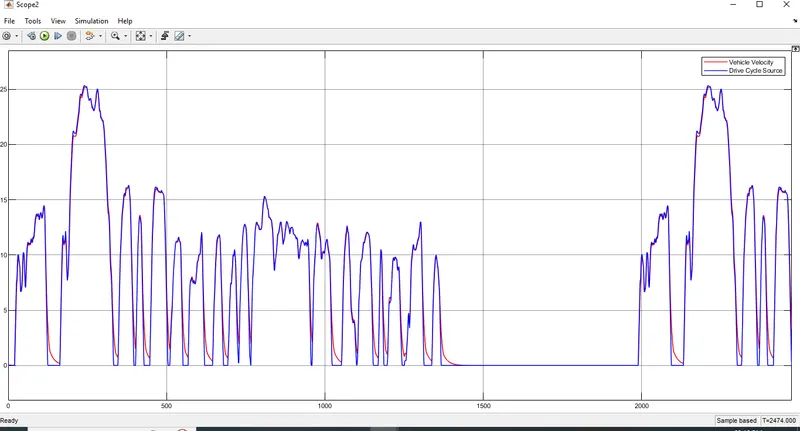
Velocity Characteristics:
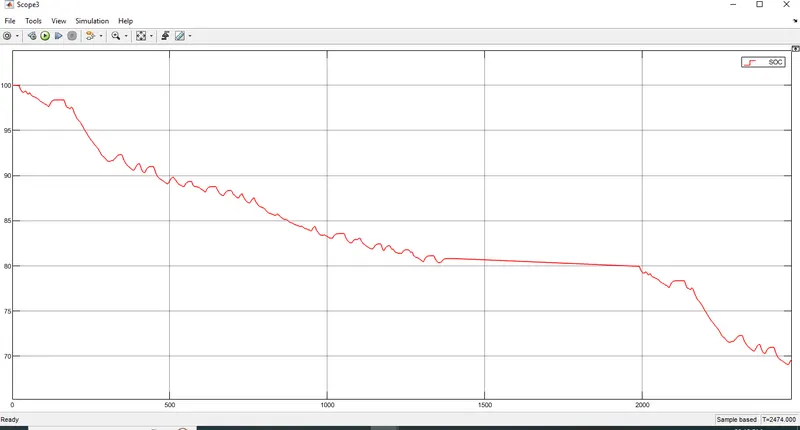
SOC% : It is the state of charge of the battery which decreases when the vehicle accelerated and slightly increases when the vehicle decelerates.
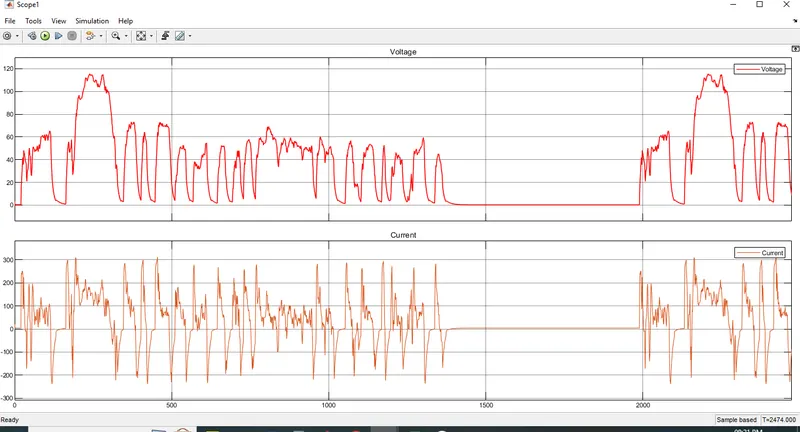
Voltage and Current plot:
CONCLUSION:
- EV model has been created with the necessary block components using the SIMULINK software and the model has been simulated.
- Using of FTP75 Drive cycle is used to analyse the performance if the vehicle.
- SOC of the battery is decreased to 68% from 100% while one time of drive cycle is performed.
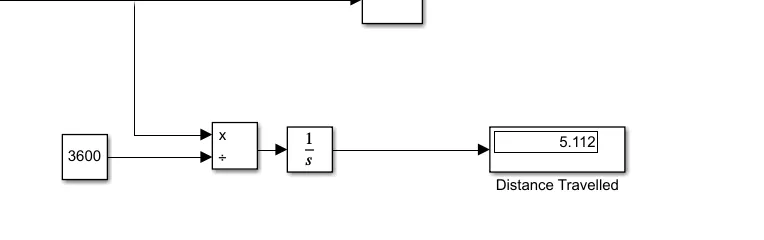
- Distance travelled by the vehcle is 5km.