Final Project: Design of an Electric Vehicle
AIM - Create a MATLAB model of Electric car which uses a battery and a DC motor.
OBJECTIVE - Study the modeling of electric vehicle and different blocks used in MATLAB modeling of EV and also prepare a detailed report on electric car modeling using a suitable duty cycle.
INTRODUCTION -
Electrical Vehicle:
The vehicle which uses the Electrical motor as Engine and Electrical power as fuel source is known as Electrical Vehicle.The electrical motor are of different types according to their advantanges their are chosen.The fuel source is battery which is a DC supply. There are two types of power supplies they are AC and DC. According to the type of motor we are choosing the supply must be given to it. If we us AC motor as a engine we need a converter because the power source is of DC type,the converter converts the DC to AC. If we are using DC motor there is no need of any conversion .
The electrical vehicles are clsified in to different type
Battery Electrical Vehicle(BEV): Battery Electric Vehicles, also called BEVs and more frequently called EVs, are fully electric vehicles with rechargeable batteries and no gasoline engine. All energy to run the vehicle comes from the battery pack which is recharged from the grid. BEVs are zero emissions vehicles, as they do not generate any harmful tailpipe emissions or air pollution hazards caused by traditional gasoline-powered vehicles.
Plug-in Hybrid Electrical Vehicle (PHEV): Plug-in Hybrid Electric Vehicles, or PHEVs, have both an engine and electric motor to drive the car. Like regular hybrids, they can recharge their battery through regenerative braking. They differ from regular hybrids by having a much larger battery, and being able to plug into the grid to recharge. While regular hybrids can (at low speed) travel 1-2 miles before the gasoline engine turns on, PHEVs can go anywhere from 10-40 miles before their gas engines provide assistance. Once the all-electric range is depleted, PHEVs act as regular hybrids, and can travel several hundred miles on a tank of gasoline. All PHEVs can charge with charger, but most PHEVs are not capable of supporting fast charging.
Hybrid Electrical Vehicle(HEV): Hybrid Electric Vehicles, or HEVs, have both a gas-powered engine and an electric motor to drive the car. All energy for the battery is gained through regenerative braking, which recoups otherwise lost energy in braking to assist the gasoline engine during acceleration. In a traditional internal combustion engine vehicle, this braking energy is normally lost as heat in the brake pads and rotors. Regular hybrids cannot plug into the grid to recharge.
Here we are intrested in designing the Electrical Vehicle. Below blow diagram will show the power flow and how they are working and communicating.
Block Diagram:
We need to understand the flow of power before designing the EV.
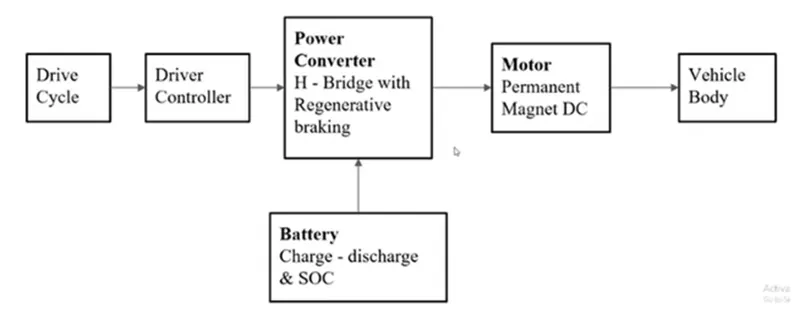
The main components used in modelling EV are:
1. Drive cycle:
- It is the series of data points that represent the speed of a vehicle versus time.
- They are produced by different countries and organizations to assess the performance of vehicles in various ways, such as for instance fuel consumption, and polluting emissions.
2. Driver controller:
- This unit manages the flow of electrical energy delivered by the traction battery, controlling the speed of the electric traction motor and the torque it produces.
3. Power converter:
- It is used to process and control the flow of electric energy by supplying voltages and currents in a form that is optimally suited for the user loads.
4. Electric motor:
- Using power from the traction battery pack, this motor drives the vehicle's wheels.
- Some vehicles use motor generators that perform both the drive and regeneration functions.
5. Vehicle body:
- It accounts for body mass, aerodynamic drag, road incline, and weight distribution between axles due to acceleration and road profile.
- Optionally include pitch and suspension dynamics.
- The vehicle does not move vertically relative to the ground.
6. Battery:
- It stores electricity for use by the electric traction motor.
- In an electric drive vehicle, the auxiliary battery provides electricity to power vehicle accessories.
SIMULINK MODEL -
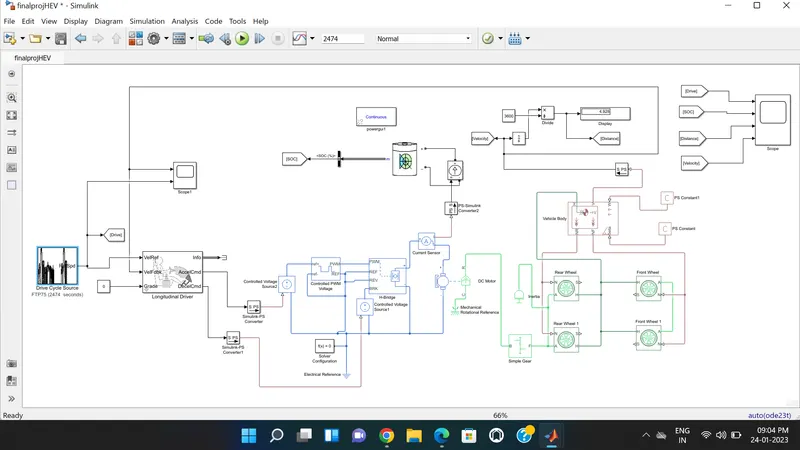
The electric vehicle is constructed in a manner of four step-by-step processes,so to design of the EV model always starts within the order:
1)Construction of Vehicle Body Design
2)Selecting the motor
3)Suitable control unit for motor
4)Source of energy for motors
1) Construction of Vehicle Body Design -
Represents a two-axle vehicle body in motion. Accounts for body mass, and aerodynamic drag. grade, externally defined mass and centre of gravity of the vehicle body.
Input Ports:
W=Wind Velocity in m/s
beta=Grade angle in radians
Output Ports:
V=Velocity in m/s
NR=Normal force on Rear Axle (N)
NF=Normal Force on Front Axle (N)
Vehicle Body -
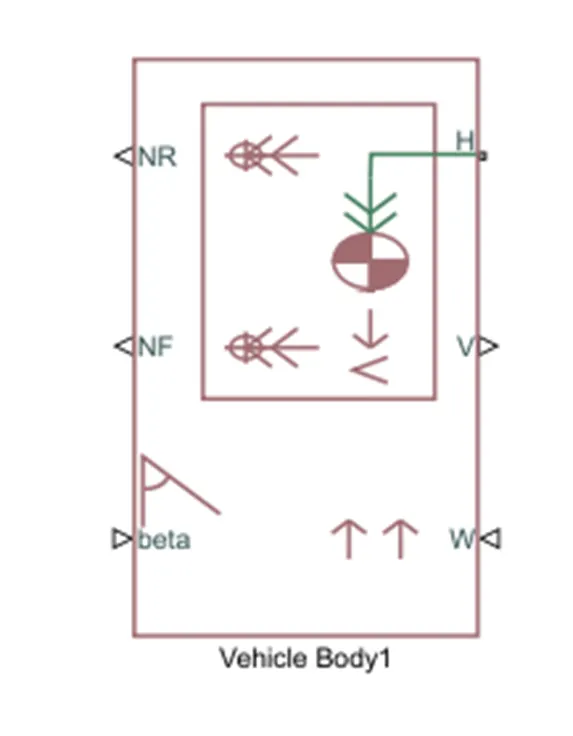
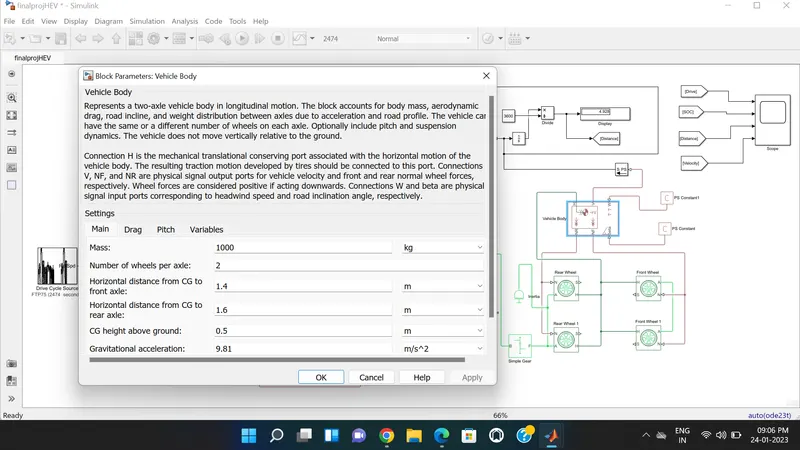
- This block basically represents a two-axle vehicle body in longitudinal motion. The block accounts for - body mass, aerodynamic drag, road incline, weight distribution between axles due to acceleration road profile.
- Here, connection H is the mechanical translational conserving port hub.
- NF & NR correspond to the output ports for normal reaction forces on the front axle and rear axle wheels respectively.
- Connection V represents the actual output translational velocity of the vehicle.
- beta is the road inclination angle & W corresponds to the headwind speed (headwind direction opposite to that of the vehicle).
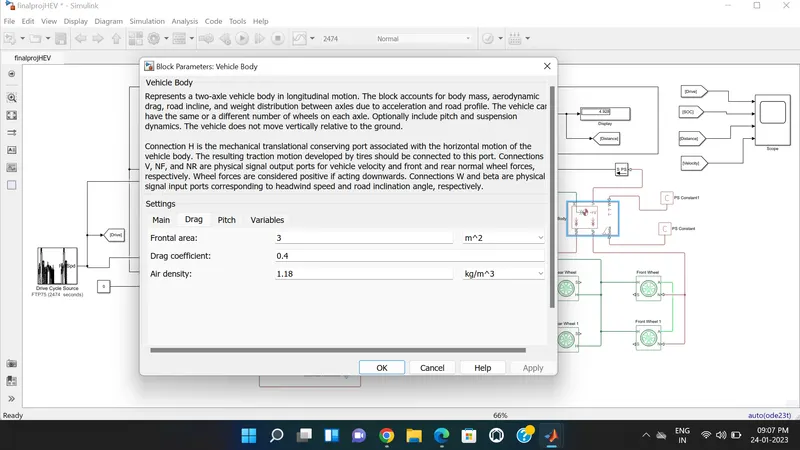
- The gross weight considered as 1000 kg and all other parameters are kept as default as shown below.
Tire -
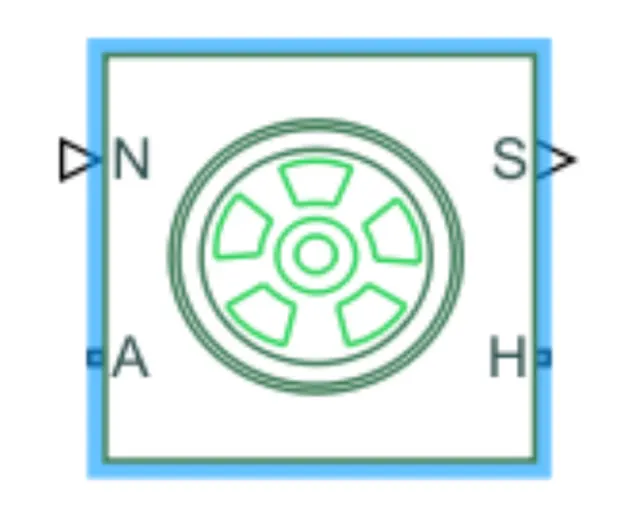
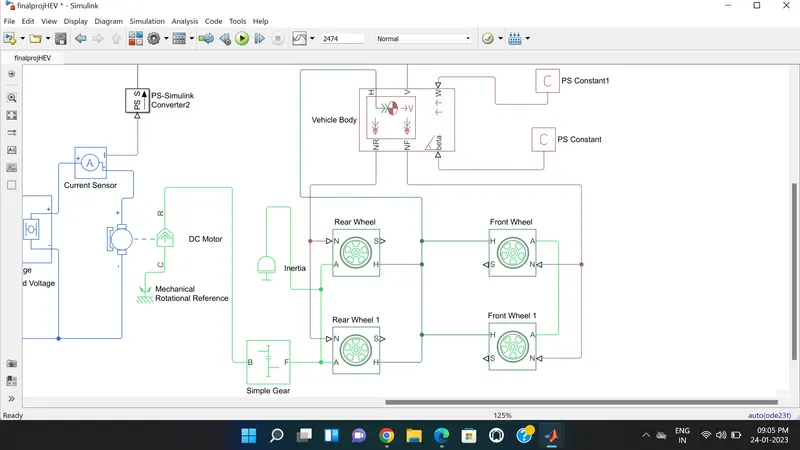
- The vehicle is assumed to be front axle is driven (4 wheels- 2 on each axle).
- The wheels are modeled using simple Tire (Magic formula) Simulink blocks.
- The block can model tire dynamics under constant or variable contact surface conditions.
- Input Port:
N=Normal force acting on the tire, positive when force is acting downwards/towards the contact surface.
- Output Port:
S=Slip value is relative to tire and surface of contact.
- Conserving Ports:
H=represents wheel hub which transmits thrust generated by the wheel to the body of the vehicle.
A=represents the axle on which the tires are mounted.
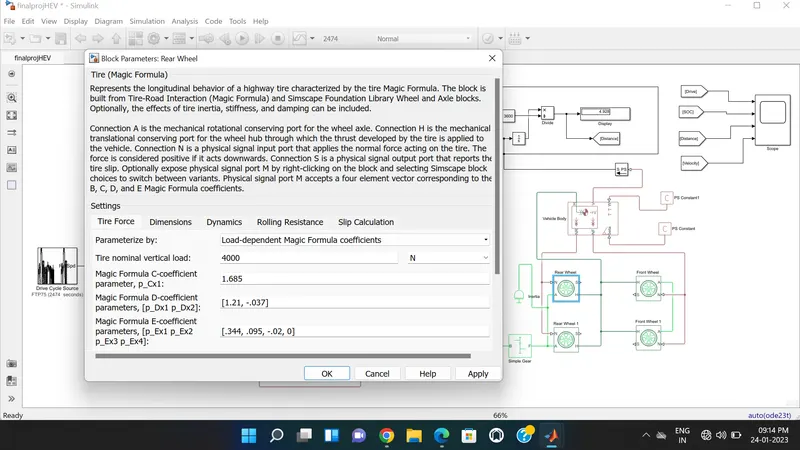
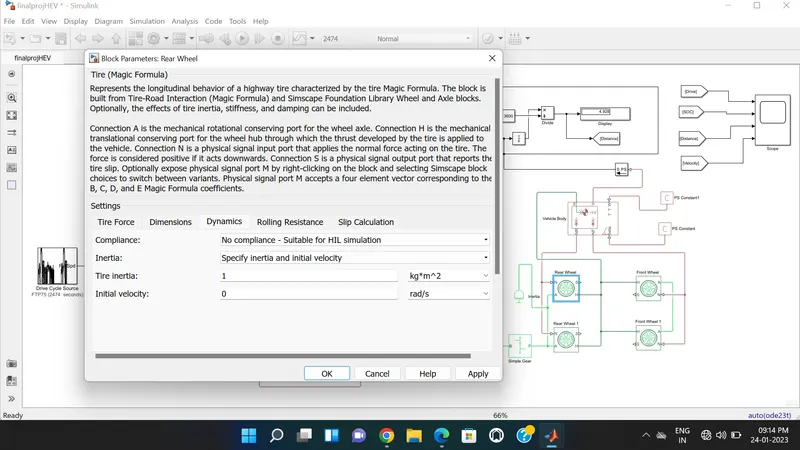
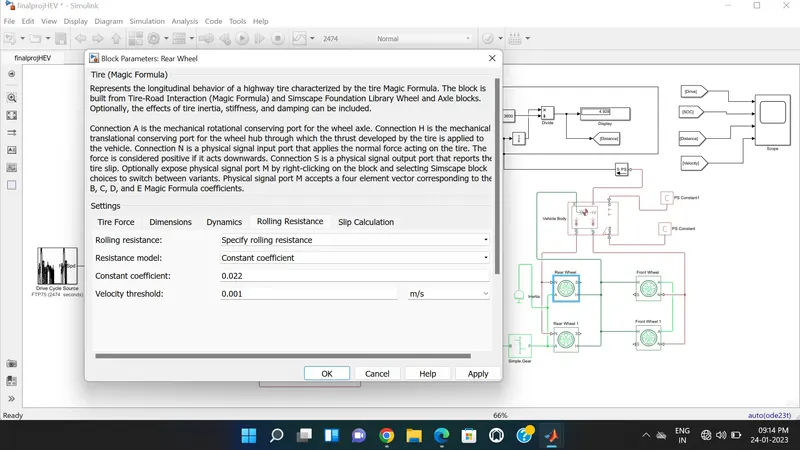
Here we are considering Tire force parameterize by Load-dependent magic formula coefficient, inertia is specify as 1 kg*m^2 and constant coefficient of rolling resistance is 0.022. Other parameters are kept as their default value.
Gear:
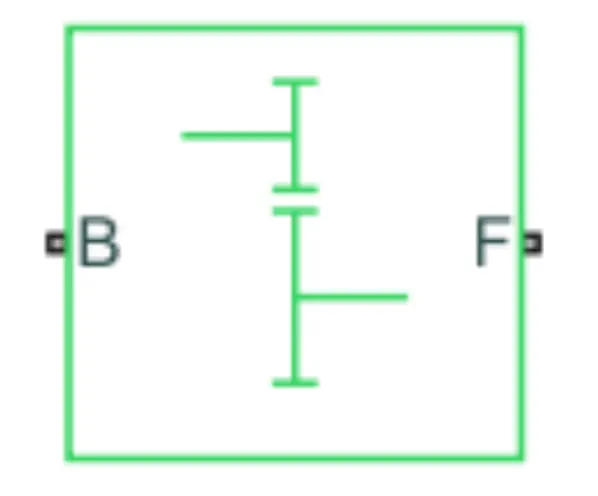
- A simple gear block is used to connect the motor to the rear axle of the vehicle.
- It represents the gearbox that connects the input shaft to the base gear and output from the follower gear.
- Conserving Ports:
B=port associated with an input shaft (motor shaft)
F=port associated with the output shaft (axle/ differential)
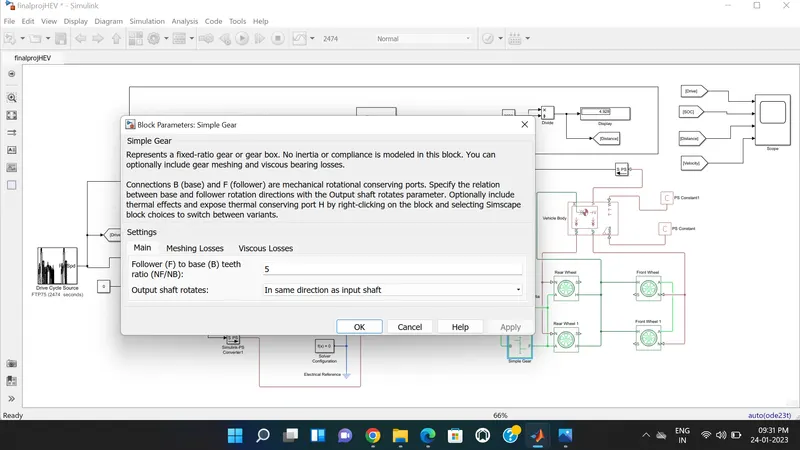
- Gear ratio and output direction are modified. Meshing loss is kept constant and gear is having a constant efficiency throughout the simulation.
- Viscous losses are kept at default conditions.The NF/NB ratio is considered as 5 which is shown in below block parameters.
2)Selecting the Motor and Power Control -
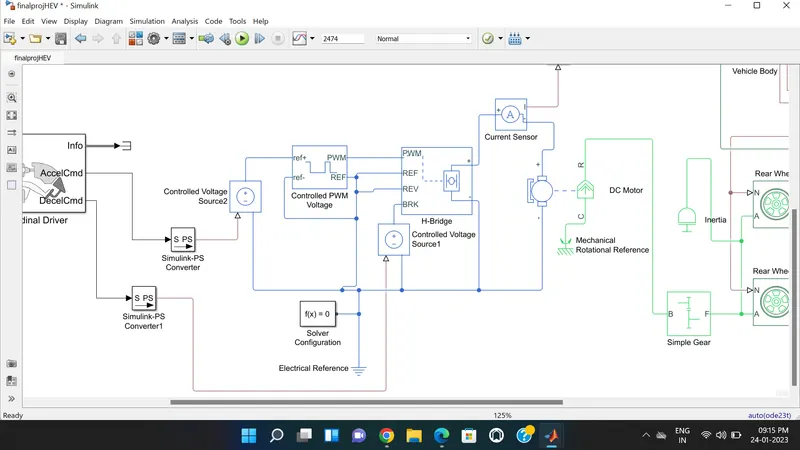
D.C Motor:
This is the DC Motor that would give rotational power to the wheels and become the sole power generation source.
The DC Motors terminals are connected as mentioned below.
"+" =Electrical signal to the motor Positive Terminal
'-" =Electrical signal to the motor Negative Terminal
R=Casing of the Motor connected with the Mechanical Rotational Reference Block
C=Rotor Case connected to the Mechanical Rotational reference
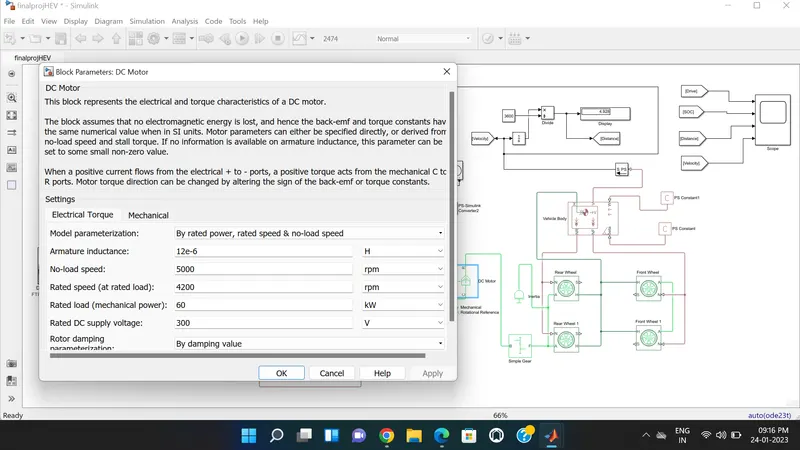
The parameter considered is, The Armature inductance is as default, varied the changes in the No-Load Speed 5000 rpm, the rated speed 4200 rpm, the Rated Load at 60kW, and the Rated DC Supply Voltage 300 V. All other parameters are as default.
Also the Solver configuration is used in the model which is placed in the power control unit for the mathematical values in the model solver settings at the simulation time.
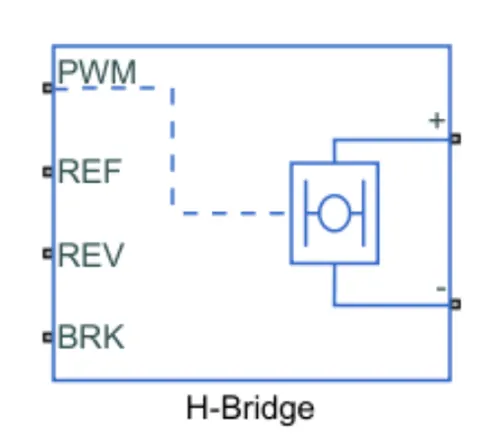
H Bridge:
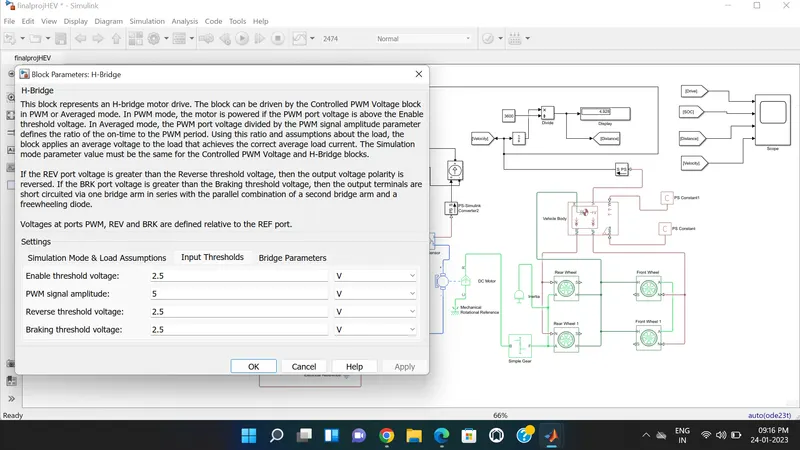
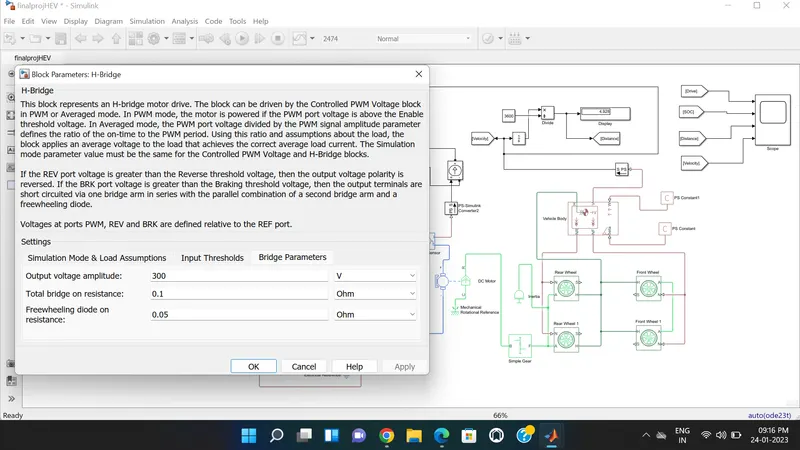
The H-Bridge helps in controlling the power that is input according to the requirement. The output provided is converted voltage as per the controlled parameters.
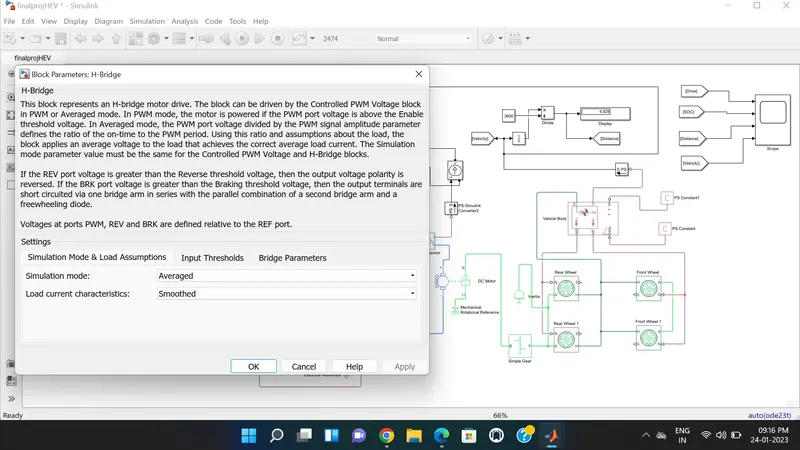
Here we are considering simulation mode as Averaged and Load current characteristics are Smoothed. Output voltage amplitude is considered as 300V and keeping all other parameters as their default value.
Controlled PWM Voltage:
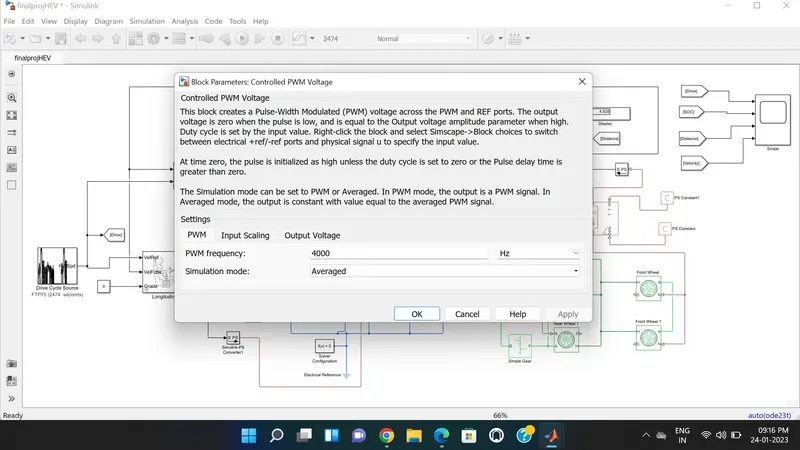
The Controlled PWM Voltage Block helps in keeping the Modulated Pulses as per the required pulses. So that the operations happen smoothly and higher variations are not observed.
The Ports are connected as follows.
PWM=PWM connected directly to the H-Block
REF=REF connected directly to the H-Block
ref+ = Reference Positive connected with Driver Model ith the Acceleration Commands from the
ref- =Reference Negative connected with the Deceleration Commands from the Driver Model
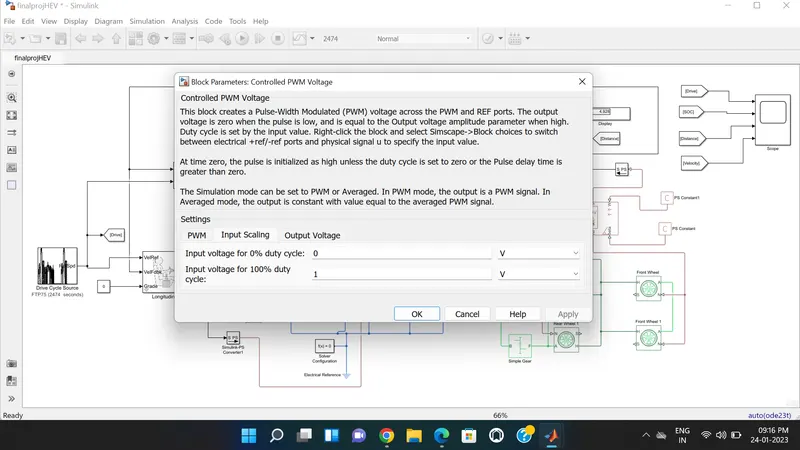
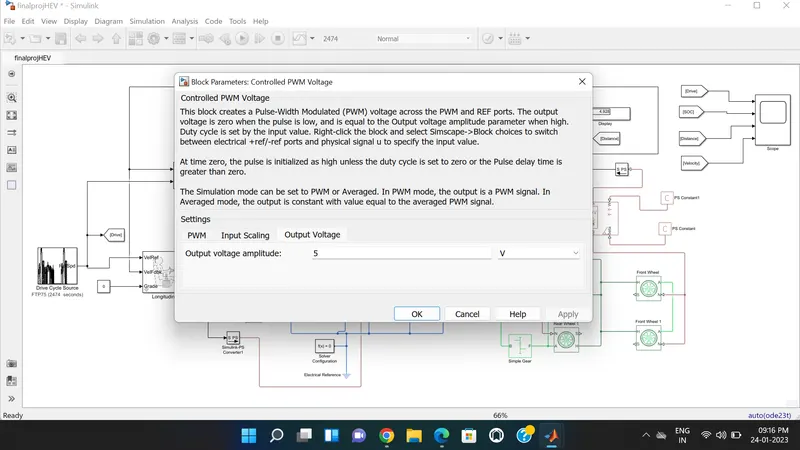
Here we are considering PWM frequency as 4000 Hz , simulation mode is Averaged and Output voltage Amplitude as 5V. Other parameters are set as default which is shown in below block parameters.
3)Battery and SOC System -
Battery:
Implements a generic battery model for most popular battery types. Temperature and ageing (due to cycling) effects can be specified for Lithium-Ion battery type.
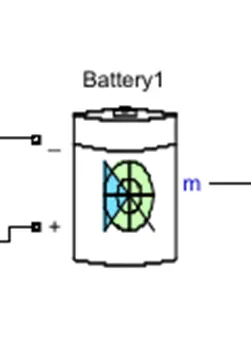
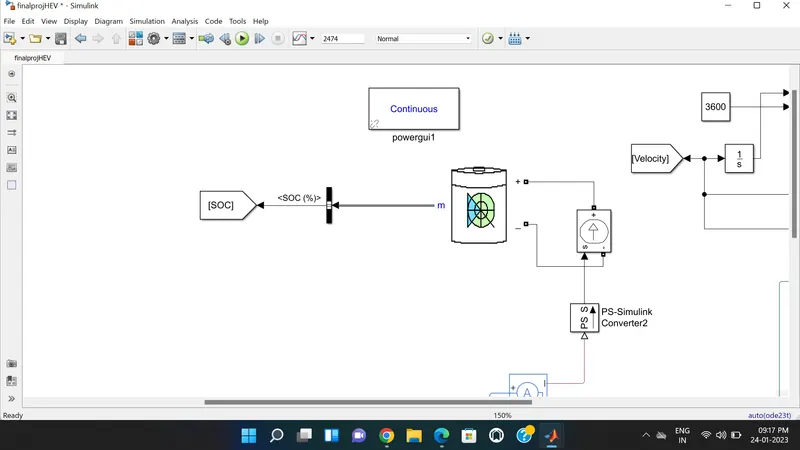
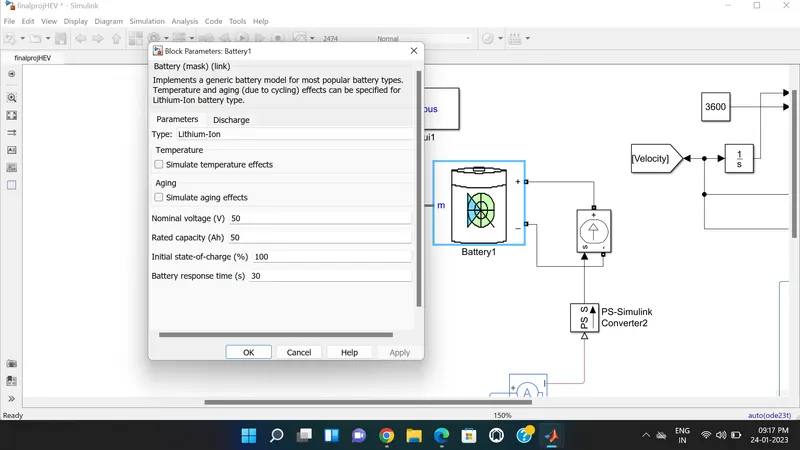
Below picture shows the battery and SOC system.Here we are considering the Battery type as Lithium-Ion and its Nominal voltage is 50V and Rated capacity (Ah) is 50.
Powergui is used with simulation of power systems and power electronics.It is used for the analysis and measurement of parameters like voltage, current, active power, reactive power. Powergui solver is selected as continuous.
4)Source of energy for motors
Longitudinal Driver:
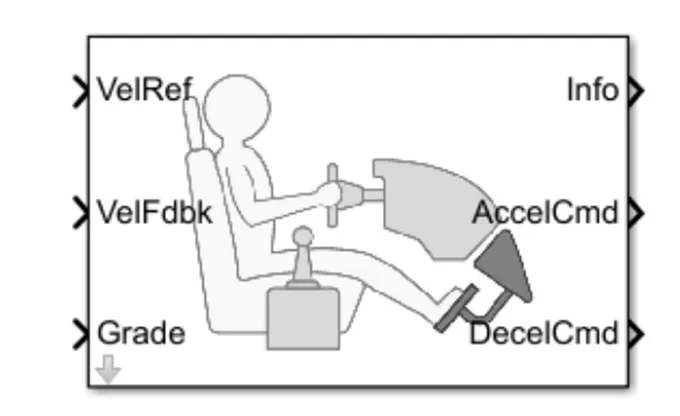
- The longitudinal Driver is an inbuilt block provided by the powertrain blocks.
- It is a parametric longitudinal speed tracking controller for generating normalized Acceleration and Braking commands based on reference and feedback velocities,
- The VelFdbk port corresponds to the feedback velocity. The actual velocity output given by the vehicle body is connected here. By comparing the actual (feedback) velocity with the reference velocity, the driver block generates acceleration and braking signals in order to minimise the error between the two concerned velocities.
- Grade corresponds to the grade angle. For this simulation, no inclination is considered and hence, a constant block with value 0 is connected.
- Info gives the output for the bus signal for different block calculations like the difference in reference vehicle speed and vehicle speed, etc.
- AccelCmd & DecelCmd correspond to the acceleration and deceleration commands generated respectively.
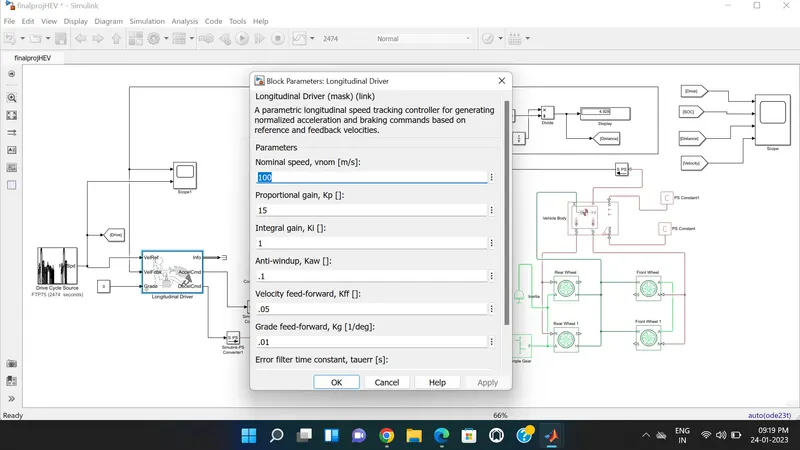
Here we are considering the Nominal Speed of Longitudinal driver as 100m/s and keeping all other parameters as their default values.
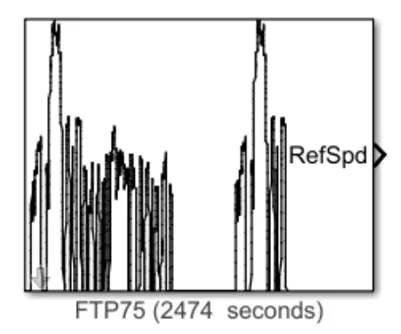
Reference Velocity (Drive Cycle):
- The Drive Cycle Source block is used to provide the reference speed for the simulation.
- It generates a standard or user-specified longitudinal drive cycle.
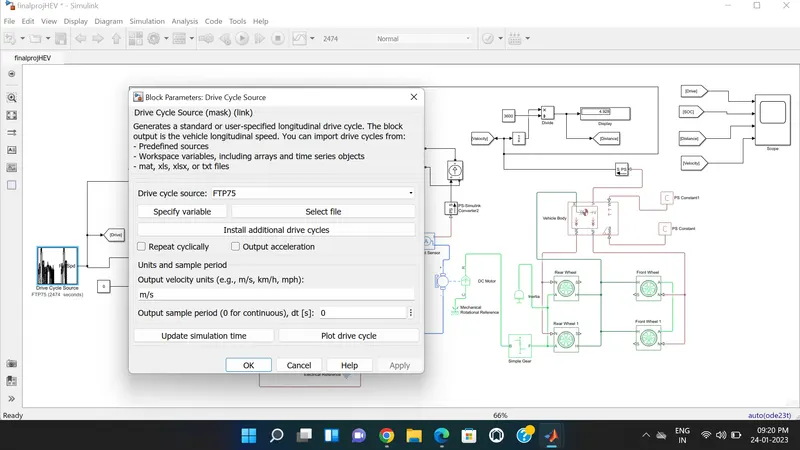
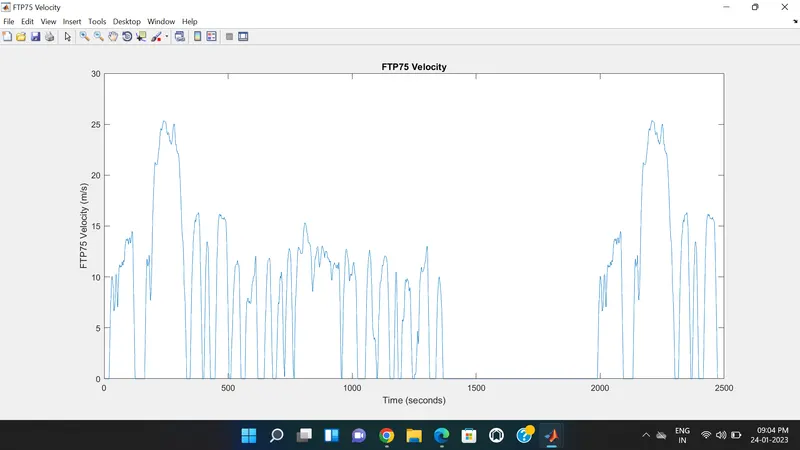
In this selected driving cycle is FTP75 shown in the below block parameters.The Simulation time is considered as 2474sec same as that of FTP75 drive cycle.
Plot of the FTP75 drive cycle is shown below,
RESULTS -
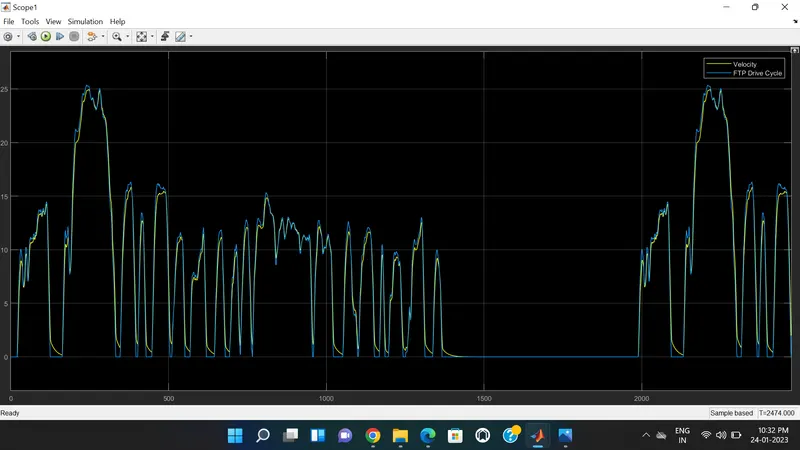
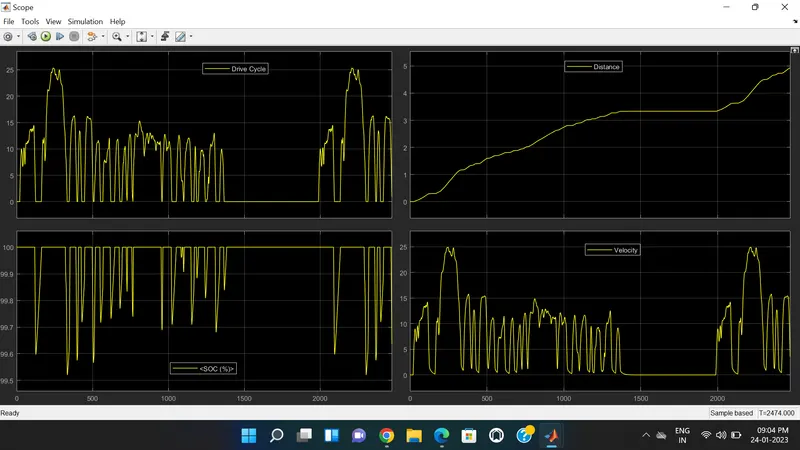
Above results shows the plot of FTP75 drive cycle, Distance , Velocity and SOC(%).The blue line is a graph of the drive cycle source and the yellow line shows the corresponding velocity graph.From the above waveform,the actual velocity of the vehicle is matches with the reference drive cycle velocity. This is because the chosen battery capacity and motors are able to propel the speed up to the required extent. If the battery is higher capacity is chosen,the actual velocity will tend to match with reference voltage.
The state of charge (SOC) is a measurement of the amount of energy available in a battery at a specific point in time expressed as a percentage. During acceleration battery losses energy and during deceleration it stores energy. These changes can be observed in SOC of the battery. Also as the Vehicle moves with their respective drive cycle the distance covered by the vehicle gets increases as shown in the above plot.
CONCLUSION -
The Electric Car model has been created with all necessary components using the SIMULINK and the model is simulated with all the proper procedure. This EV model covers the distance of 4.928 km with the battery capacity of about 50 Ah. We understand that by changing the values of the battery model and vehicle body values like weight etc we will get different Soc percentage and distance travelled.