Final Project: Design of an Electric Vehicle
Why Electric Vehicle?
Electric Vehicle (EVs) is the future of the automobile industry. This requires a highly accurate and efficient model that would run on clean and green energy. For now, the energy we use to recharge EVs mainly comes from non-renewable sources, but this would also shift to renewable sources. If everyone's homes were generating solar power, there wouldn't need to be a shortage of charging stations on the highways and roads. An EV needs to be as simple to charge as a vehicle with an internal combustion engine to fill up with gas. The price of EVs is another factor. EVs still represent approximately 2 to 3 percent of the global market and are a relatively new technology. The EV is the low or no effluent producing vehicle that should be designed such that it can be a competition for the current ICE vehicles. Design and simulation are the first steps toward a revolution in any industry. EVs have various benefits over conventional vehicles in addition to being cleaner and not using as much fossil fuel. One is that EVs are more cost-effective, offering greater MPGe (miles per gallon gasoline equivalent), which means that charging an EV will cost less than refueling a conventional vehicle. This is because an electric vehicle (EV) can drive a greater distance using less energy the more efficient it is. Tesla owners in the US can permanently charge their electric vehicles for free at their own personal charging stations, which results in huge fuel savings. Regenerative braking improves EV efficiency by purposely reusing the energy lost during braking. Another advantage is that EVs require less maintenance than IC-powered vehicles since they have fewer rotating or moving parts, such as less frequent oil and transmission fluid changes. Long-term savings from this would be greater than those from conventional automobiles. Because there is less friction between the moving elements when there are fewer of them, the system operates more quietly.
Power source for EV
When it comes to the storage unit of the EV i.e. battery. The conventional, heavy, and toxic Lead acid battery is replaced by lightweight and safer Lithium-ion batteries. This can be used as a power source that is light in weight and less toxic relatively. To meet the power needs and range requirements, batteries installed in an EV's body must be able to achieve high energy densities. As a component of the electric motor, generators are devices that produce electrical energy from mechanical effort input. They work when the vehicle is braking to cause the phenomena known as "regenerative braking". Collector systems, which allow EVs to be charged at private residences or public charging stations, are off-vehicle systems. Solar panels are utilized to generate electricity for charging in these systems, which may then be used by the grid or by EV owners' residences for more convenient EV charging.
The Motor
The brushless DC motor (BLDC) or the induction motor determines the power and performance of electric cars. Induction motors and DC brushless motors are used to replace direct current (DC) power sources. Also mentioned earlier for EVs, lithium-ion batteries also take the place of lead-acid batteries. Because the needs and applications of both components—brushless DC motors and induction—determine their future.\
Controllers, Conversion and mechanism
The electric power required to run the EV's many systems and requirements is stored in batteries. Power converters transform the battery's energy into a form that the motor can use. This conversion may be made from DC to AC or vice versa, or it may be made between two different DC to DC or AC to AC magnitudes. Motor controllers are electrical devices that use control signals to regulate the amount of power provided to the motor so that it operates as instructed. The motor is used to propel the vehicle forward or backward while it is moving. The generator is a component of the motor and just operates in the opposite way. The car can produce electricity while braking and send it back to the battery to charge it (regenerative braking). The vehicle's ability to alter speeds as it accelerates and decelerates depends on the transmission system. Road traction depends on the wheels, which can be either FWD or RWD depending on the powerplant (forward or rear wheel drive). Only the front axle wheels of a vehicle produce propulsion (i.e., rotate as a result of engine effect), whereas the back axle wheels of a vehicle provide propulsion when it is an RWD. There are also all-wheel drives (AWDs), in which the wheels on the front and back axles cooperate to provide propulsion.
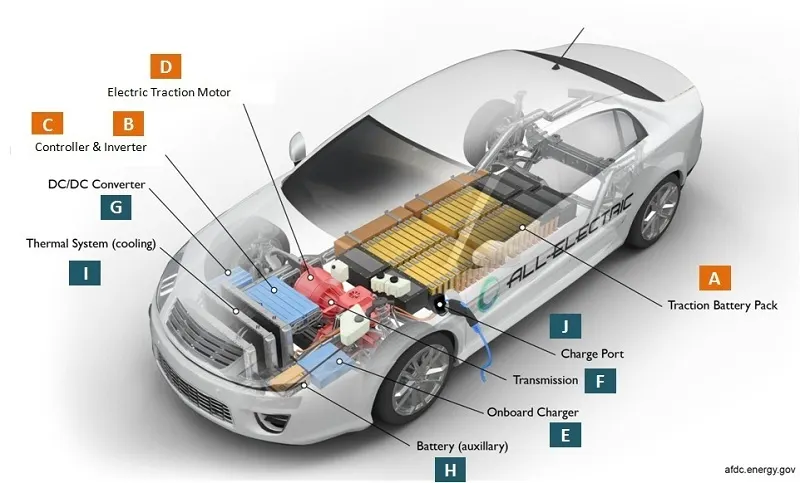
1) System Level Configuration:
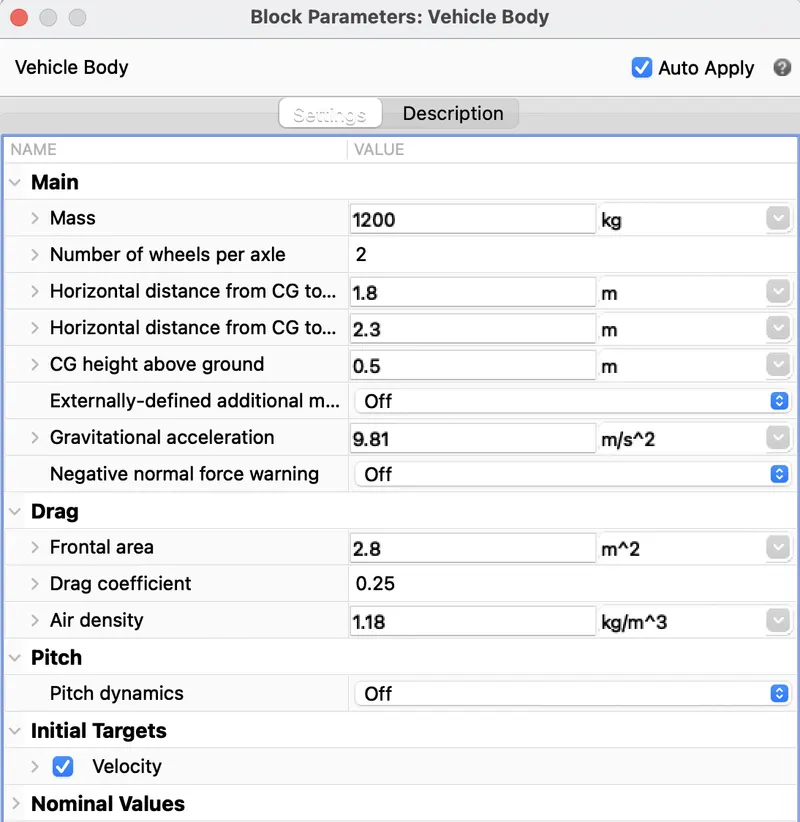
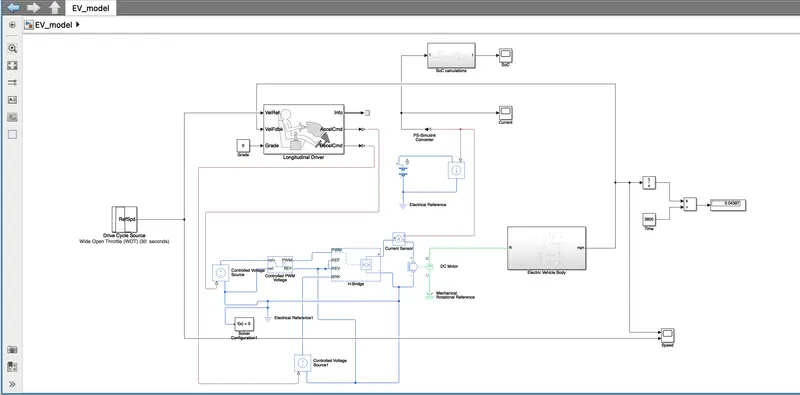
The Model of an EV is simulated on Simulink using Power Train Blockset and other required blocks for an EV, such as DC motor, battery, Vehicle body, Tires, Longitudinal driver, etc.
Firstly, I have simulated the EV model using the following components and their specifictions:
DC Motor:
In this, I decided to utilize a DC motor block as the motor for the electric vehicle model. This is due to the fact that DC motors are simpler to model and require fewer modifications depending on the application. The DC motor block as shown below:
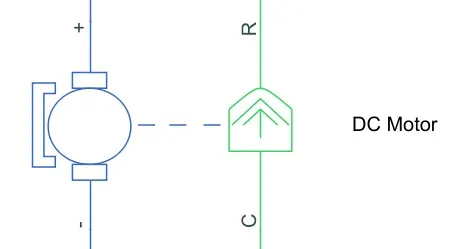
The block has two sides, the mechanical side on the right and the electrical side on the left, as we can see. There are 2 ports on the mechanical side: C and R. The C stands for the casing, while the R stands for the rotor's spin, which generates torque. For applying voltages, the electrical side has a positive and a negative terminal. A positive torque will occur from the C port to the R port if a positive voltage is applied to the DC motor block from the positive to the negative terminal. By altering the sign of the back emf or the torque constant, the direction of the torque generated by the DC motor can be adjusted. Because it will be stationary, the C port of the mechanical side needs to be attached to a mechanical rotational reference as shown below.

The open connection of the basic gear from the vehicle body block will be connected to the R port. The positive terminal of a power converter, which in my case will be an "H bridge," is connected to the positive terminal on the electrical side.
Power Converter:
The power converter is required to transfer power from one component to another in the proper form and amount. In the case of electric vehicles (EVs), a power converter is required to supply the DC voltage from the battery of the EV to the DC motor in order for it to function properly under the necessary conditions. I used an H-Bridge motor drive as my power converter, as was previously indicated. The H-bridge block is shown below,
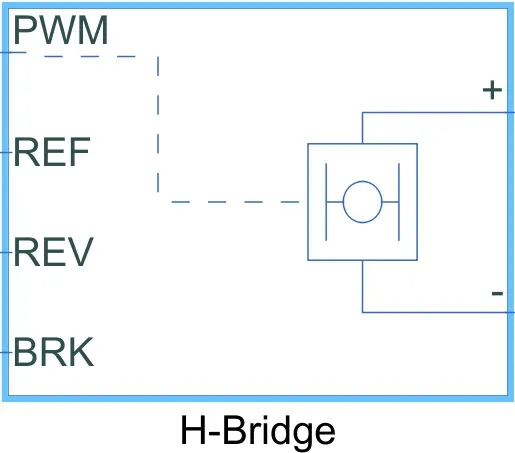
The left side of the H Bridge is used to control voltage signals, while the right side has terminals that supply the controlled voltage to the DC motor. The H-Bridge block's left side ports are as follows:
- PWM: The post is used for Pulse Width Modulation of the Voltage to the H-bridge.
- REF: REF stands for Reference.
- REV: REV stands for Reverse and controls the voltage for the reverse action of the vehicle.
- BRK: BRk stands for Braking and hence controls the voltage for braking of the vehicle.
Controlled PWM Voltage:
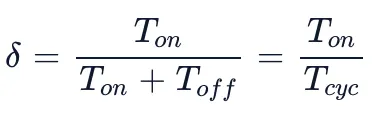
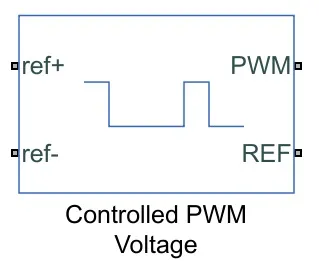
In order to supply a regulated pulse width modulated voltage to the H-Bridge block, I have next employed a "Controlled PWM Voltage" block. PWM and REF ports on the block, which feed into the identical ports on the H-Bridge block, will be used to output the PWM voltage. In the case of a low pulse, the output voltage is set to 0V, while in the case of a high pulse, the output voltage will be equal to the output voltage amplitude, which was set to 320V in the H-Bridge block. The duty cycle, which is the ratio of the time the switch is ON to the time it takes to complete one cycle, determines the voltage pulses that are produced by this block (which is the time for which the switch is ON and OFF). The regulated PWM voltage block's input determines the duty cycle.
the formula for the duty cycle is as follows:
where
δ is Duty cycle
Ton is ON time
Toff is OFF time
Tcyc is Time taken for 1 Cycle
The Controlled PWM voltage block is shown below,
Controlled Voltage Source:
Because they need a controlled voltage source to supply the voltages to make the voltage pulses that must be sent into the H-Bridge, the input ports of the controlled PWM voltage block are still unconnected. I have the regulated voltage source block for this. This block is advantageous because it will supply the required voltage, which is strong enough to keep the output voltage constant regardless of the current flowing through it. The controlled voltage block is as shown below,
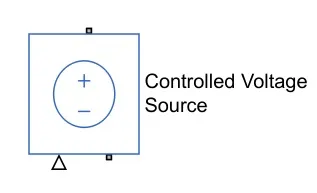
This model has 2 controlled voltage sources. One block is to provide the voltage for the acceleration of the vehicle and the other is to provide the voltage for the deceleration of the vehicle.
Electrical Reference:
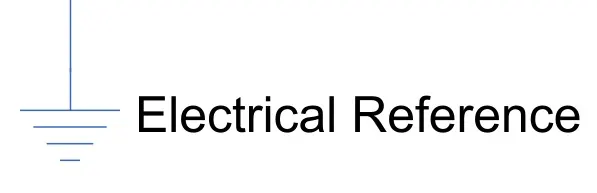
A grounding effect is produced for electrical circuits using the electrical reference block. There must be at least one electrical reference block in each model that has electrical or electronic components. Below is a diagram of the electrical reference block:
Solver Configuration
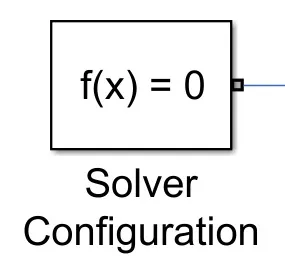
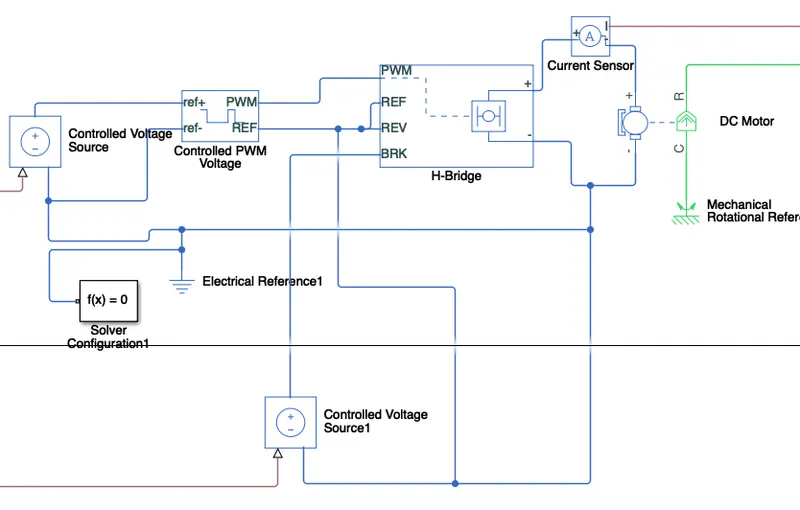
The solver configuration block is used to solve any necessary equations in a model and in my case, I have used them in the connection to the 'REV' port of the H-Bridge block. The solver configuration block is shown below:
Below shown is the sub-section of the model in which these above-defined components are used:
Vehicle Body:
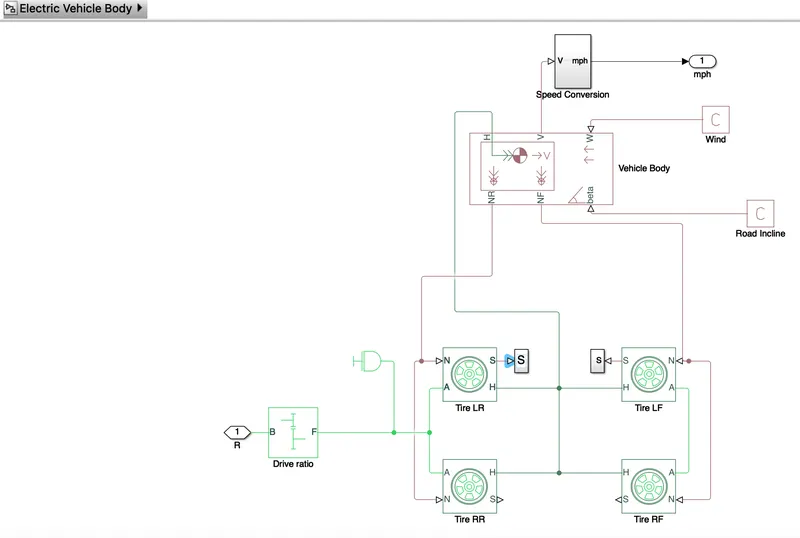
The vehicle body is 6 port blocks,
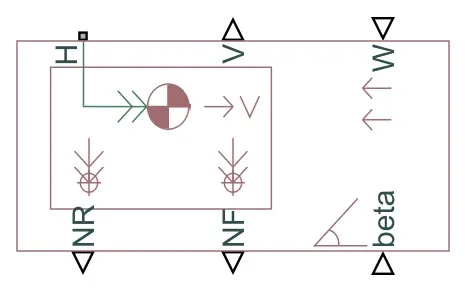
Each port has a specific role in the functioning of this block
- H: Is named 'H' as it acts as Hub for the wheels to connect it with the main vehicle body
- V: This physical signal output port, which stands for "Velocity," is utilized to output the vehicle's speed or velocity.
- W: By providing a speed for it, this physical signal input port enables us to simulate a "headwind" operating on the vehicle.
- NR: This physical signal output port simulates the normal forces acting on the rear wheels.
- NF: This physical signal output port simulates the normal forces acting on the front wheels.
- beta: The vehicle can be modeled on an inclination angle to produce the effect of a hill climbing force thanks to this physical signal input port.
Wind (W) and Slope (beta):
As was already indicated, using the "W" and "beta" ports of the velocity block, we may simulate the impacts of wind resistance and road incline, respectively. In order to simulate the effects of wind and road inclination on the motion of the car, I used a "PS - Constant" block in my model. I have a steady signal of 5 m/s for the wind effect, and this functions as a headwind, which is the opposite of the direction of motion. I have consistently signaled 0 for the road incline.
Tires:
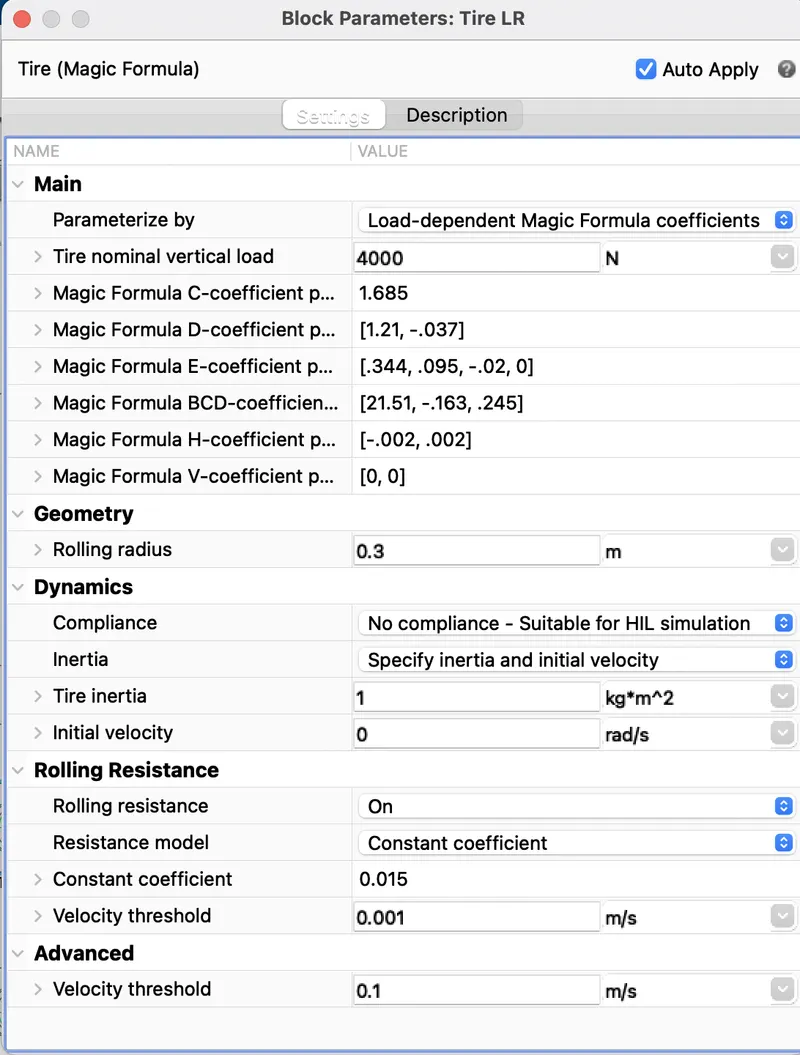
The "magic formula" tires are the ones utilized in this electric vehicle model. There are a variety of tire blocks that may be used to mimic a vehicle, but I've chosen to utilize the ones that use the magic formula since they let us simulate the longitudinal behavior of car tires on highways. Additionally, they enable us to mimic additional effects like tire inertia and stiffness, which improves the accuracy of situations encountered in the actual world.
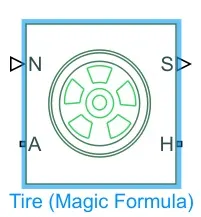
The magic formula tire has 4 ports
- N: The physical signal input port for the normal force acting on the tyre and being regarded as positive in the downward direction is this port, which stands for "Normal."
- A: This port, which stands for "Axle," is the mechanical port that controls the wheel axle's rotation.
- S: This port, which stands for "Slip," is the physical signal output port that relays information about tyre slip.
- H: The mechanical translational conserving port for the wheel hub via which the tire-generated push is applied to the vehicle body is denoted by the letter "Hub."
Shown below is block parameter for Tire block:
Gear:
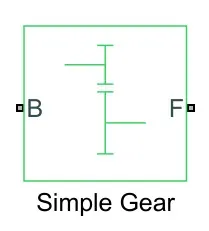
A gearbox known as a "Simple Gear" is a final drive ratio that limits the coupled driveline axes of the base gear and the follower gear.
B: The input of DC motor R is coupled to output B, base gear. A rotating mechanical conserving port is what it is.
F: The rear axle is coupled to the F follower gear's output. A rotating mechanical conserving port is also present.
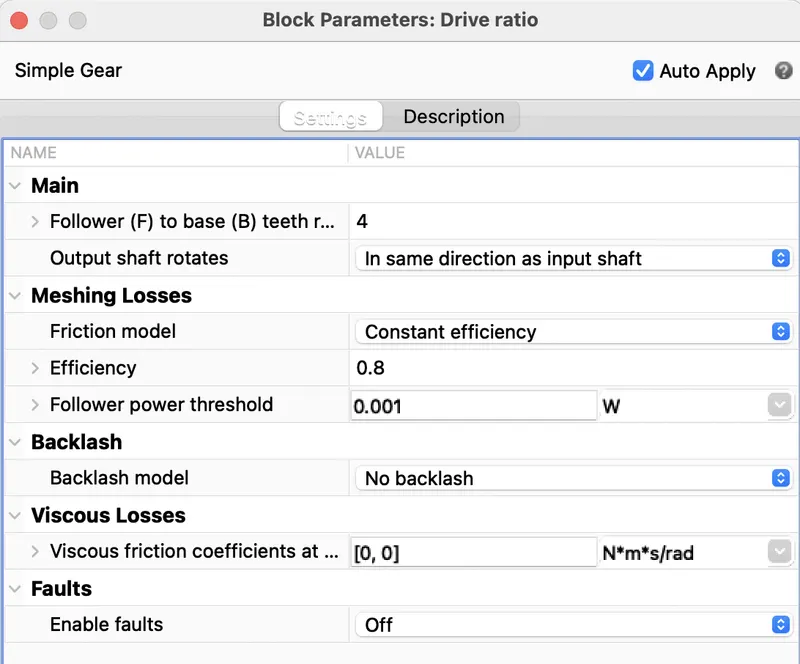
Shown below is block parameter for Drive ratio/Simple Gear Block:
Side Shafts:
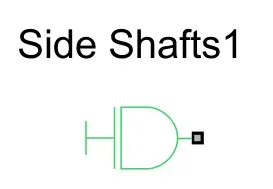
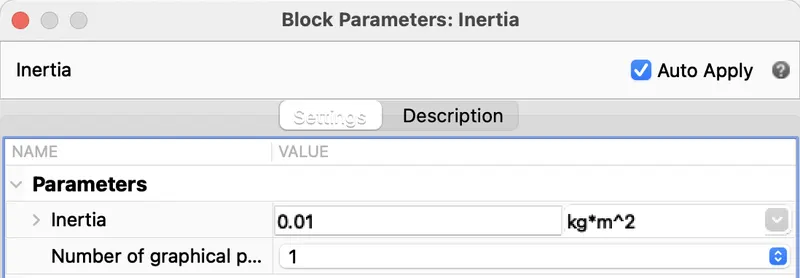
To give the straightforward gear block the ideal mechanical rotational inertia, an inertia block has been added to the workspace. The positive orientation of the block is from the port to the reference point, which in this case would be the basic gear, and this block has just one mechanical rotational conserving port. When inertia is accelerated in a positive direction, the torque produced by it acts in that direction.
Shown below is block parameter for Side shaft:
Velocity Subsystem
The velocity port that outputs the vehicle body block's velocity signal has undergone modification. The vehicle body block outputs a velocity signal by default that is expressed in miles per hour. I created a little subsystem from the velocity port's output to modify these units. The following blocks are utilised by this subsystem:
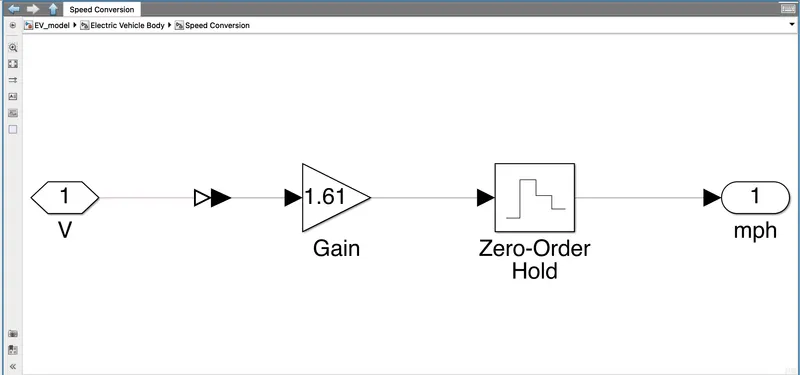
Zero-order hold = 0.01
Gain = 1.61
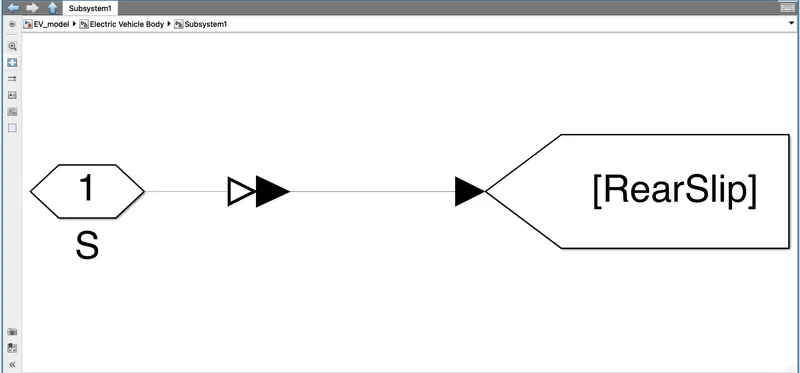
Slip Subsystem:
Vehicle Body Subsystem:
SoC Calculation Subsystem
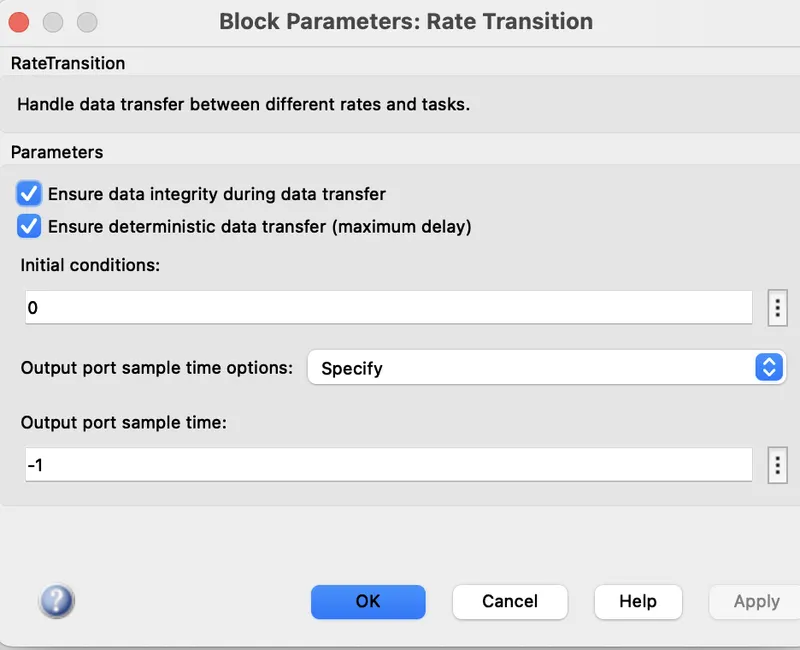
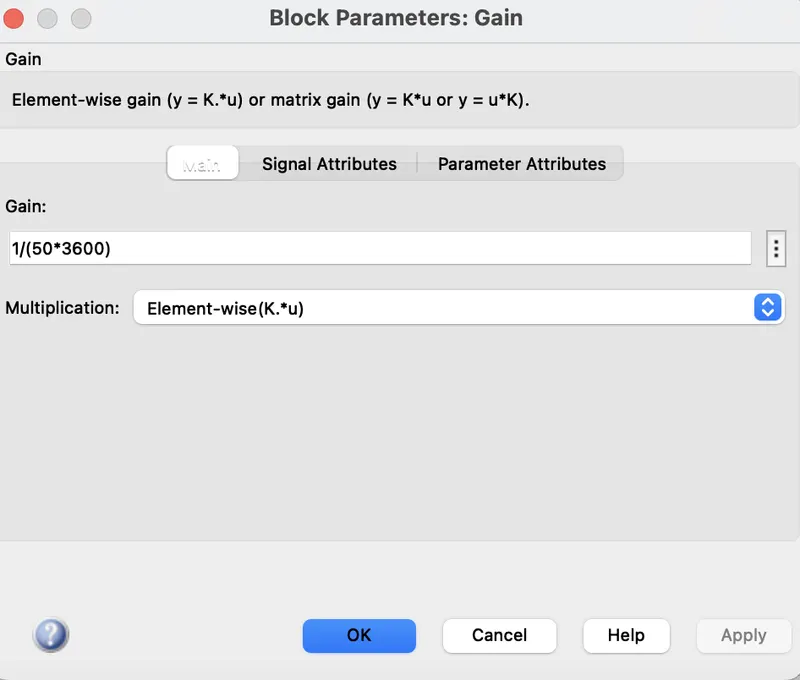
An intricate subsystem made of different building blocks was developed to gauge the battery's state of charge. The 'Rate Transition' block, which is the first block, manages data transfer between various rates and tasks. The signal from the rate transition block is then multiplied or divided using a "Gain" block. In this instance, the gain block will split the current signal by the battery's ampere rating, which has been assumed to be 80Ah times 3600. (seconds in an hour).
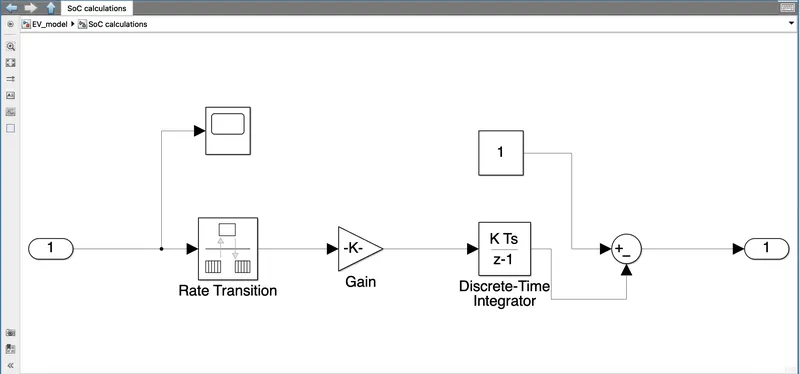
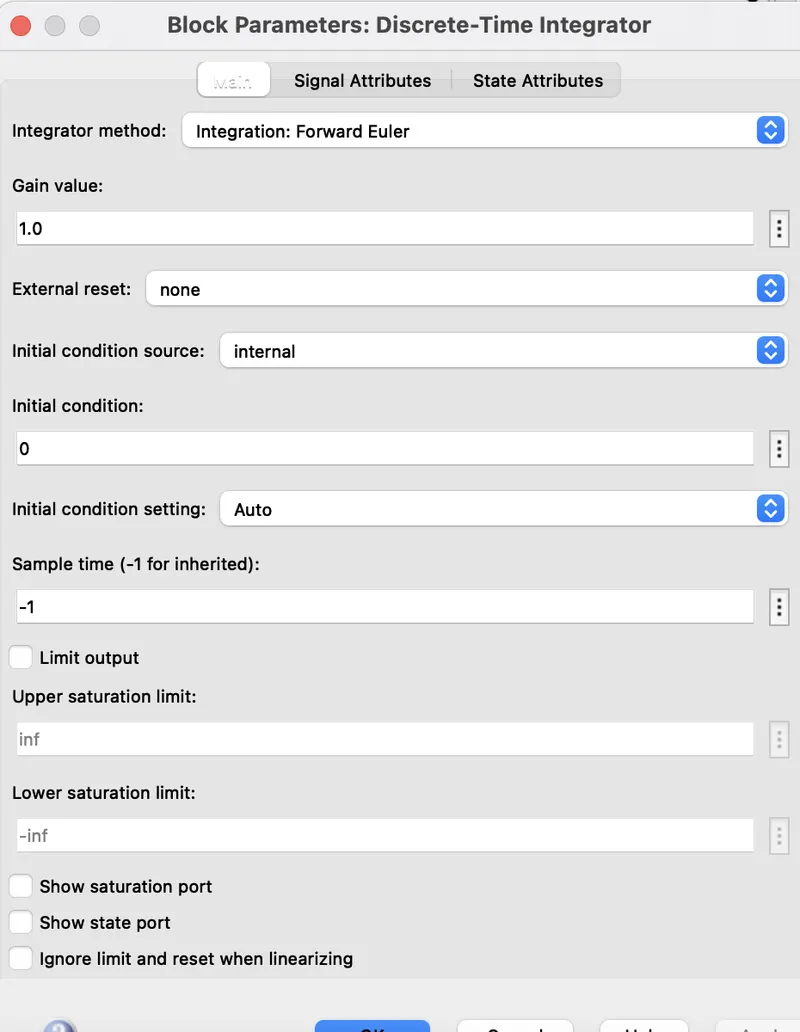
To discretely integrate the current signal with regard to time, a "Discrete - Time Integrator" block is utilised. The battery's initial SOC is represented by a constant block. In order to simulate a situation where the battery is always completely charged, I changed the constant block to have a value of 1, which stands for 100%. After that, operations like addition and subtraction are carried out using a "sum" block. The constant block indicating 100% charge will be deducted from the signal from the "discrete time integrator" block.
Shown below are the block parameters of this subsystem:
Battery
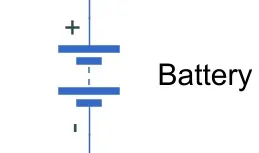
The battery will be the energy store of the EV and will contain the electrical energy in DC form and provide this energy to the DC motor for it to operate. The battery block used is a simple one and considers only the basic parameters. The battery block is shown below:
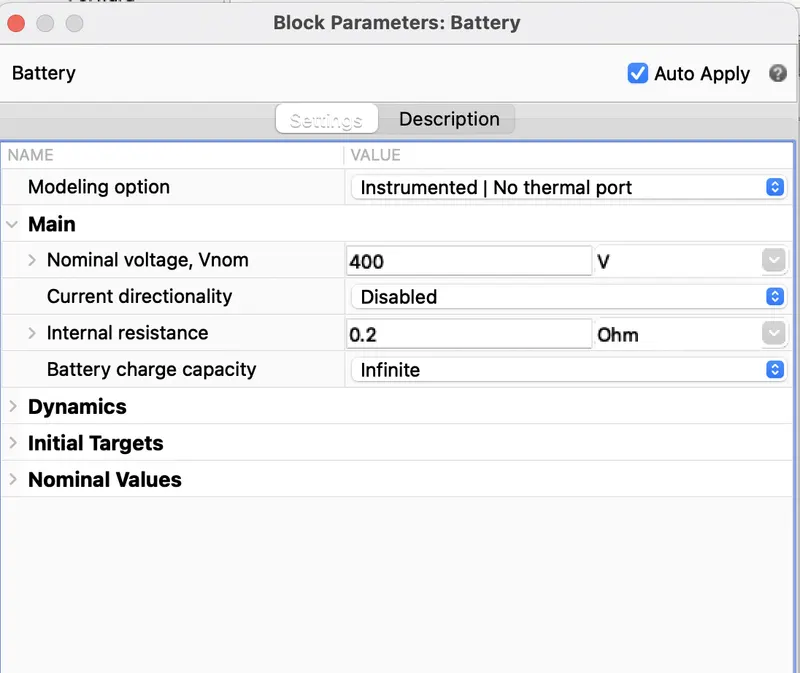
Shown below is Data input for Battery
Controlled Current Source:
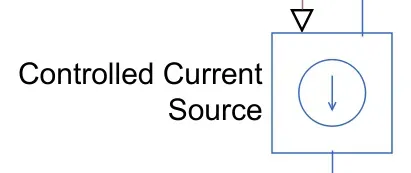
The battery system utilised in the EV model includes the regulated current source block. This block will represent an ideal current source that is strong enough to sustain the desired current regardless of the voltage applied across it, like the controlled voltage source.
Current Sensor:
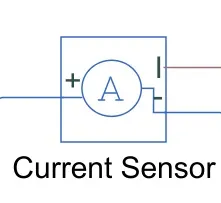
The current sensor block is used to transform the current sensed in an electrical circuit into a physical signal that is proportionate to the current. It represents the ideal current sensor. The battery circuit, a controlled current source, and the DC motor's current are both measured using this block. Below is a diagram of the current sensor block:
Longitudinal Driver:
On the basis of two sets of data, the longitudinal driver block is utilised to send a controller normalised acceleration and deceleration signals. The reference velocity is represented by the first data set, and the feedback velocity by the second. Below is a diagram of the longitudinal driver block:
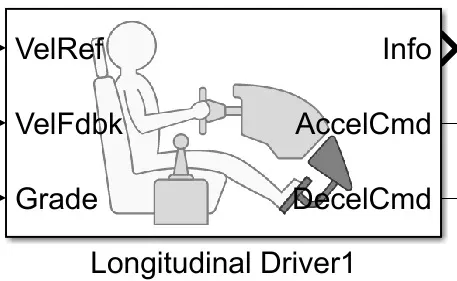
The longitudinal driver block has the following ports:
- VelRef - reference velocity and it is the velocity data provided from a drive cycle source.
- VelFdbk - feedback velocity and it is the velocity data provided from the vehicle body's velocity port that outputs the velocity data.
- Grade - This port provides a grade or inclination angle for the surface on which the vehicle is traveling in degrees.
- Info - This port is for the bus signals which consist of block calculations e.g. acceleration/deceleration command, the difference between reference, and vehicle speed.
- AccelCmd - This port provides the acceleration command to a controlled voltage source.
- DecelCmd - This port provides the deceleration command to another controlled voltage source.
The longitudinal driving block has an easy-to-understand mechanism. The feedback velocity data from the vehicle body block is compared to the reference velocity data from a drive cycle source. The controlled voltage source will receive an acceleration command as an output if the reference velocity is higher than the feedback velocity. The output to another controlled voltage source is changed to a deceleration command if the reference velocity is less than the feedback velocity. for the commands for acceleration and deceleration to be output signals.
Grade:
A constant block with a constant value of 0 is linked to the longitudinal driver block's grade port. This prevents the simulation from modeling any road inclination.
Drive Cycle:
For the purpose of simulating a vehicle's motion, a drive cycle is a set of velocity and time data. The drive cycle will be a plot of the speed versus time that is designed to reflect common driving circumstances that a customer would encounter. They may simulate scenarios like driving on highways, driving in cities, driving at full power, etc. Automobile manufacturers employ drive cycles for a variety of testing techniques, including mileage, pollution, acceleration, and top speed tests. Industry standards for driving cycles include the Urban Dynamometer Driving Schedule (UDDS) and FTP 75.
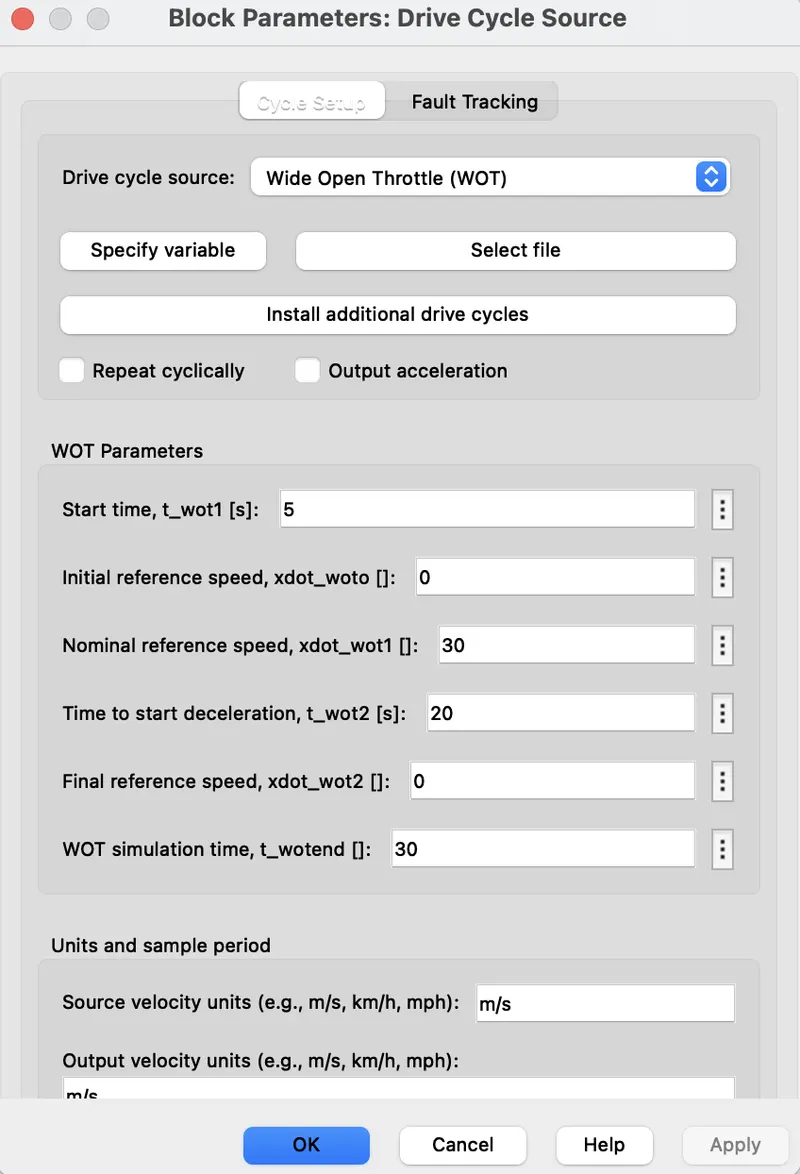
In my EV model, the longitudinal driver block receives acceleration or deceleration commands based on the drive cycle using a drive cycle as the reference velocity data. A driving cycle can be implemented in three different ways. One way is to build your own drive cycle using a spreadsheet with time and velocity data in separate columns. Another approach is to make signals with a signal builder block that indicate the speeds the vehicle should travel at and the durations during which those speeds must be maintained. The final option is to use the built-in, industry-standard drive cycles for the SIMULINK library. In my situation, I used the 'WOT' driving cycle, which is industry standard. This driving cycle, which stands for "Wide Open Throttle," simulates the condition in which the vehicle is forced to accelerate at top speed, held at that speed, and then forced to slow down and return to rest.
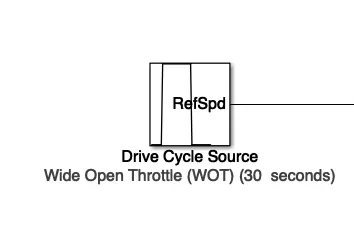
Shown below is data used for drive cycle using WOT:
Screenshot of full EV model in Simulink in shown below:
Results:
The simulation was executed for 30 sec according to the requirements of Wide Open Throttle (WOT) drive cycle.
The following Scope results are shown below:
Speed:
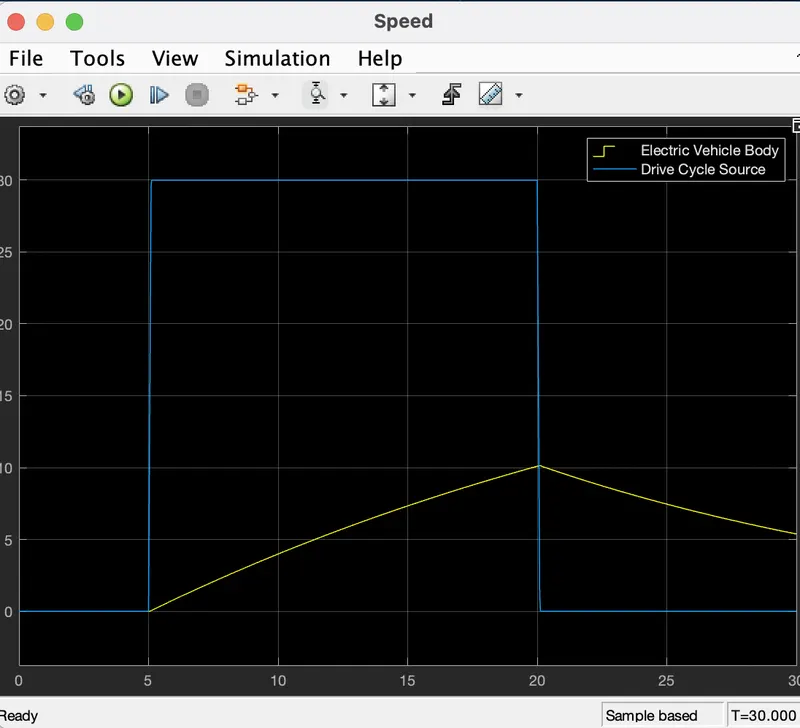
This scope allows us to see two signals. The yellow signal displays the actual speed of the vehicle, while the blue signal reflects the reference signal derived from the drive cycle data. The WOT drive cycle had been altered so that the car started accelerating at t = 5 seconds under the WOT condition (i.e., at full power). This is expected to continue until t = 20 seconds, at which point the car is supposed to start slowing down. The vehicle speed drops to 0 m/s, or rest, between t = 20 and t = 30 seconds. All orders are instantaneous because this is a reference signal. This explains why the change in speed occurs so quickly, within a split second. The vehicle's actual speed won't be affected by this effect, though. This is due to the fact that there are additional factors to take into account in real-world situations, making it impossible for a vehicle to accelerate and decelerate as quickly as the driving cycle required. Because they would cause the vehicle's motion to diverge from the drive cycle directives in the actual world, rolling resistance, drag, and road incline have an impact. The inertia of the transmission system and the inertia of the vehicle are additional factors.
As we can observe 2 different colored plots the yellow colored graph is Electric Vehicle Body which can be seen rising with rising in the drive cycle plot at t=5 seconds and the same plot starts falling at t= 20 seconds as soon as the WOT drive cycle comes back to zero. The plot finally at t=30 seconds shows a speed of around 6 m/s.
Current:
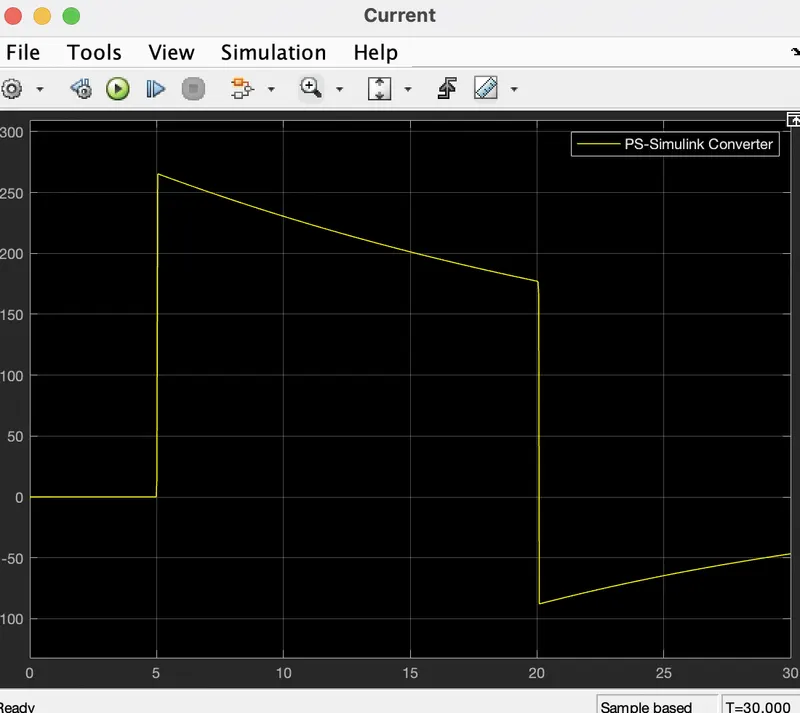
As we know that the magnitude of the current is directly proportional to the Torque of the motor. Hence when we analyze the plot above the current rises with the starting of the drive cycle at t= 5 seconds to a magnitude of around 260 A. The magnitude of the currents now starts decreasing as the drive cycle is stable at 30 as seen on the Drive cycle plot till t=20 seconds because of the vehicle is in a stable drive cycle the current requirement reduces till there is further change in the drive cycle, acceleration and deceleration. Hence the current reduces till t=20 sec and then when the drive cycle goes back to zero the current also reduces to a negative value. This means the motor has now entered the regenerative zone and has now reversed the current flow to the battery.
Now after t=20 seconds it is observed that the negative value of current is now increasing towards a positive or zero value. Since the drive cycle has reduced to zero hence the current won't rise above zero, but instead, the current would be stable at zero value after some time. Another main reason for an increase in the current value is that the speed of the vehicle is slowly reducing to zero hence the regenerative current would also reduce and hence as soon as the vehicle stops the current would be at zero.
SoC:
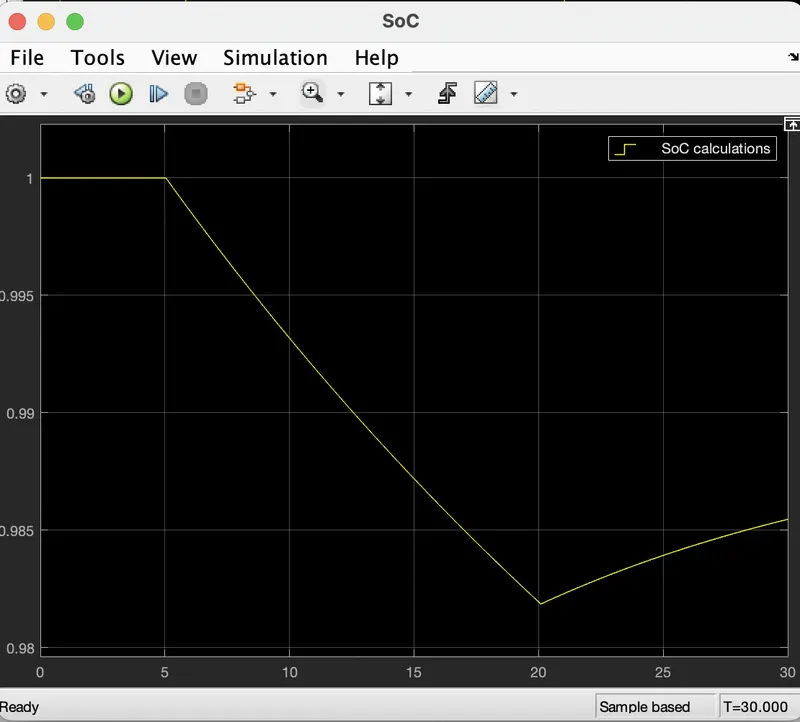
The SOC scope displays how the battery's state of charge changes over the course of a drive cycle. Since the battery was initially modelled to have a SOC of 1 (100%) when the simulation started, the SOC remains at 1 until t = 5 seconds. This is because the driving cycle directs the car to be at rest for that amount of time, preventing battery drain. The car is instructed to accelerate in the WOT state at t = 5 seconds, which causes the battery's SOC to drop. Due to the vehicle's full-power acceleration, the SOC declines from 1 to a minimum of 0.9824 at t = 20 seconds, although the rate of discharge continues to decline over the acceleration duration. Because less energy is needed to boost speed as the vehicle accelerates, this is consistent with the current flow from the battery. As was previously indicated, the maximum discharge happens during the initial acceleration phase, when the battery is drawing the most current. The acceleration falls off as the vehicle's speed rises, which mildly reduces the current and, in turn, the rate of discharge. The vehicle is instructed to slow down at time t=20 seconds, which causes the vehicle's velocity to drop. As a result, the vehicle experiences regenerative braking, which results in a negative current flow back to the battery. The battery's SOC rises during the deceleration period as a result of the effect charging the battery. The regenerative braking action charges the from 0.9824 to 0.9858, and this is why the SOC rises so gradually. The increase in the battery's SOC is correlated with the negative current flow. The vehicle speed lowers but does not reach 0 m/s since the car is instructed to slow down until t = 30 seconds. As a result, the vehicle experiences regenerative braking for the duration of the time following t = 20 seconds.
Distance:
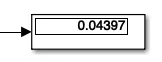
As seen in the screenshot above, the display block determined that my EV vehicle traveled 0.04397 kilometres during the specific WOT cycle. Since the WOT drive cycle is very brief and only requires acceleration for a portion of the time, this measurement appears acceptable and accurate. The region underneath the velocity time graph shows us how far an object has moved. A quick calculation based on the speed scope shows that this distance value is accurate.
Displacement is a vector quantity, which means it has both size and direction. It is defined as the distance in a specific direction. As a result, if the velocity data in a driving cycle were negative, this would mean that the vehicle was moving backward and thus the displacement should be negative. If the velocities in the drive cycle data were of that sort, the display block would show the same.
Conclusion:
In conclusion, the SIMULINK software was used to build the essential block components for the EV model, and it was simulated for a certain WOT drive cycle. The simulation gave data for the vehicle's speed, the current draining from the battery, the battery's state of charge (SOC), and the distance traveled by the EV. The simulation ran relatively quickly—within a handful of seconds—because the EV model was parameterized to mimic averaged voltage pulses in the H-Bridge and Controlled PWM voltage blocks to be supplied into the DC motor.
Although it could have followed the reference signals more closely, the EV model was able to execute the directives provided by the reference velocities from the drive cycle data. The difference between the vehicle's reference velocity and actual velocity can be ascribed to a number of things, including the vehicle's inertia, the transmission system, and the transmission's inertia. The model would follow the reference signals more closely and would have better performance characteristics if the EV model was created in a way that enhanced those factors. My EV model traveled 0.04397 kilometers, which appears to be a reasonable distance given the WOT drive cycle that was employed.
I noticed that my EV model's battery's SOC did not discharge in the manner I had anticipated. This can be as a result of the drive cycle orders not pushing the EV model to its limits or as a result of the battery model being highly effective and appropriate for the driving application. The current-time and SOC-time graphs of my EV model showed that it also incorporated some real EV functions, such as regenerative braking, which was visible anytime the EV decelerated. I might have witnessed my EV model reveal its genuine performance characteristics if the WOT driving cycle's duration had been lengthened. For instance, the EV model might reach its highest speed and it might have also been possible to see how long it takes for the vehicle to decelerate from that top speed and, as a result, how long it takes to accelerate, such as from 0 to 50 kmph.
In addition to the velocity, current, and SOC charts collected from their respective scopes, my EV model has been added to this assignment as an a.mdl file.