Final Project: Design of an Electric Vehicle
Student of Online EV-Batch 16:-
PURPOSE OF MATHEMATICAL MODEL & SIMULATION
>Mathecmatial models are most suitable for initial experiments.
>Actual system relaiasation is costly and time consuming.
>Testing before actual demonstration.
>We know before to see the limitations and failures and knowing errors of the model.
>The mathematical model gives the performance of the vehicle.
>Simulation is noting but creates a virtual reality in a software environment by solving governing equations are solved from this equation mathematical model is developed.
OBJECTIVES:
>To make a most simple and low run-time vehicle model using indiviual models components blocks.
>To run indiviual models of the vehicle model and integrate.
>To checkout performance parameters like speed, state of charge of the battery and current.
>Give inputs motor power and vehicle body.
>To know MATLAB model and their configuration to match with actual vehicle
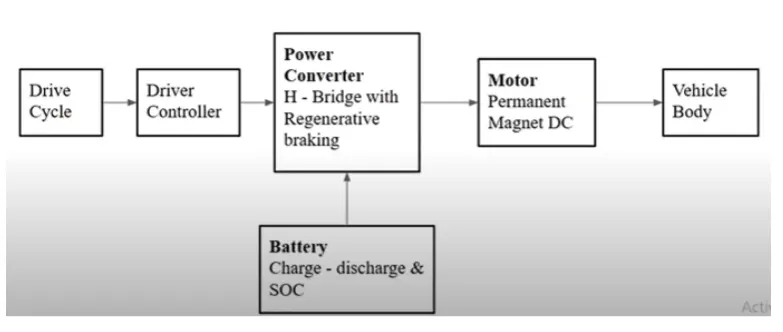
BLOCK DIAGRAM:
 INTRODUCTION OF ELECTRIC VEHICLES:
>An electric vehicle(EV) is one that operates on an electric motor.
>Instead of an internal combustion engine that genertaes power by burning a mix of fuel and gases.
>Therefore, such a vehicle is seen as a possible replaemnet for current-generation automobiles.
>In order to address the issue of rising pollution, global warming, depleting natural resources, etc.
>Though the concept of electric vehicles has been around for a long time.
>It has drown a considerable amount of interset in the past deacade amid a rising carbon footprint and other environmental impacts of fuel-based vehicles.
While some EVs used lead-acid or nickel-metal hydrite battries, the standard for mordern battery electric vehicles is now considered to be lithium-ion battries as they have greater longetivity and are excellent at retaining energy, with a self discharge rate of just 5% per month. Despite the improved efficiency, there are still challenges with these battries as they can experince thermal runway, which has, for example, caused fires or explosions in the Tesla Model S, although efforts have been made to improve the safety of these battries.
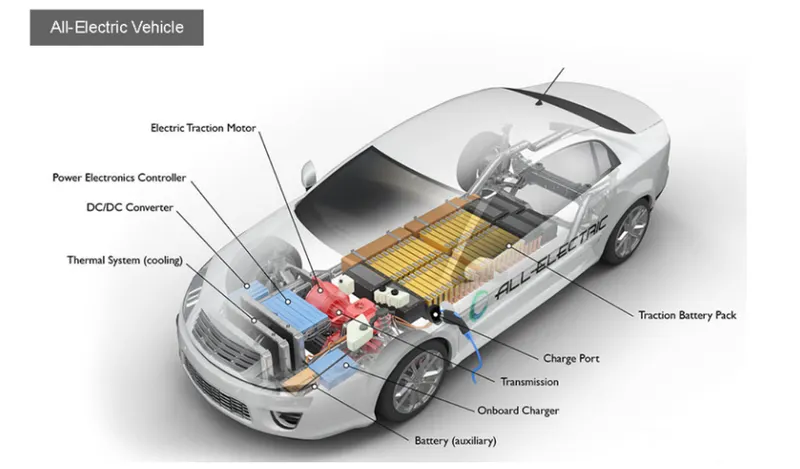
There are two main types of electric vehicles(EV); fully electic and plug-in hybrids:
FULLY ELECTRIC:
>It can be charged at jhome overnight, providing enough range for average journeys.
>However, long journeys or those that require a lot og hill climbs may mean that the fuel cells require charging before you reac h your destination.
>Although regenrative braking or dividing downhill can help mitigate against this by charging the battery packs.
>Charging ranges from 30 minutes and up to ore than 12 hours. this all depends upon the speed of the chat=rging station and the size of the battery.
ADVANTAGES OF BATTRY ELECTRIC VEHICLES(BEV):
>Creates very little noise.
>No exhaust, spark plugs, clutch or gears.
>Doesn't burn fossil fuels, instead uses rechargeable battries.
 PLUG-IN HYBRID ELECTRIC VEHICLES:
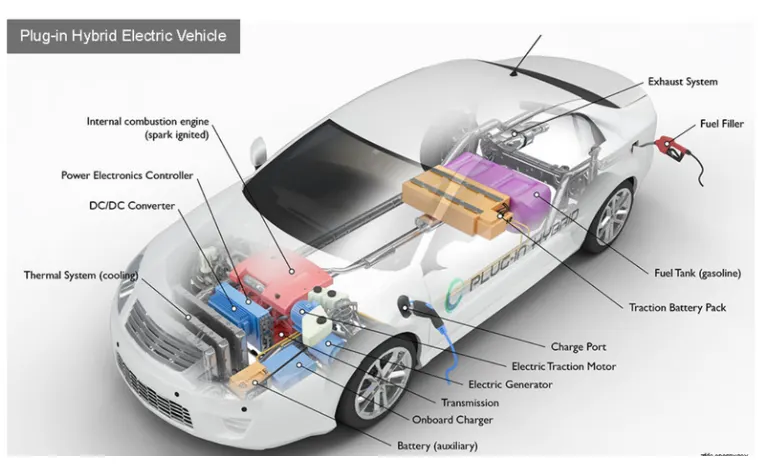
>Hybrid electric vehicles offer a mixture of battery and petrol or diesel power.
>This makes them better for travelling long distances as you can switch to traditional fuels rather than having to find charge points to top up the battery.
>This makes them better for travelling long distances as you can switch to traditional fuels rather than having to find charge points to top up the battery.
>The same disadvantages that apply to combustion engine vehicles also appky to PHEVs.
>no need for more maintainance, engine noise, emissions and the cost of petrol.
THE MAIN COMPONENTS OF THE ELECTRIC VEHICLE ARE:
>Wheels/tire
>Battery
>Motor/Generator
>Motor Controllers
>Power Converters
>Transmission Sysytems.
MATLAB FILE FOR AN ELECTRIC VEHICLE:
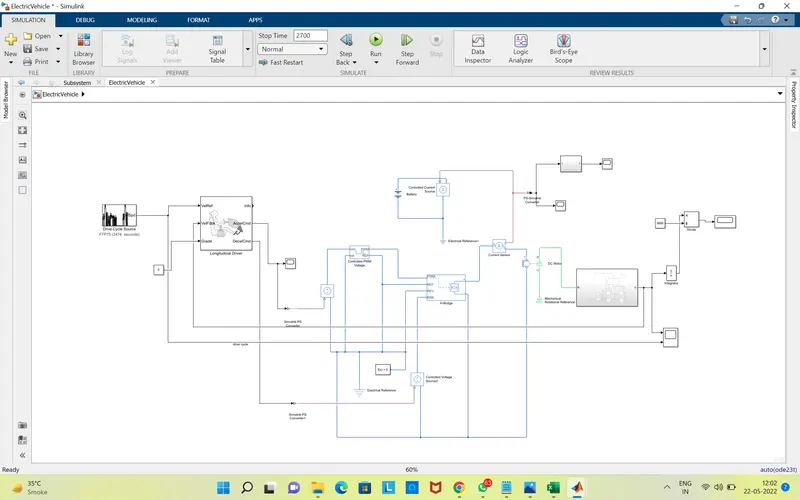 >From the above picture, iy's clearly seen there are different blocks and subsyatems used to make the simulation.
>These blocks are as follows:
TIRES:
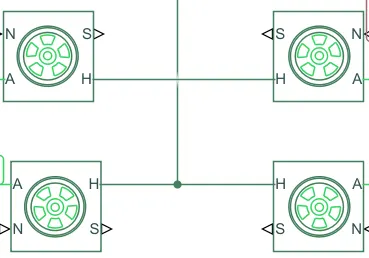
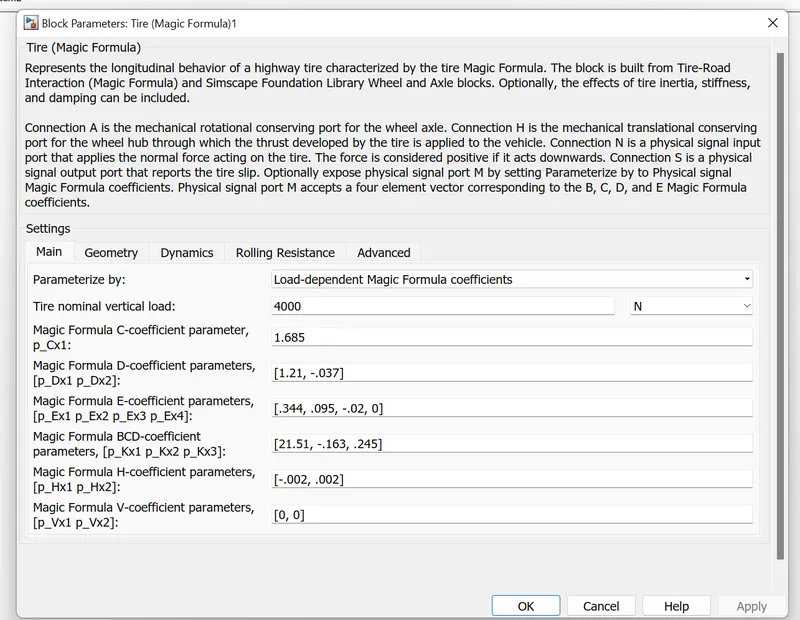 >N-WE need to apply to apply a normal fore.
>A is nothing but an axle.
>H is a Hub.
>S stands for Slip.
>Total tire for a vehicle of front and other two tires have the rear side of the vehicle.
VEHICLE BODY:
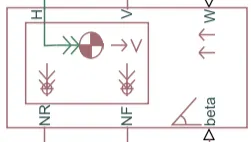
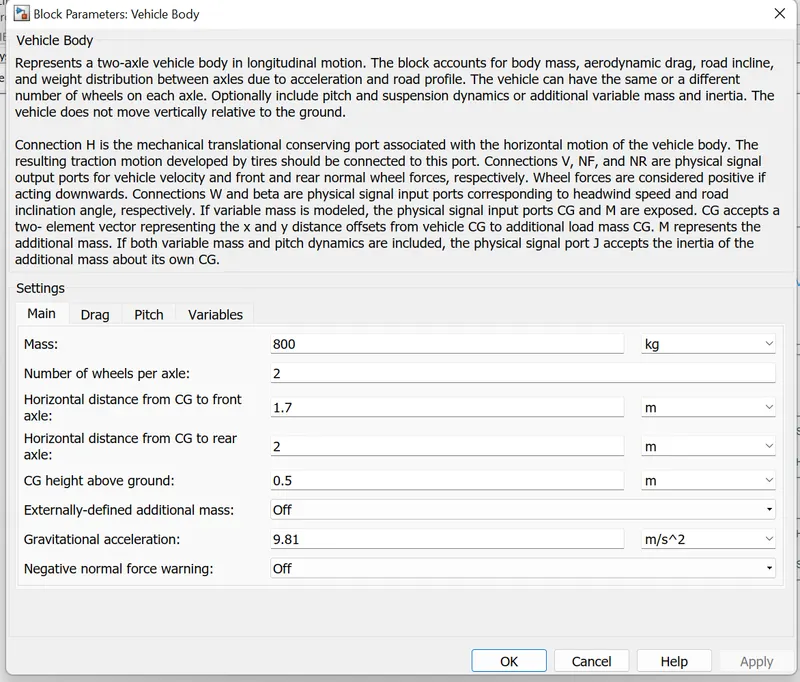
This block contains 6 parts that can be used in various aspects:
>H-H stand for hub it is used to connect the hub of the wheels to the main body of the vehicle.
>V-Physical signal output port of velocity is used the velocity output of the vehicle.
>NR-Physical signal output port is used to connect the rare wheels.
>NS-Physical signal output post is used to connect the front wheels.
>Beta-physical signal input port which allows the vehicle to undergo an inclination of hil-climbing force.
SIMPLE GEAR:
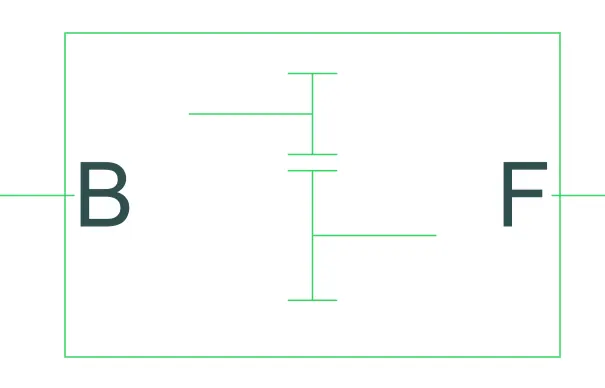
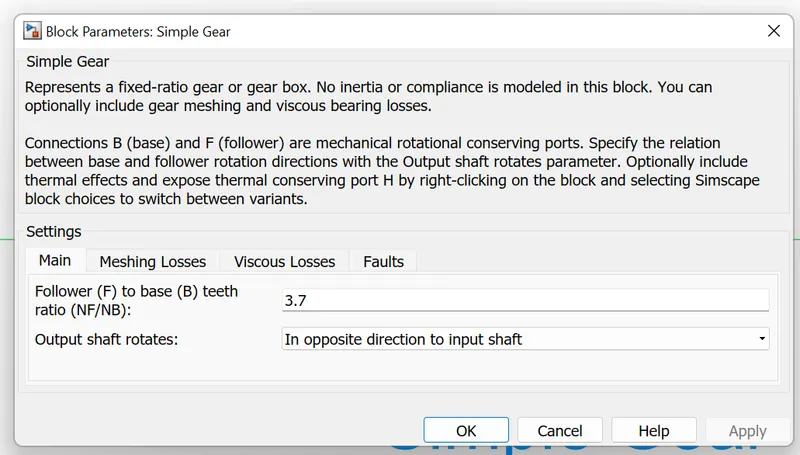
This block model a gear system with a fixed-gear raio with non-inertia effects. However, we can modify the messing of the gear teeth here the follower to base teeth ratio has been set to 2 and the output shaft rotates in the same direction as the input shaft.
POWER BLOCKS:
H-Bridge:
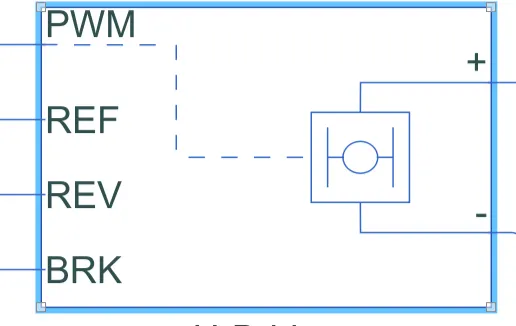
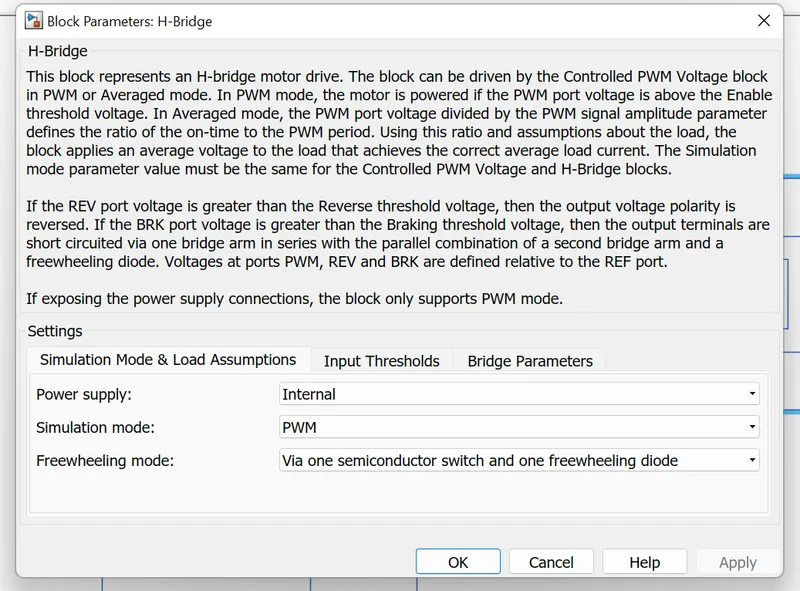
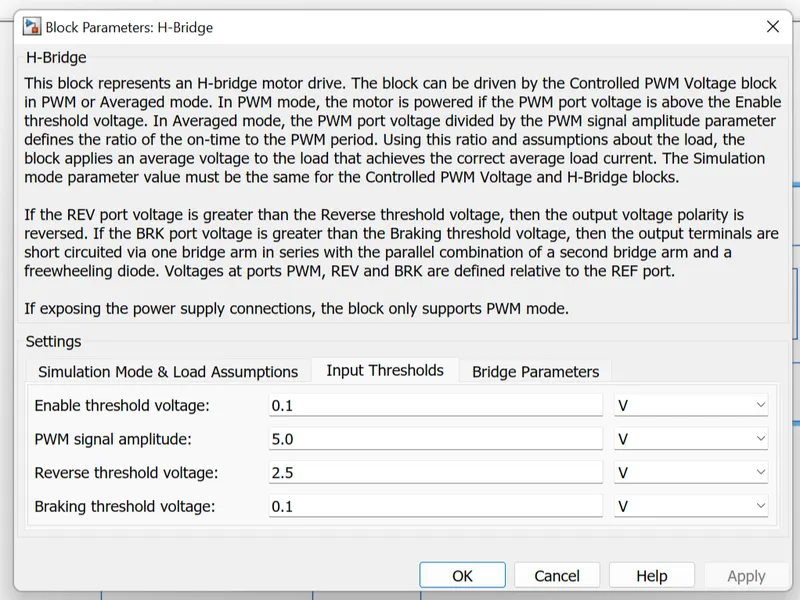
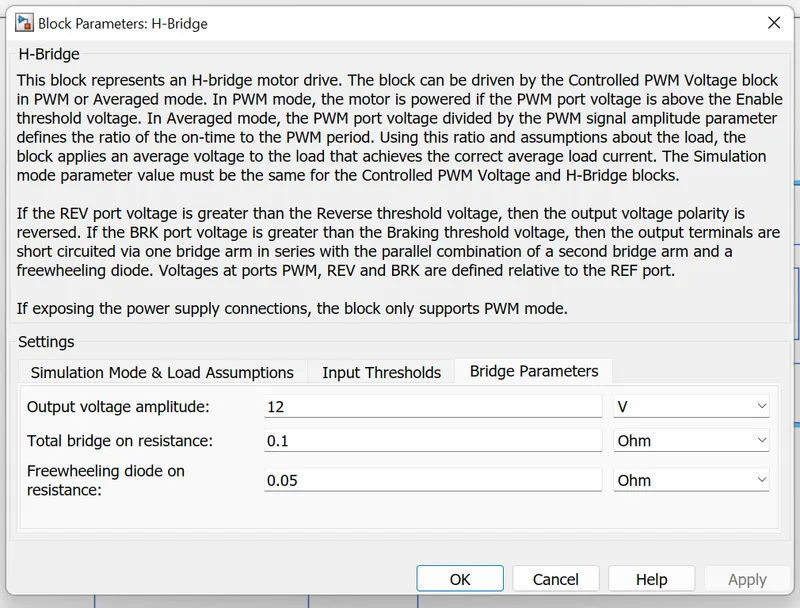
>The H-Bridge block represents an H-bridge motor driver. The block has the following two simulation mode options.
>If the input signal has a value greater than the enable threshold voltage parameter value, the H-Bridge block output is on and has a value of the output voltage amplitude parameter.
>The H-Bridge block drives the motor.
>In this example, all input ports of the H-Bridge block except the PWM port are connected to the ground. As a reuslt, the H-bridge block behaves as follows:
>When the motor is on, the H-Bridge block connects the motor terminals to the power supply.
CONTROLLED PWM VOLATGE:
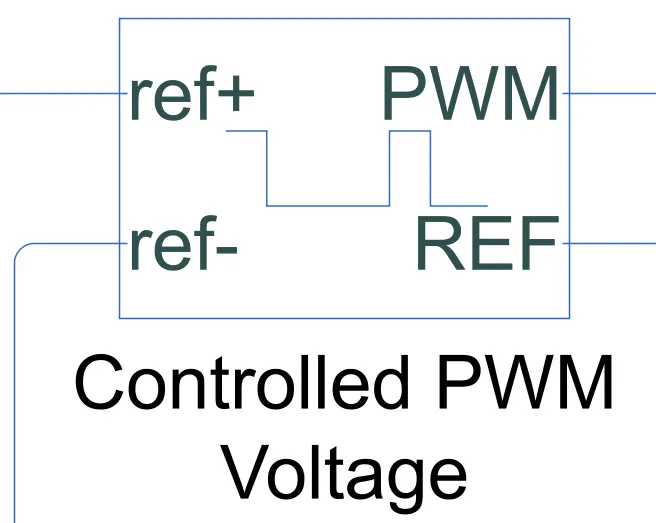
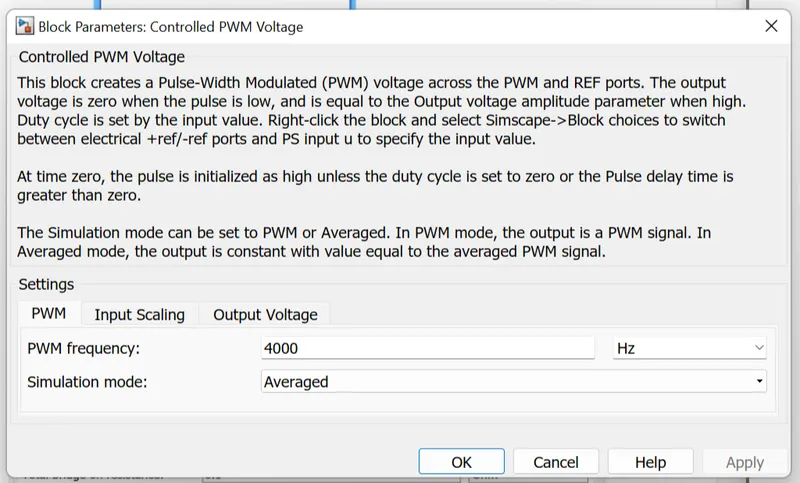
>The H-Bridge block output is acontrolled voltage that depends on the input signal at the PWM port.
>If the signal has a value greater than the ennable threshold voltage parametr value, the H-Bridge block output is an and has a value equal to the value of the output voltage amplitude parameter.
DC MOTOR:
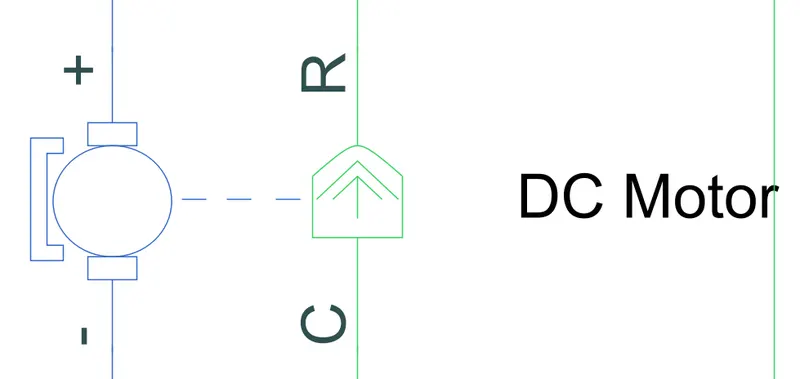
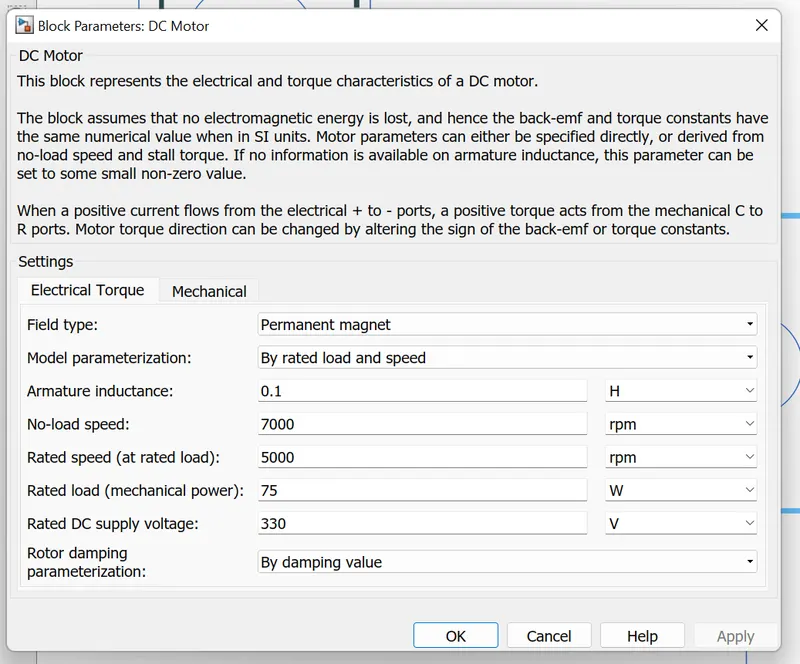
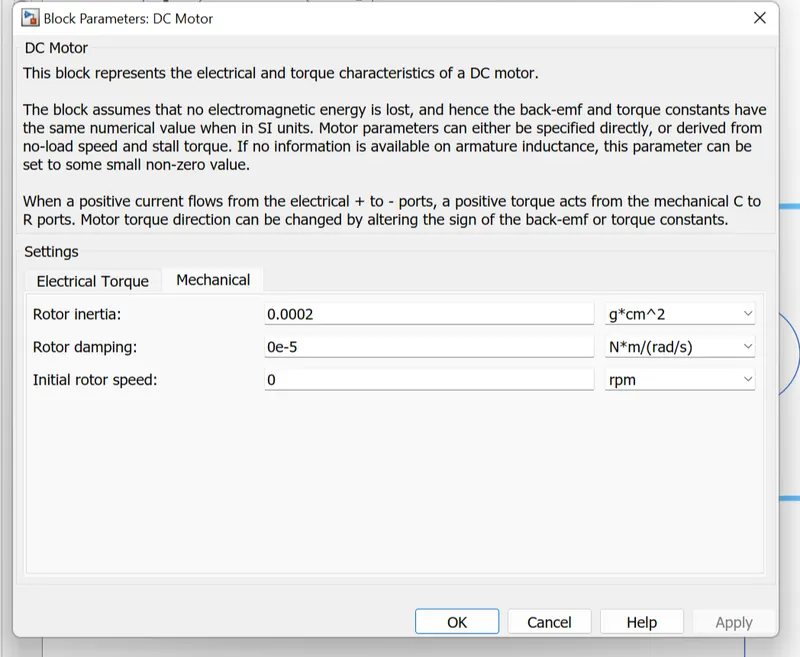
>This block is used in the DC motor Position:Simulnk Modelling Section.
>In order to simualte the response of this system, it is further neccassry to add sensor blocks to the model to simulate the measurement of various physical parametrs and a voltage source to provide to the motor.
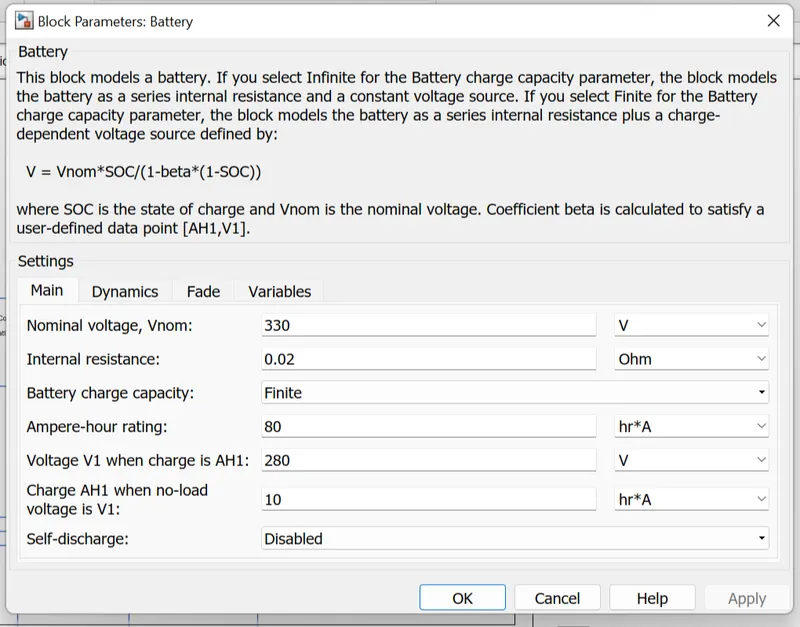
BATTERY:
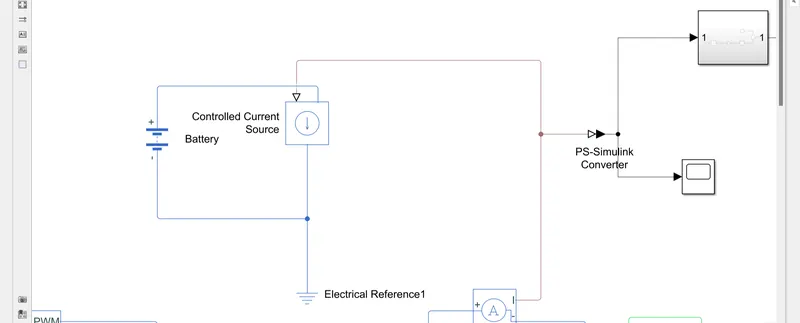
>The positive terminal of the battery is connected to the positive port of the controlled current source and the negative terminal is connected to the negative port of the controlled current source.
>The physical signal of the controlled current source is connected to a PS-Simulink coverter to connect to the goto block.
>Connect integrator to the sign block such that ampere-hour is converted to ampere second and connect the sum block with constant.
STATE OF CHARGE:
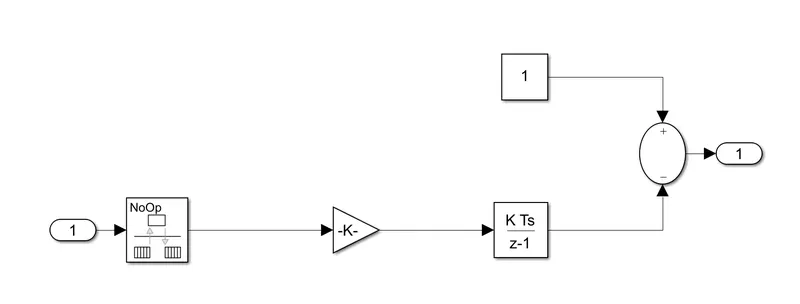
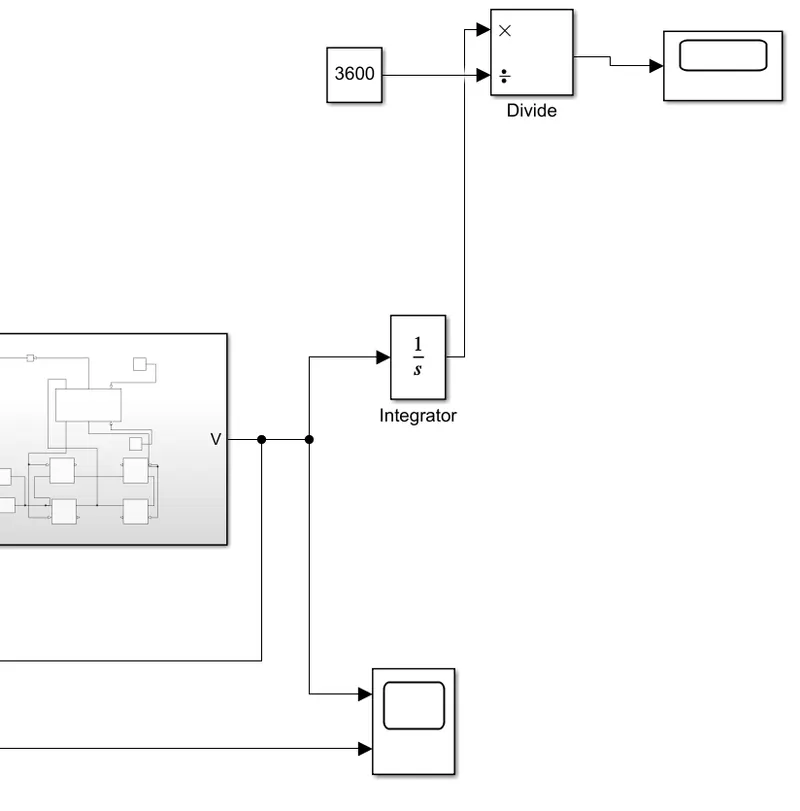
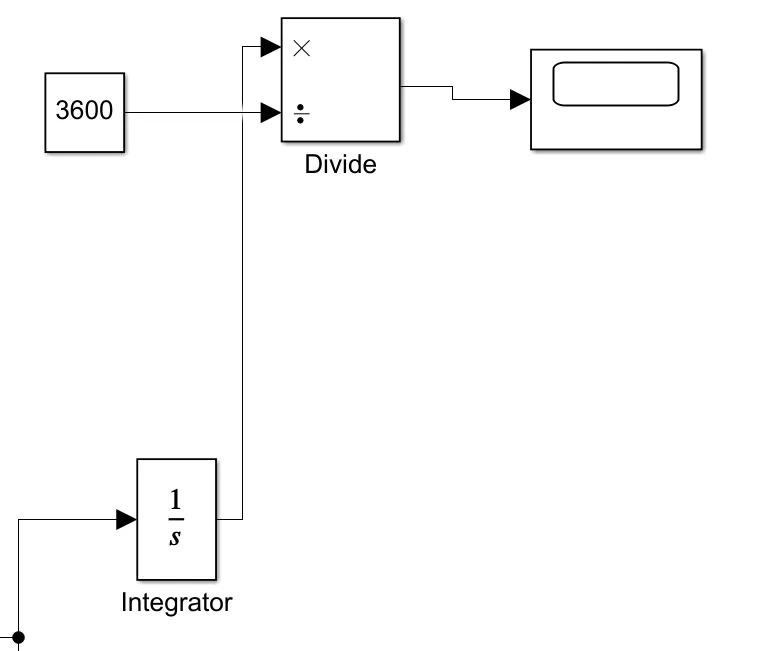
>To measure the state of charge of the battery, the integrator block is used to handle data tranfer and integrate the value of the current signa;l with respect to time then gain block is used in order to multiply divide the signal coming from the integrating block.
>This block will divide acurrent signal with the ampere rating battery which is 160(ah)*3600(sec).
>Assuming the battery is always fully charged, a constant block is added with value of 1.
TOOLS:
CONTROLLED VOLTAGE SOURCE:
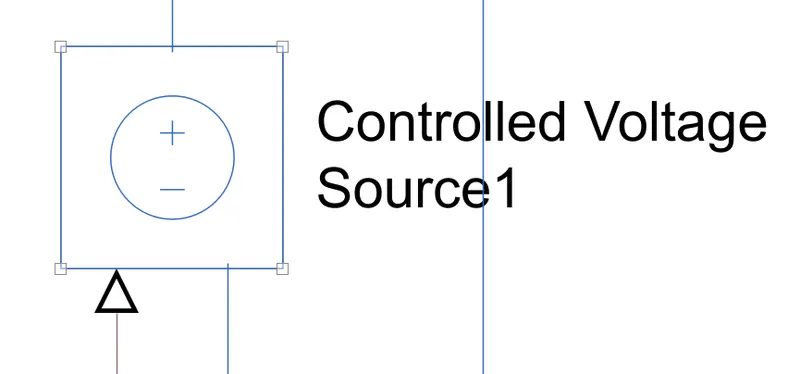
>The block represents an ideal voltage source that is powerful enough to maintain the specified voltage at its output regardless of the current passing through it.
>The output voltage is V = Vs, where Vs is the numerical value presented at the physical signal port.
CONTROLLED CURRENT SOURCE:
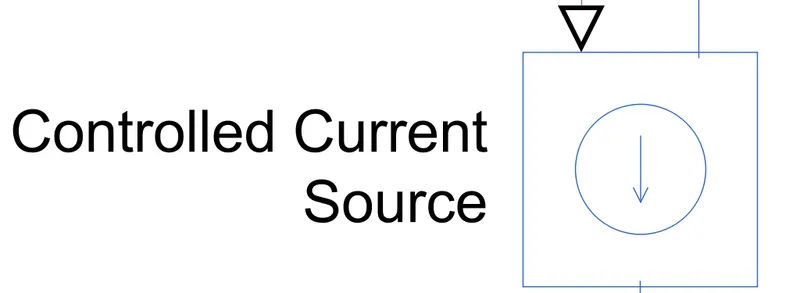
>The block represents an ideal current source that is powerful enough to maintain the specified current through it regardless of the voltage across it.
>The output current is I = Is, where Is is the numerical value presented at the physical signal port.
INTEGRATOR:
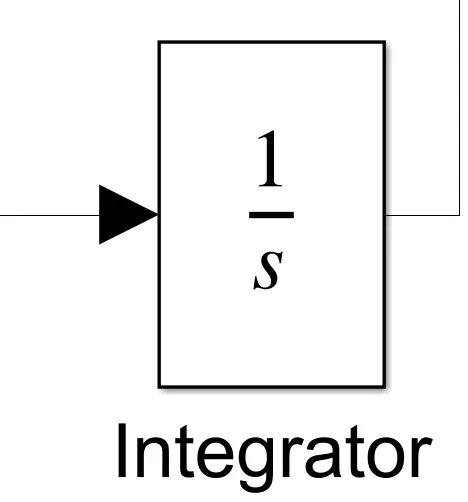
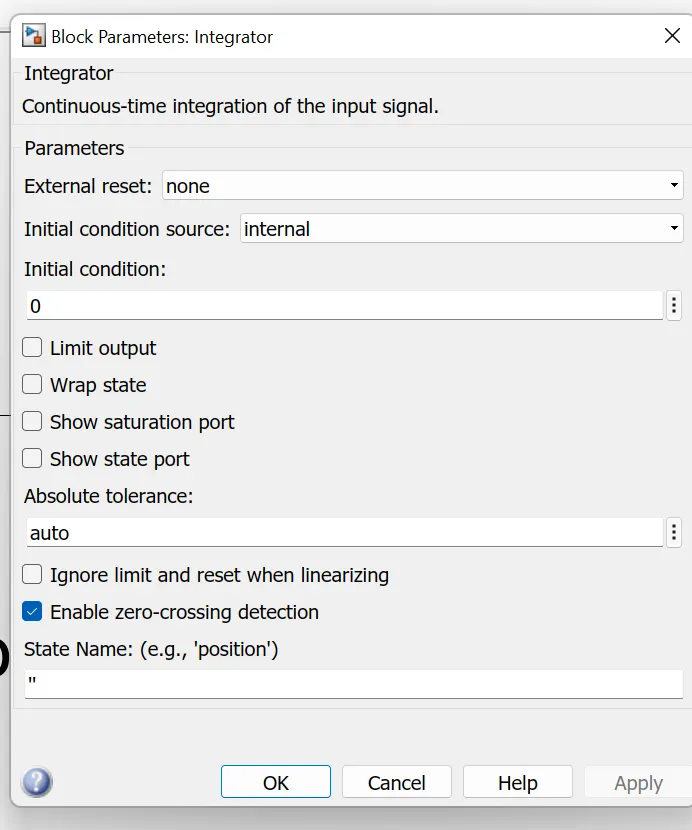
>The integrator block outputs the value of the integral of its input signal with respect to time.
DRIVE CYCLE:
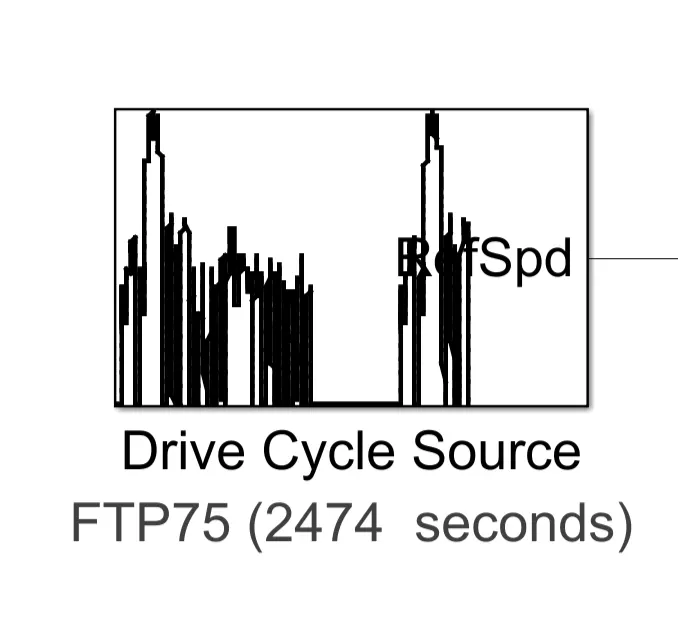
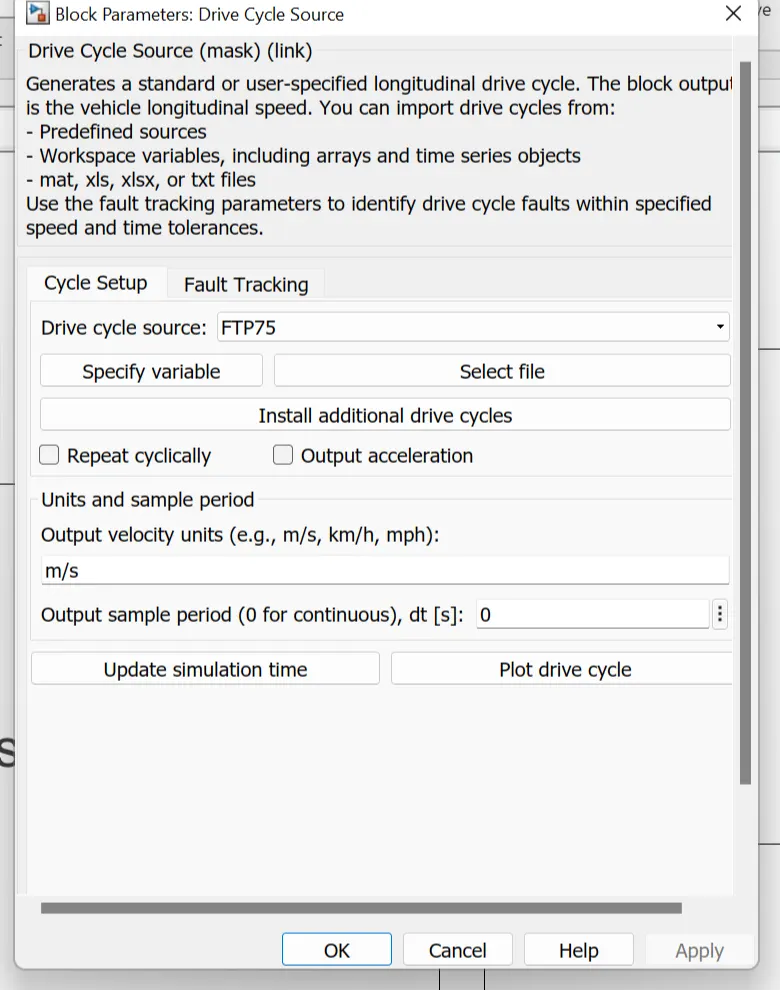
>It generates a standard or user-specidied longitudnal drive cycle.
>The block output is the vehicle's longitudibal speed, uses the fault tracking parameteres to identify drive cycle faults within the speed and time tolerances.
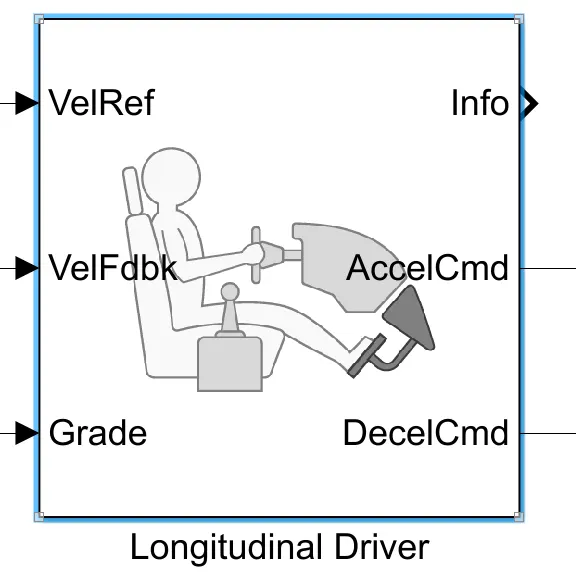
LOGITUDINAL DRIVE BLOCK:
>Open the drive cycle source and select the drive cycle as FTO75 and click ok.
>Conne t the Refsp to the Velref of the logitudinal drive block.
>Create from the block and connect it to the velfdbk.
>Connect the velcoity block to the MUX along with the drive cycle and go-to block is created and connected to the outout of the MUX.
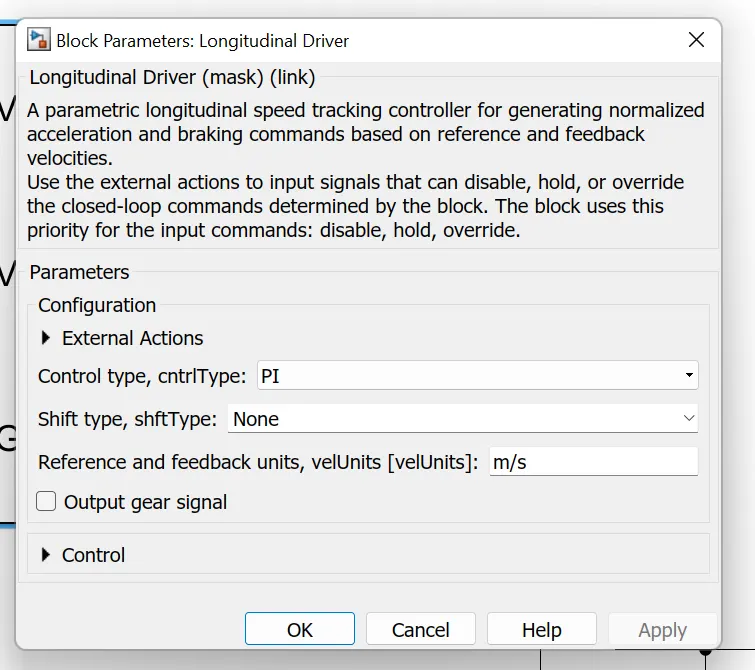
>The run time for the simulation is given 2700 seconds, and the the simulation is ran after that.
>The output results after running the simulation is as follows:
RESULTS:
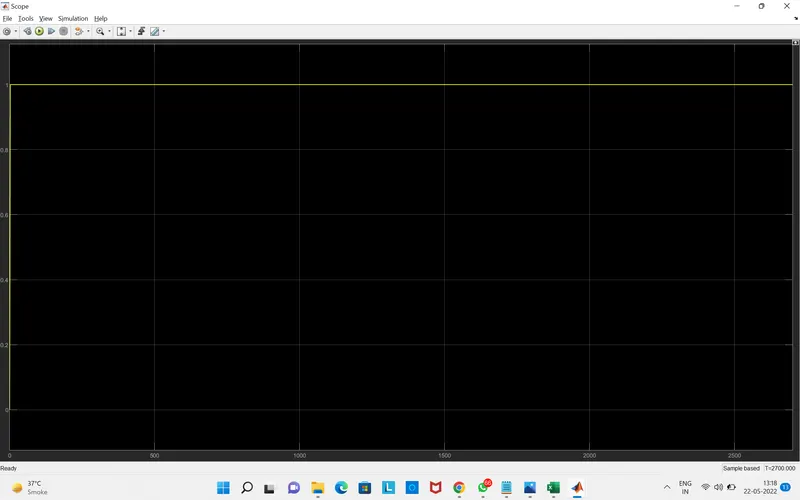
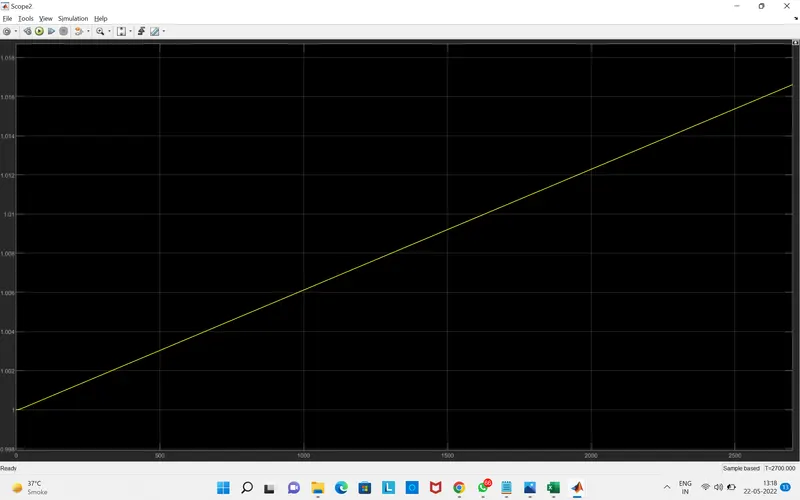
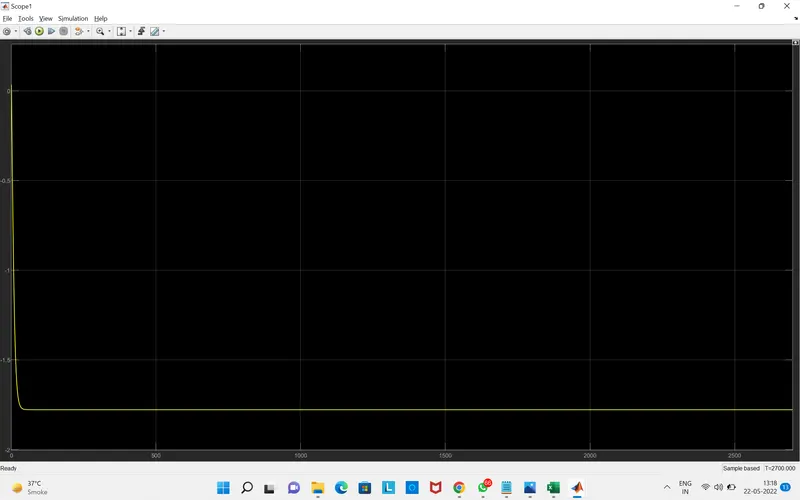
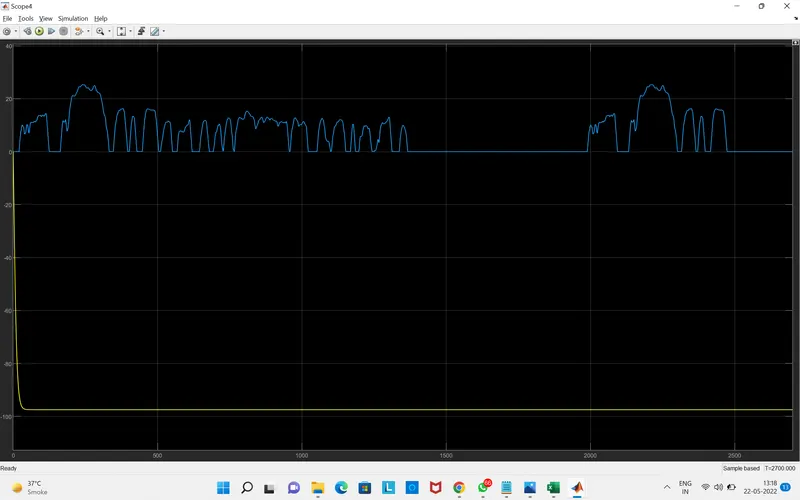
>The output of the drive cycle and velocity graph can be seen and observed that the velocity depends on the drive cycle input.
>The current output is plotted and observed that the current is fluctuating with respect to time.
>In this graogh state of charge of the battery decreases with the time.
>In SOC graogh, the speed spikes show regenrative braking is considered.
The EV model has been created with the help of simulink and the model simulated with the Drive cycle source(FTP575(2474s)) the simulation has produced the reults of vehicle velocity with respect to the accelaration and the current flowing state of charge as well as the distance travelled in simulation time.