Final Project: Design of an Electric Vehicle
Objectives:
1. System level configurations
2. Model parameters
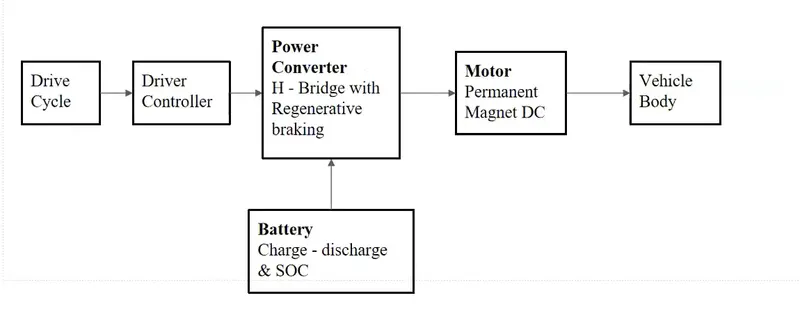
Block Diagram of the system:
Vehicle body subsystem:
It consists of Tires , simple gear and vehicle body which deals with gradient, body mass, aerodynamic drag, road incline, and weight distribution between axles due to acceleration and road profile.
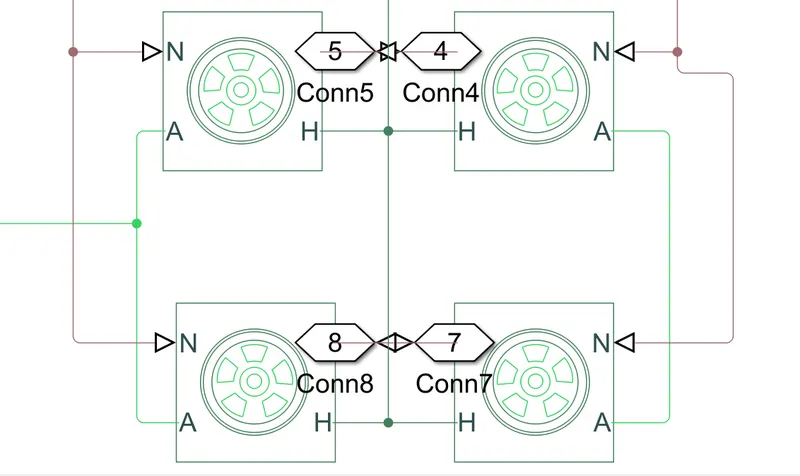
Tires-
Input -(N) normal reacting force acting on tire.
Output-(S) slip value relative to surface of contact and tire.
Conserving port (H & A) - where a represents the axel on which tire is mounted and H represents the wheel Hub on which transmitts thrust generated by wheel to the body of wheel.
Gear-
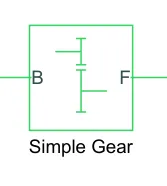
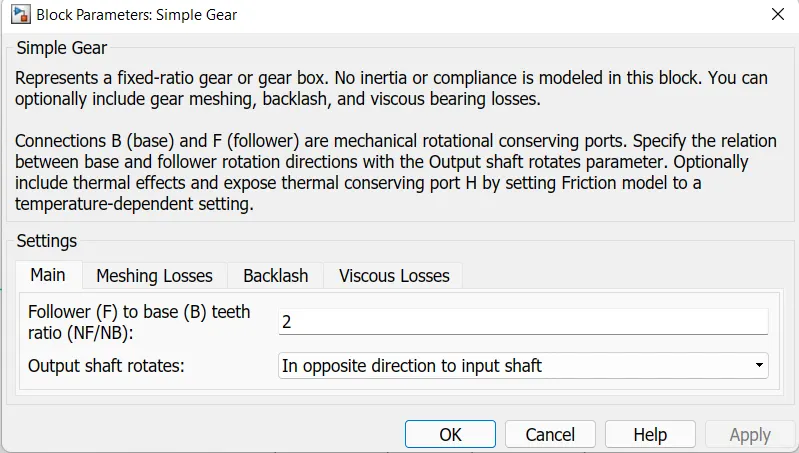
Vehicle body
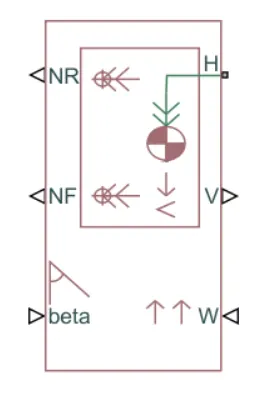
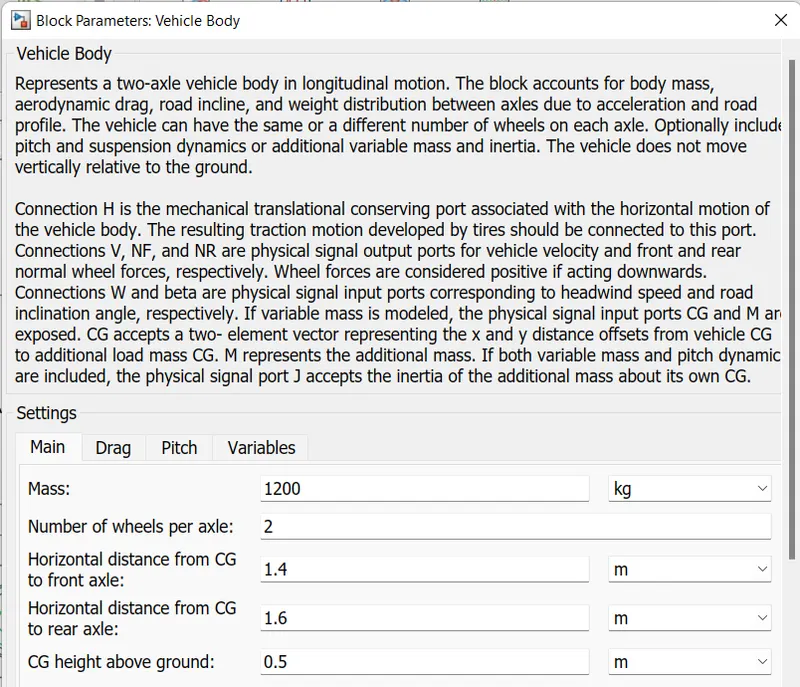
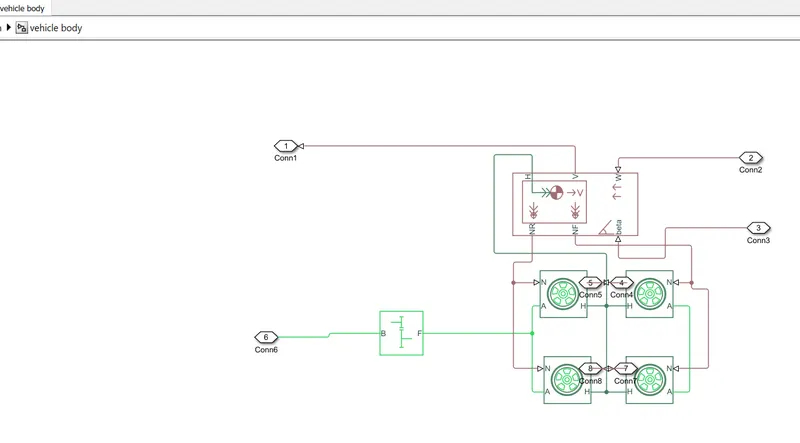
Above system we can observe the vehicle body connected with the tires & tires connected with gear.
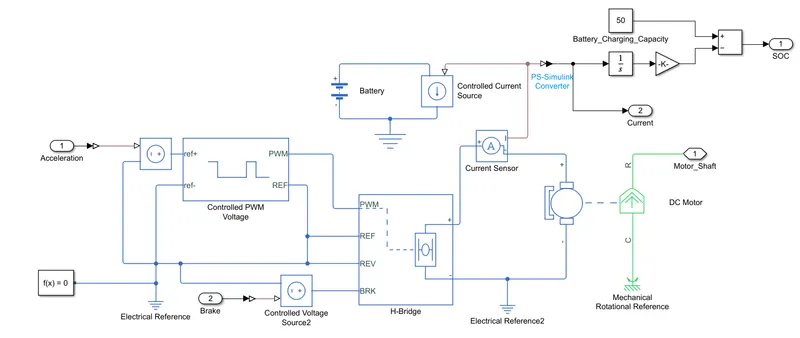
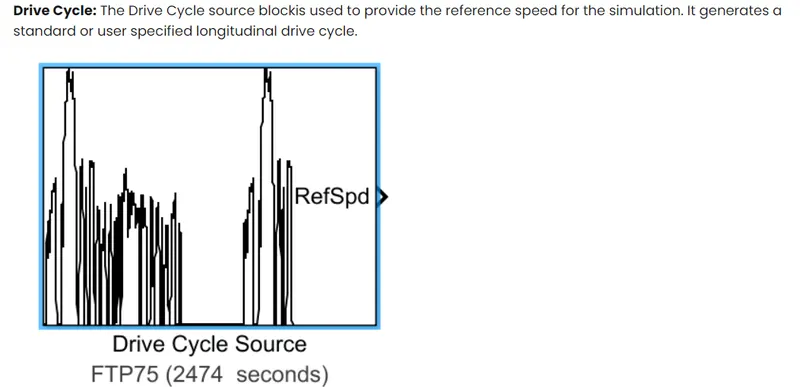
Controller subsystem have DC motor, PWM Voltage controller, H bridge, current sensor, battery, drive cycle input source as FTP75.
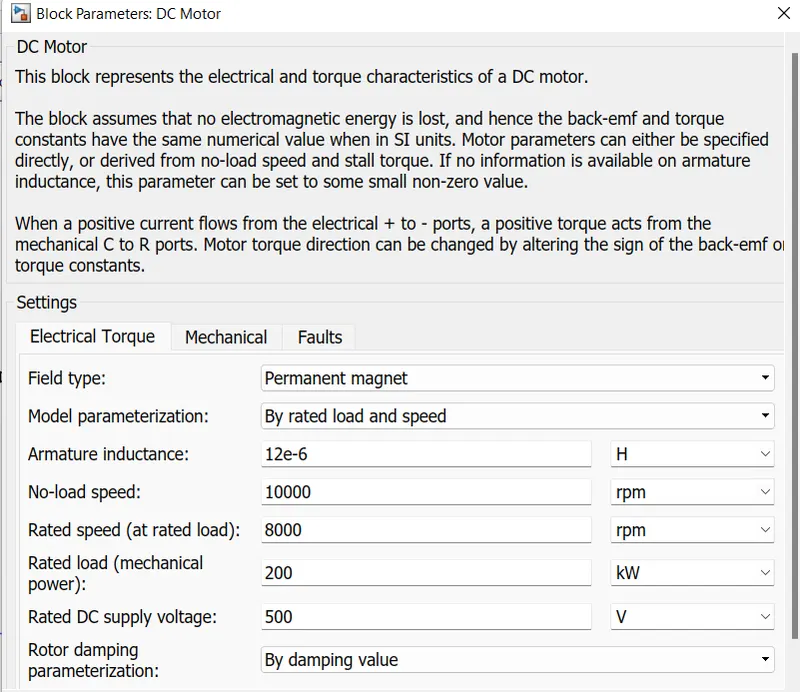
DC Motor: Converts electrical input into mechanical rotational output.
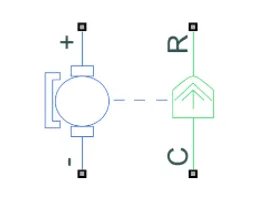
+ & - terminals connected to motor controller. R represents rotational output (Shaft) while C is casing (stationary)connected to mechanical rotational reference.
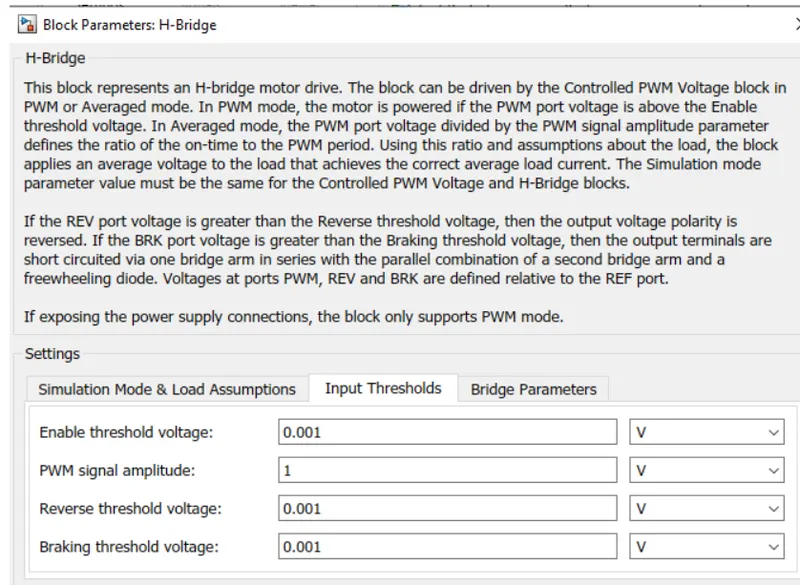
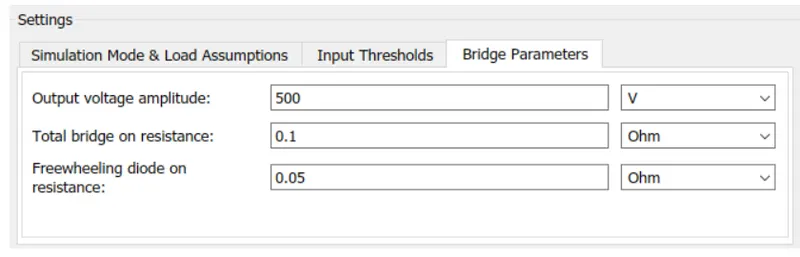
H - bridge - helps in controlling the power (input) according to requirement. Output provided are converted voltage as per the controlled parameter.
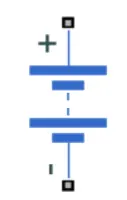
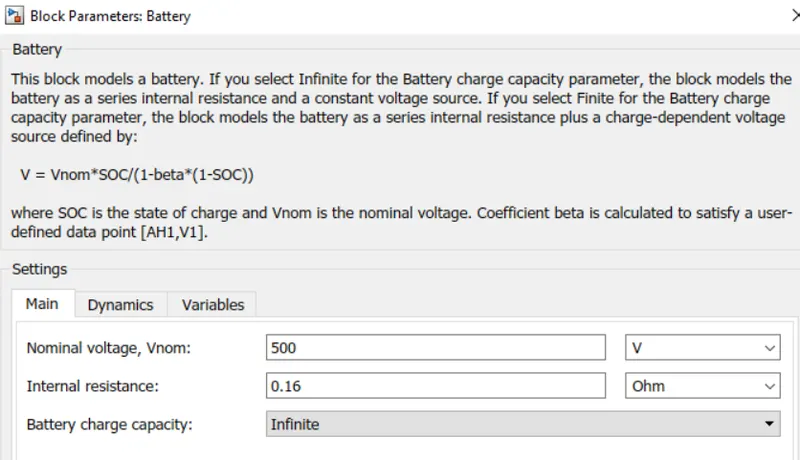
Battery:It is connected as the power source to the model so that the power could be generated and the same is transmitted in accordance with various sources.
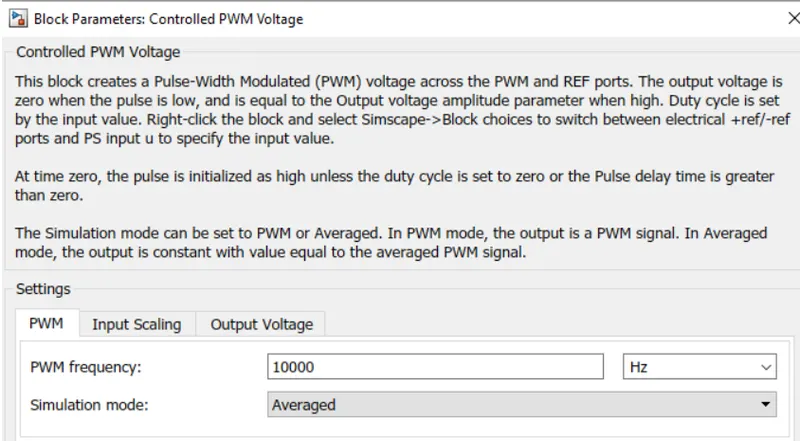
Controlled PWM voltage: It helps in keeping modulated pulse as per requirement with minimal variation observed.
PWM is connected to H bridge and throttle input .
Battery state of Charge: To calculate the SOC of battery. The process to calculate the SOC is by subtracting the charge from the rated capacity of the battery. Accordingly the current is integrated w.r.t. time to get the charge in coulumbs. This value is now modified into Amp-hr.
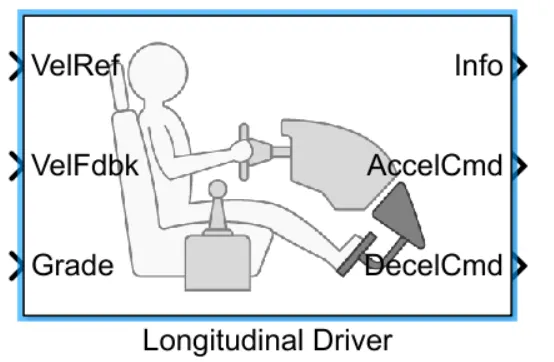
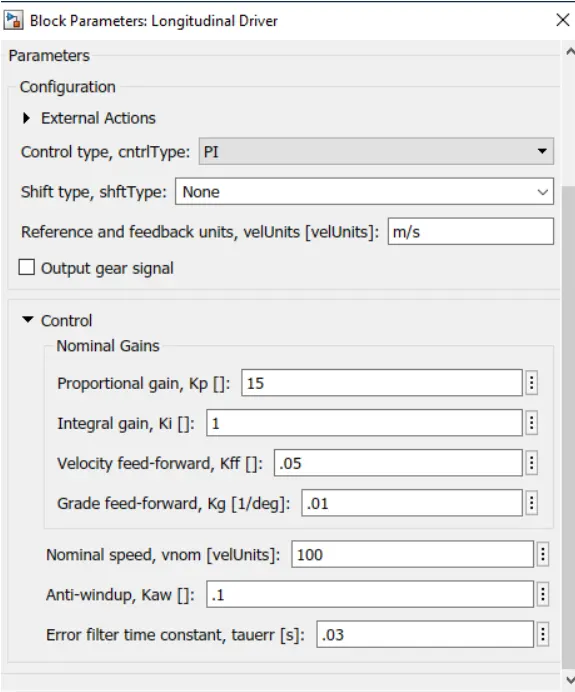
Longitudinal Driver: Longitudinal Driver is an inbuilt block provided by the powertrain blockset.
The Driver model has the input and output ports which are connected to the following. Velocity reference - Driver Cycle
Velocity Feedback - Corresponds to the feedback velocity.
Grade - corresponds to the grade angle = 0
AccelCmd & DecelCmd corresponds to the acceleration and deceleration commands generated respectively and are connected to the corresponding ports of the Controlled PWM Voltage block.
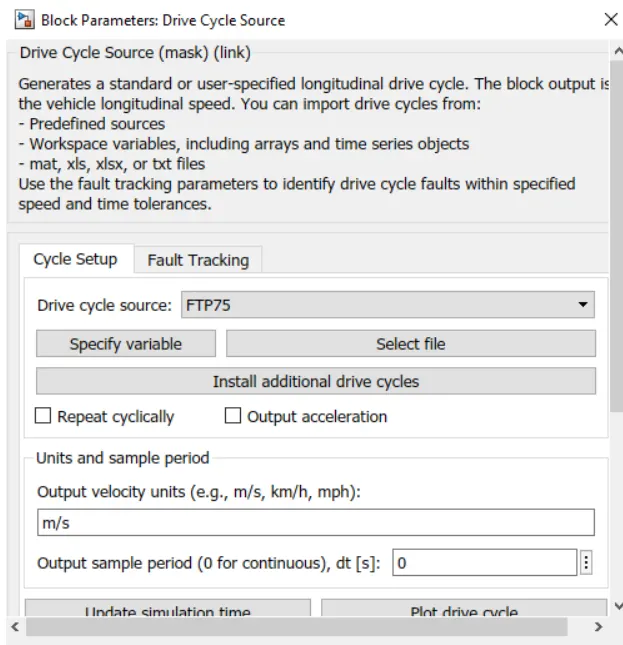
Simulation:
The system is run for 2474 sec which is the total time for which the input drive cycle is defined. A solver Configuration is added to ensure proper solving of the mathematical equations by the model.
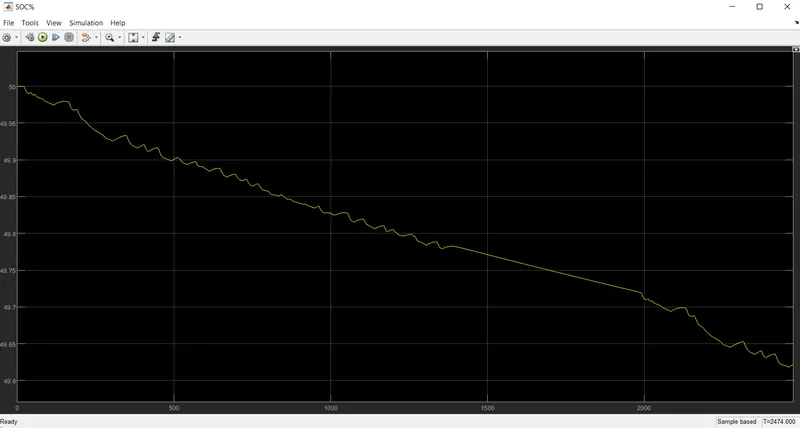
Scopes are connected to analyze different output such as the SOC of the battery, the reference velocity & the actual velocity of the vehicle and the distance covered by the vehicle during total run.
The 2 velocities are first convert from m/sec to km/hr for that we use Gain block. The distance is calculated by simply time integration of the velocity.
Output:
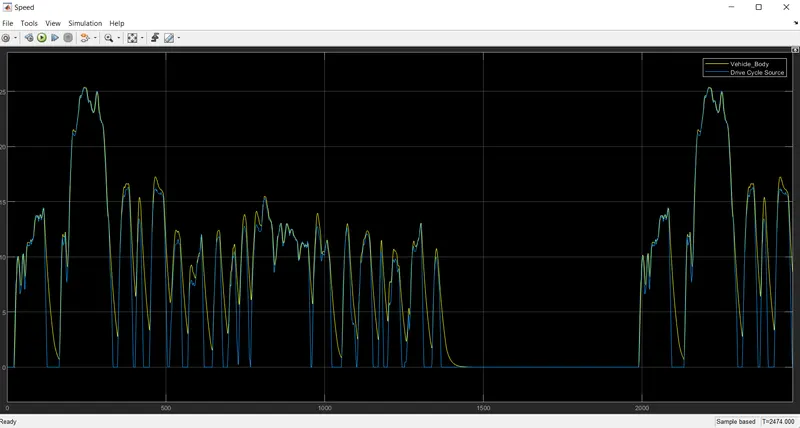
Scope output from both velocity where Blue one represents Standard or reference Drive cycle and yellow is from output of vehicle speed.
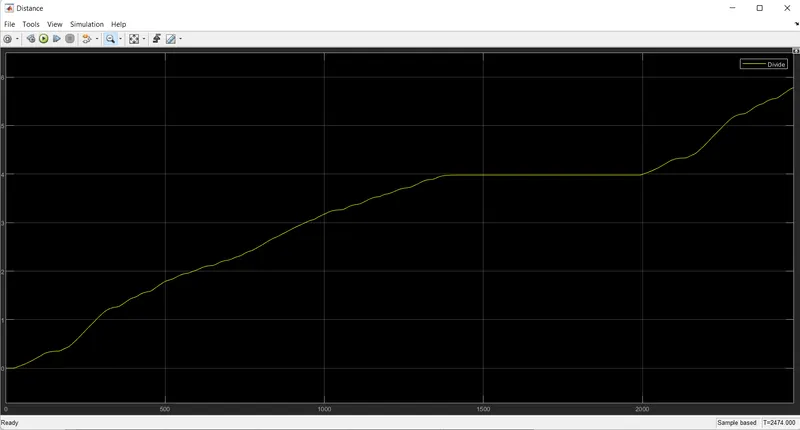
Distance covered in the drive cycle is 5.75km
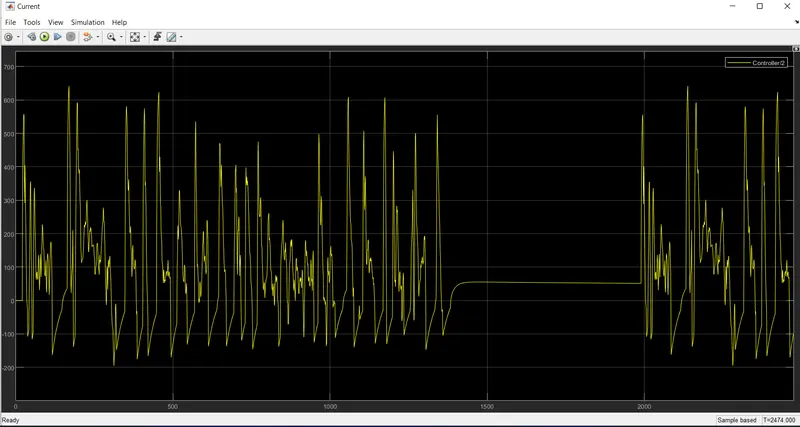
The current plot shows the charging discharging cycle and ideal stop condition of drive cycle.
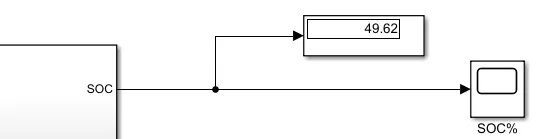
SOC is the discharged rate of the battery i.e; 49.62% from graph.