Final Project: Design of an Electric Vehicle
Create a MATLAB model of electric car which uses a battery and a DC motor. Choose suitable blocks from Powertrain block set. Prepare a report about your model including following:
An electric car is a vehicle that is propelled by one or more electric motors, using energy stored in rechargeable battery packs. These are eco-friendly and has higher efficiency compared to ICE cars. An electric vehicle is 69-72% efficient when counted against stored chemical energy and around 59-62% efficient when counted against required energy to recharge. They use electric motors for propulsion. The most common types of motors used are Permanent Magnet Synchronous Motor (PMSM) and three phase induction motor.
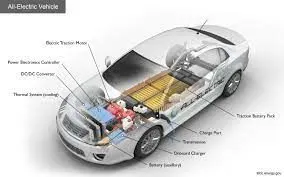
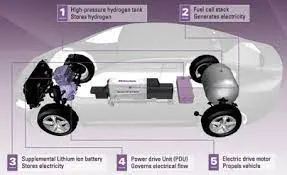
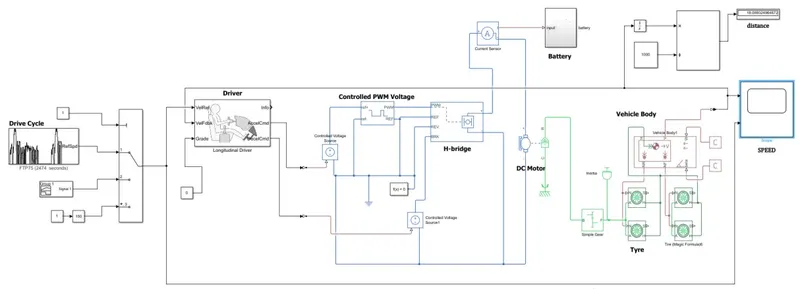
System Level Configuration:
There are major components which is using in EV
1. Drive Cycle
2. Driver
3. H-Bridge
4. DC Motor
5. Battery Source
6. Controlled PWM Voltage
7. Vehicle and other
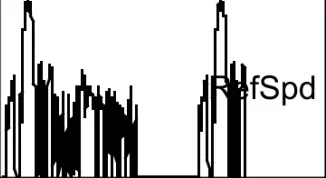
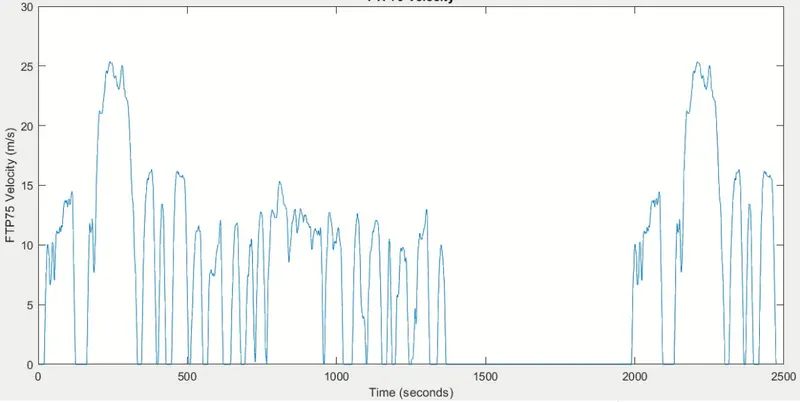
Drive Cycle
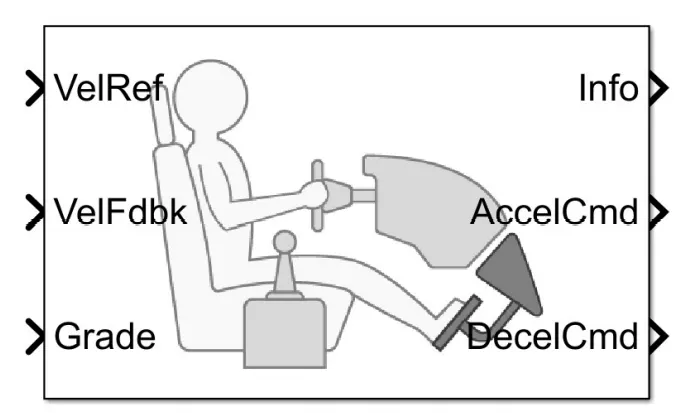
Driver
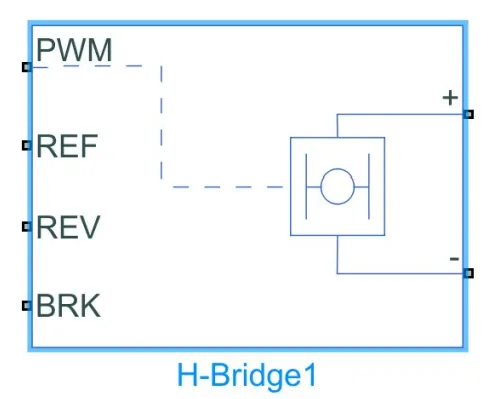
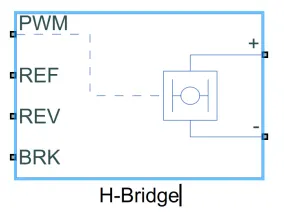
H-Bridge
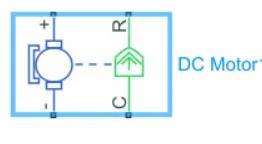
DC Motor
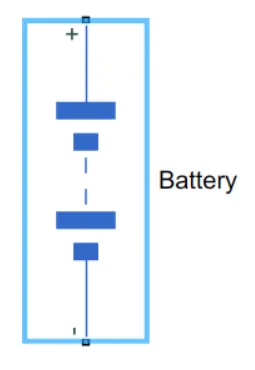
Battery Source
Controlled PWM Voltage
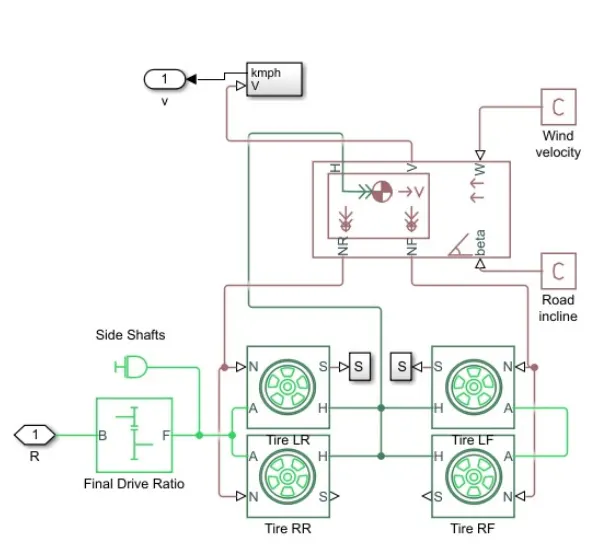
Vehicle and other
Vehicle Body Subsystem
Model parameters:
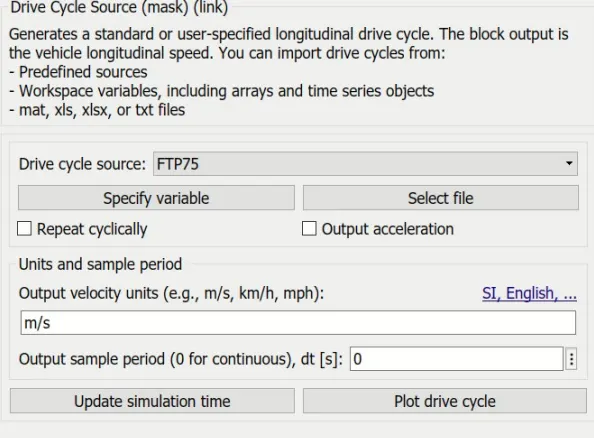
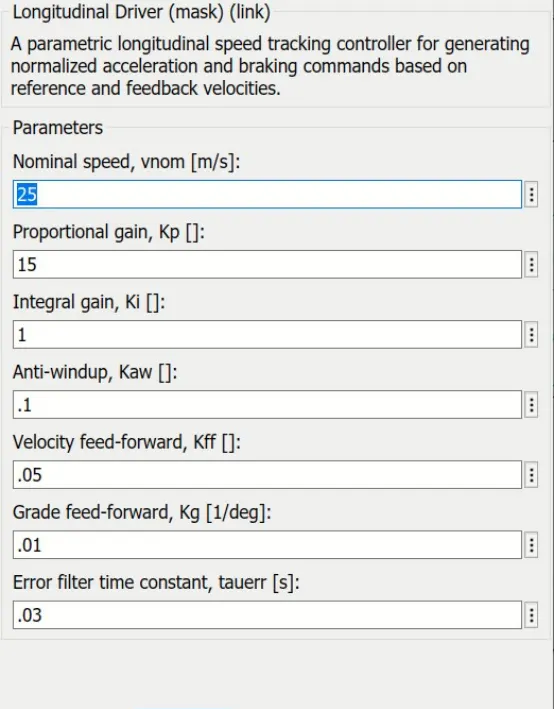
Longitudinal Driver Parameter:
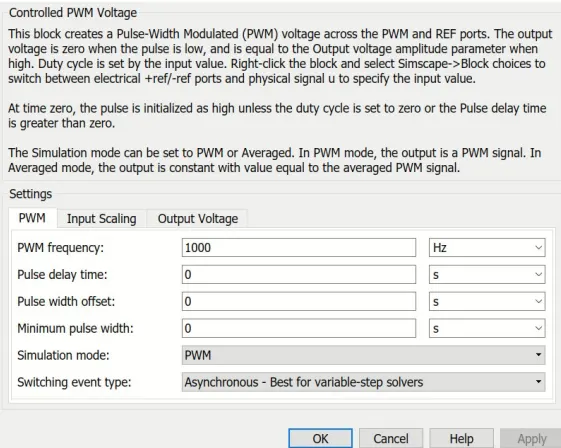
Controlled PWM Voltage:
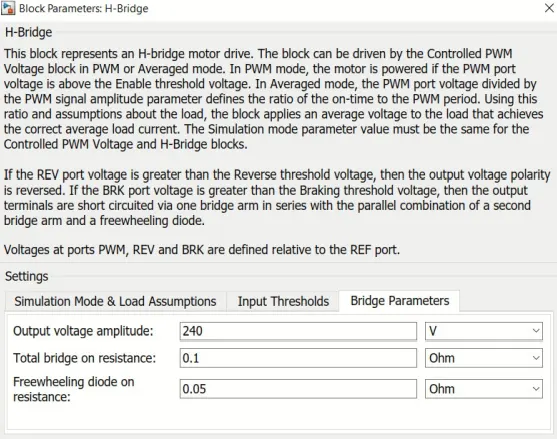
H-Bridge
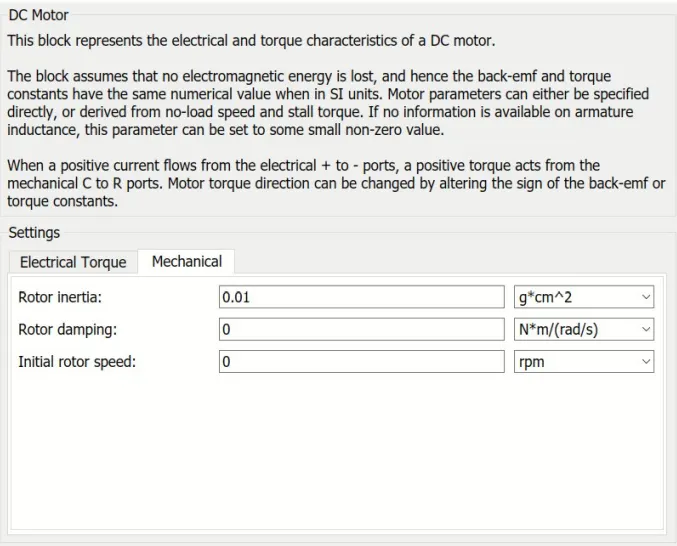
DC Motor:
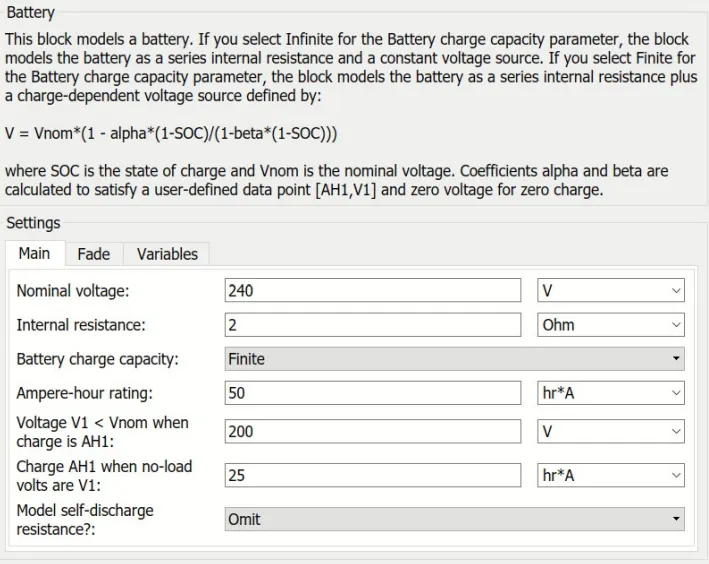
Battery:
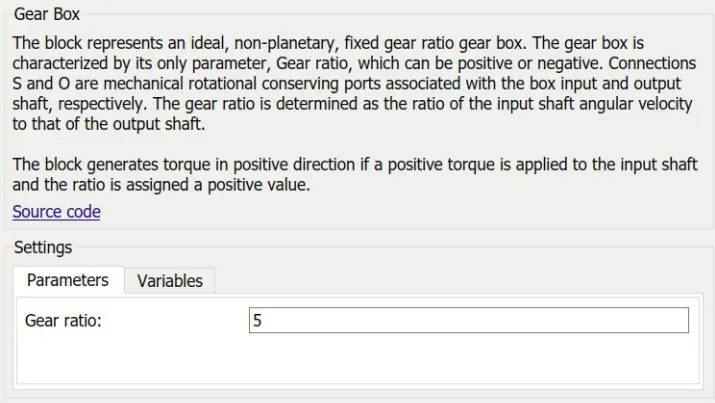
Gear Box:
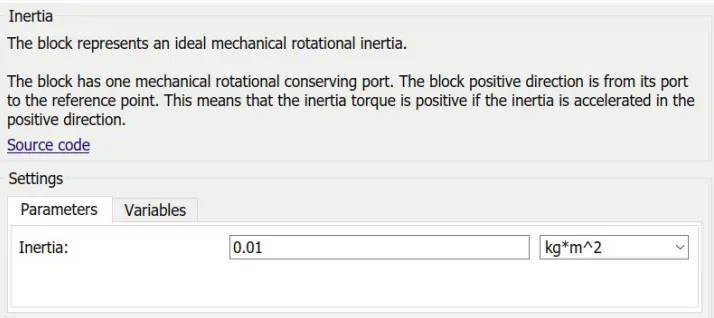
Inertia:
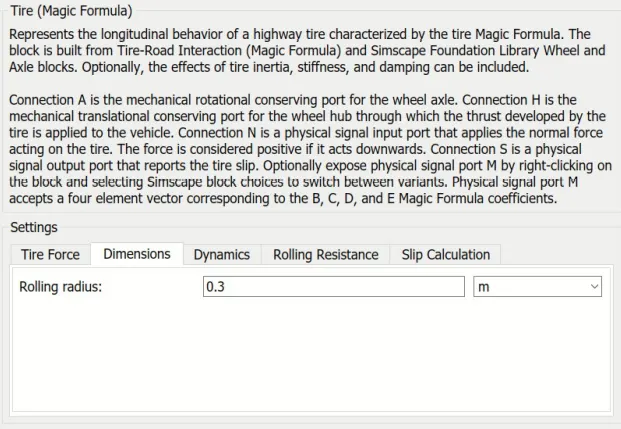
Tire:
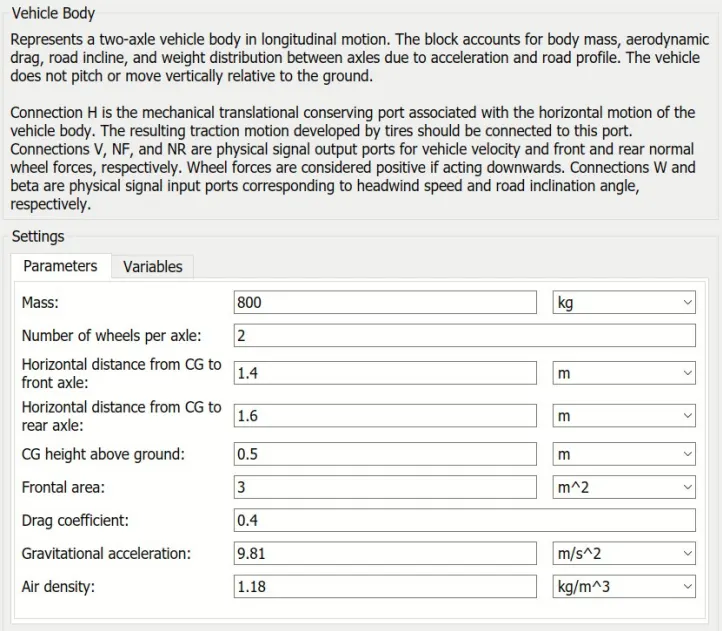
Vehicle Body:
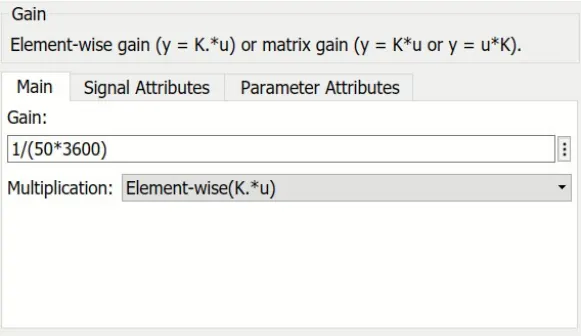
Gain of SOC:
Results:-
Scope
Scope
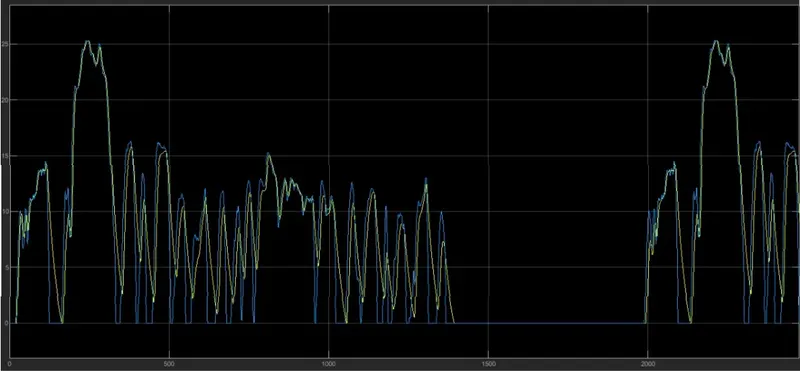
Scope:
Conclusion:
The MATLAB model of an electric car which uses a battery and a DC motor has been successfully made by choosing suitable blocks from Powertrain block
set and following conclusions has been drawn from the results.
From the input vs output velocity graph we can see that the EV model that we designed have traced the FTP 75 drive cycle very closely. Only when the speed
suddenly drops to 0 in the FTP 75 drive cycle , the model takes time to catch up. On all other occasions the model traced the drive cycle closely.
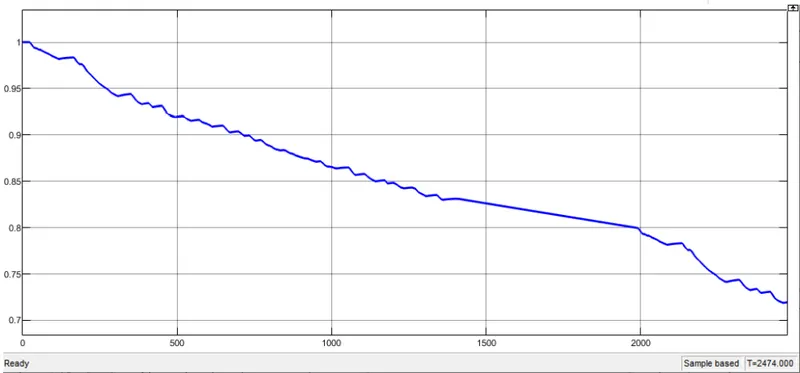
Now looking at the SOC graph we can see that almost 50% of the battery capacity is used for completing this drive cycle. And also we can see sudden spikes in
that graph , these spikes represents the regenerative braking region. During which the SOC value increases.
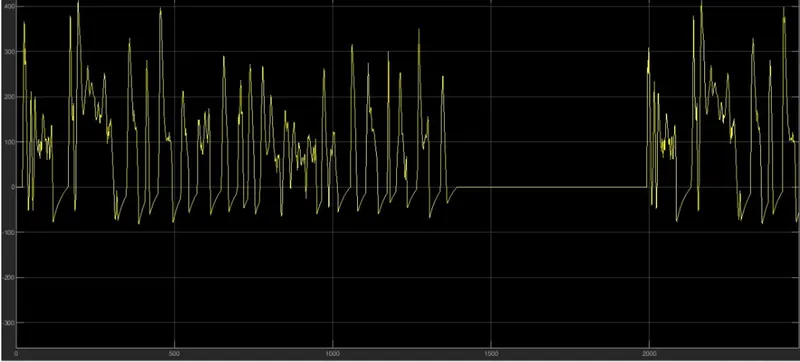
And from the Current variation graph , we can see that the maximum current value during normal driving is around 300A and during regenerative braking the
maximum current value reached is near to 150A.
The distance covered is 20.48 Km which is higher than the drive cycle data. For FTP 75 the total distance is 17.77Km. But still the value is closer to that FTP 75
value , showing that the model is quite accurate in following the drive cycle data.