FINAL INDEPENDENT PROJECT
Using MATLAB to Measure the Diameter of an Object within an Image
Executive Summary
Measuring objects within an image or frame can be an important capability for many applications where computer vision is required instead of making physical measurements. This application note will cover a basic step-by-step algorithm for isolating a desired object and measuring its diameter.
Objective
Through this application note, you will be able to write a MATLAB script file to import an image, segment the image in order to isolate the desired object from its background and then use the MATLAB functions that come with the Image Processing Toolbox to determine the object's diameter.
Introduction
“MATLAB is a high-level language and interactive environment for computer computation, visualization, and programming. Image Processing Toolbox is an application available for use in MATLAB, which provides a comprehensive set of reference-standard algorithms, functions, and apps for image processing, analysis, visualization, and algorithm development.” Using these tools provide a fast and convenient way to process and analyze images without the need for advanced knowledge of a complex coding language.
Hardware
Operating System: Windows XP or better, Mac OS X Lion or better
Processors: Intel or AMD x86 processor
Disk Space: 4 GB or better
RAM: 2048 MB at least recommended
Graphics Card: Hardware accelerated graphics card supporting OpenGL 3.3 with 1 GB GPU
memory recommended.
Software
MATLAB 2020a
Image Processing Toolbox (Downloadable application)
Process
Import Image
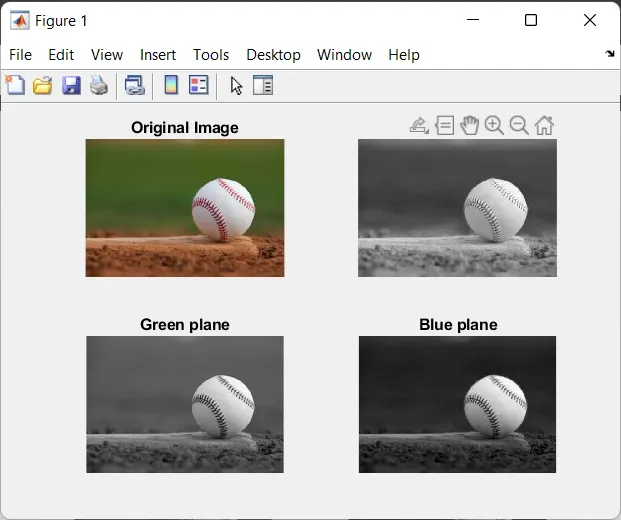
Open the MATLAB software and in the application section; download the Image Processing Tool Box. Create a new MATLAB script file. Refer to code below, begin adding code to import the desired image to measure into the MATLAB workspace. The first few lines clear the workspace to remove any previous variables and clear the command window. It is important that the Current Folder that you are working out of be the folder that contains both the script file and image. The command imread reads an image and converts it into a “3-dimensional” matrix in the RGB color space. The image used in this tutorial is ball.jpg (original image), which is a 534 by 401 pixel image. The imread function converts this into a matrix that is 401x534x3 (Rows x Columns x RGB). The final dimension (RGB) corresponds to a red, green and blue intensity level. Use
imshow to view the produced image in a new window.

original image
Segment Image
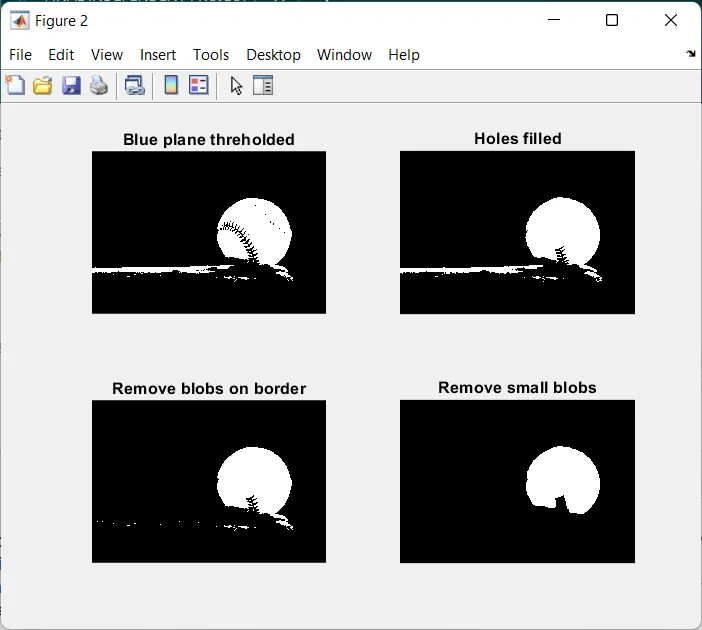
Follow the code below to segment the image into a binary image to differentiate the background from the desired objects. The first step taken is to divide the image into three images based on the intensities of each red, green and blue component within the image. This is Color Based Image Segmentation. You can see from the code that the blue plane is the best choice to use for Image Thresholding because it provides the most contrast between the desired object (foreground) and the background. Image Thresholding takes an intensity image and converts it into a binary image based on the level desired (See line 37). A value between 0 and 1 determines which pixels (based on their value) will be set to a 1 (white) or 0 (black)). To choose the best value suited for your application, right-click on the value and at the top of the menu and select “Increment Value and Run Section”. Set the increment value to 0.01 and choose the best value at which to threshold. Figure 5 shows the result of the Image Thresholding at 0.37. You can see that the image (Holes filled) has been segmented between the object we desire to measure and the background.
Segmentation Continued (Remove Noise)
As you can see from the top-left image (blue plane threhilded) Figure there is quite a bit of “noise” and we need to clean the image up significantly to improve the accuracy of our diameter measurement. Refer to Figures on the procedures taken to clean up the image and provide a more uniform blob to analyze. Blobs in this document are any collection of white pixels that touch to create a cohesive and distinct object.
Measuring Image
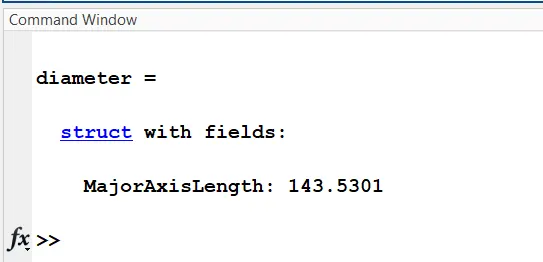
The image in the bottom-right corner of Figure 2 is the result of all image segmentation and cleanup procedures to provide one distinct and cohesive blob, which represents the ball in the original image. Having the original image in a binary form such as this will make it easy for other functions built into MATLAB to quickly analyze the region and a host of different information. The regionprops function is the tool that will provide the MajorAxisLength of the blob in the image. As you can see, by not suppressing line 68 with a semi-colon, the diameter is displayed in the Command Window.
CODE
close all
clear all
clc

%% Import Image
obj = imread('ball1.jpg');
imshow(obj)

%% Segment Image
% divide image "obj" into its respective RGB intensities
red = obj(:,:,1);
green = obj(:,:,2);
blue = obj(:,:,3);

figure(1)

subplot(2,2,1)
imshow(obj)
title('Original Image');

subplot(2,2,2)
imshow(red);
title('Red plane')

subplot(2,2,3)
imshow(green)
title('Green plane')

subplot(2,2,4)
imshow(blue)
title('Blue plane')

% threshold the blue plane %

figure(2)
level = 0.37;
bw2 = im2bw(blue,level);

subplot(2,2,1)
imshow(bw2);
title('Blue plane threholded')

%% Remove noise

% fill any holes
fill = imfill(bw2,'holes');

subplot(2,2,2)
imshow(fill);
title('Holes filled')

% Remove any blobs on the border of the image
clear = imclearborder(fill);

subplot(2,2,3)
imshow(clear);
title('Remove blobs on border')

% Remove blobs that are smaller that 7 pixels across
se = strel('disk',7);
open = imopen(fill,se);

subplot(2,2,4)
imshow(open);
title('Remove small blobs');

%% Measure object diameter
diameter = regionprops(open,'MajorAxisLength')

% Show Results
figure(3)
imshow(obj)
d = imdistline; % include a line to physically measure the ball
Code explanation
- Code is started with the basic commands like clear all, close all and clc.
- Image is imported using 'imread' command and displayed on plot using 'imshow'.
- The image is segmented into RGB colors and all are plotted using the plot command on planes.
- The colored image is converted into a black and white image using the 'im2bw' command.
- The unwanted and irregular are holes and unnecessary noise is removed using the 'imfill' command.
- Blobs on the border on image are removed using the 'imclearborder' command.
- The diameter of the object is measured using the 'regionprops' command.
- Image at each and every step are diplayed using the 'imshow' command.
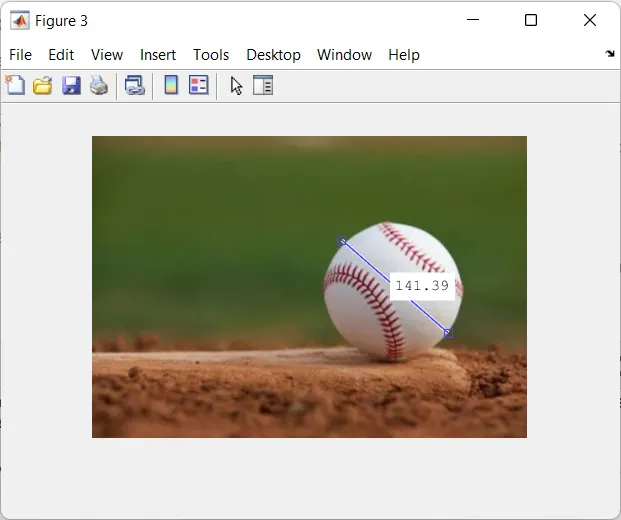
- The measured diameter is compared with the actual diameter by using a measuring line which is displayed on the image using 'imdistline' command.
- The result when compared with the actual one is so close.
- In this way, the image having a object in it is measured using this MATLAB code.
Results
The diameter is now displayed in the Command Window to be approx. 170 pixels across. This was verified in the below Figure by using the imdistline function in line 73. As you can see between the two figures, the value calculated by the code was very close to the manual measurement in below figure.
OUTPUT
Recommendations
There are a multitude of options within the regionprops function that can output other measurements besides the MajorAxisLength. Type Help regionprops in the Command Window to get more information about the function. Help can be used with any function to obtain more information. Provide comments for each section of code as demonstrated. Comments provide a quick explanation of each section of code that helps other users debug and understand the code.
CONCLUSION
The major diameter of the ball in the given in image is found out using MATLAB code and compared with the original diameter of the ball in the image.
ERRORS
Small errors are occurred while coding which are negligible.
References
Image Processing Made Easy. Perf. Andy Thé. Mathworks. N.p., 15 Oct. 2014. Web. 07 Nov. 2014. <http://www.mathworks.com/videos/image-processing-made-easy81718.html>