Exhaust Port Challenge
Aim: The aim of the given challenge is to perform conjugate heat transfer analysis on exhaust port and learn various aspects of CHT analysis.
Objective: To simulate the flow through manifolds and its interaction with the solid.Initially inlet fluid is hot and it wil heat the pipe from inside and also their will be heat transfer coeffcient on external surface.Engine is air cooled in real world applications and air has particular H.T coeffcient.The H.T coeffcient depends upon the reynolds number of external air. we can do external flow simulation by adding enclosure but for given challenge we are peoviding specific h.t coeffcient for outer boundaries.
Why and where CHT anlysis is used?
Conjugate heat transfer corresponds with combination of heat transfer in solids and heat transfer in fluids. In solid conduction often dominates whereas in fluids convection dominates. we have few e.g. heat sinks are optimized to combine heat ransfer by conduction in heat sink with the convection in the surrounding fluid.
Heat Tranfer in solid : The H.T in solids takes place by conduction and is given by fouriers law that defines conductive heat flux q properties to temperature gradient.
Heat Transfer in fluids: 1)The H.T in fluids is convective but depending on the thermal properties of fluid in regime conductive/convective H.T may be dominant.
2)The viscous effect can also contibute to the fluid heating
3) As soon as the fluid density is temperature dependent a pressure work contibutes to heat equation and this accounts for well nown effect that is compressing air produces Heat.
Geometry: we have been provided with a geometry and we need to prepare it for simulation using spaceclaim.we consider only the volume under consideration and to do so we select volume extract option and preapare the geometry. Before going to meshing we have to make sure that the fluid and the solid in geometry shares perfect topology in order to obtain a conformal mesh which makes sure that their is proper H.T between the fluid and the solid. In order to do so we use share topology option and delete the empty volume. now we only consider the volume of flow and solid structure of the geometry.
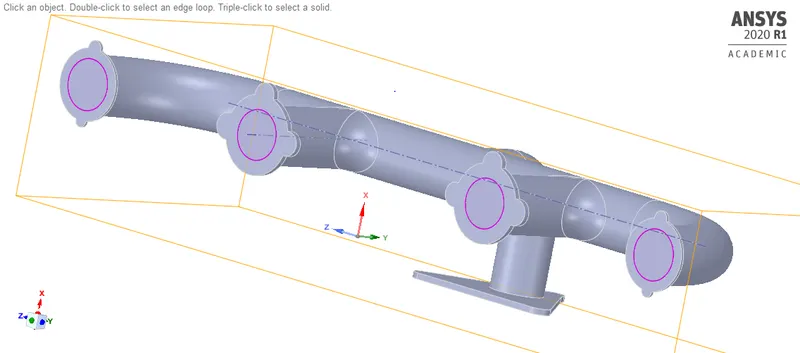
Fluid Volume:
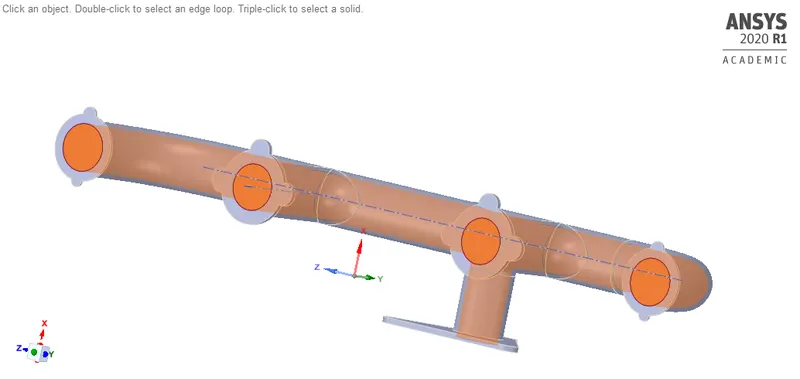
Solid Volume:
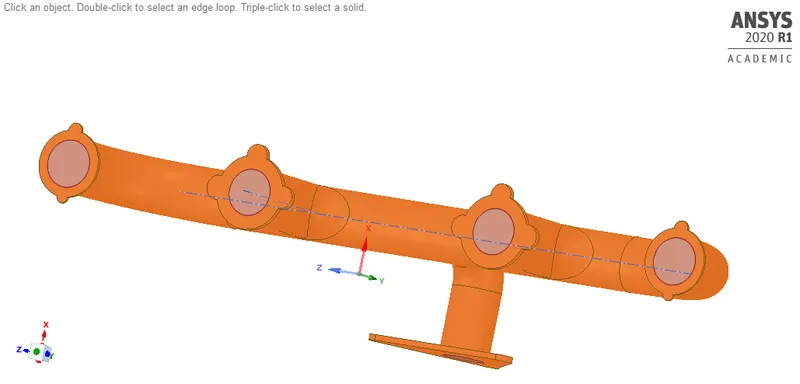
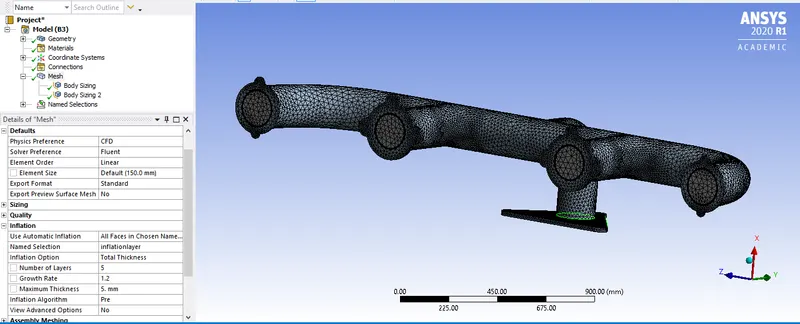
Meshing: we initially generate a baseline mesh for the geometry. we provide geometry with 10 layers of local inflation with first layer thickness of 0.067 mm and growth rate of 1.2. the first layer wall thickness ois calculated using y plus value.the elment size for our inner fluid mesh is 150mm and we also provide a meshing with element size of 10 mm for outer solid surface usinf insert mesh size option.
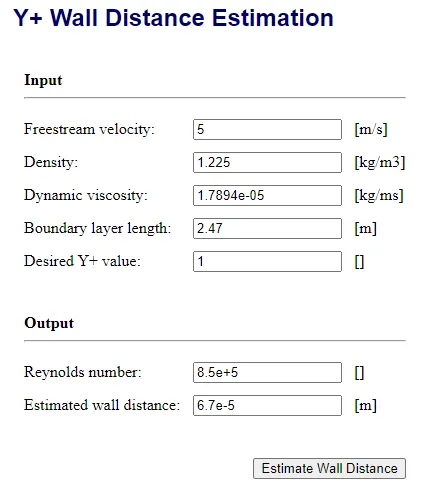
Solution setup:
For the solution purpose we use staedy state pressure based solver for analysis.
enery equation is turned on and we use K-omega sst turbulance model.
Material: for fluid-standard material AIR is applied
for solid- Aluminium
Boundary conditions:
Inlet-velocity=5m/s, temperature=700k
Outer Wall=convection heat transfer with Heat transfer coeffcient=20w/m2k
Free stream temperature=300k
Outlet=pressure outlet.
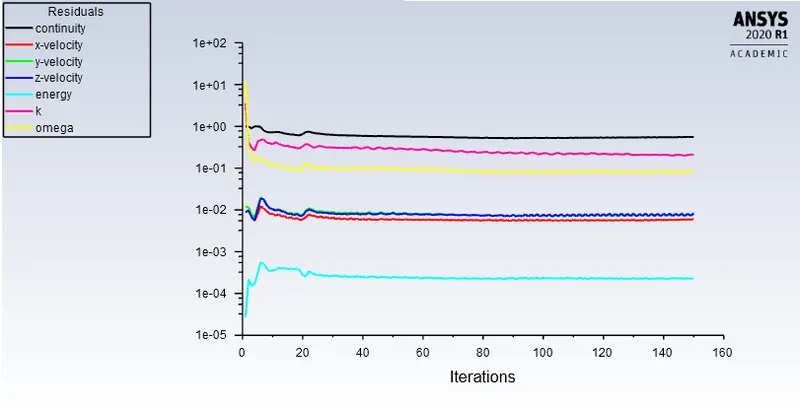
hybrid initialization is done with 150 number of iterations.
Residual plot:
Temperature contour plot:
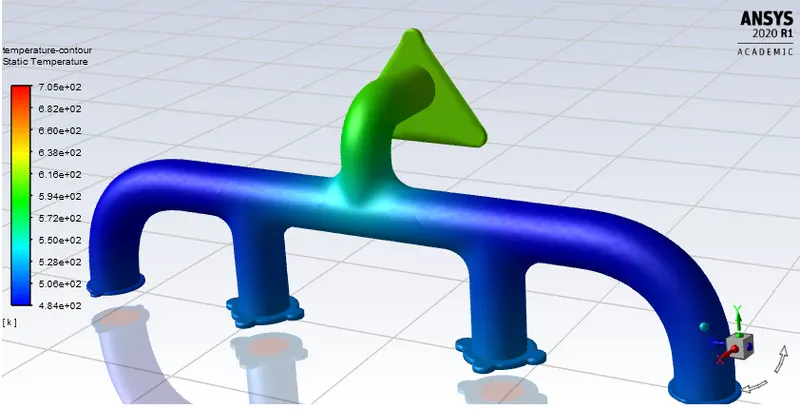
The temperature contour plot gives following results
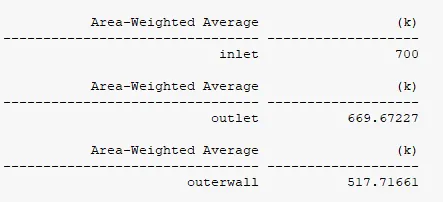
We can see that temperature at the outer wall is much lower than the temperature at the outlet where the flow converges. to learn more about it we can go to cfd post to verify the result.
Maintaing Y plus value in range:
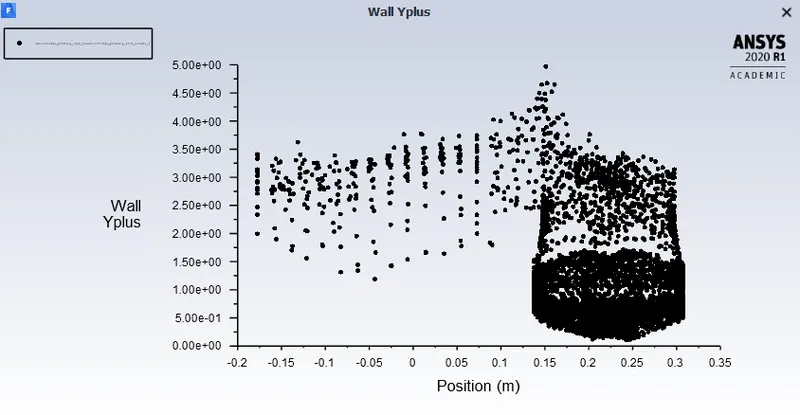
The y plus value is near about 5 which is maximum and we have used k omega SST turbulance model for the solution and y plus value for k omega model is range 1 to 5.
The heat transfer coeffcient on walls of internal solid surface is 1159.5663 w/m2-k

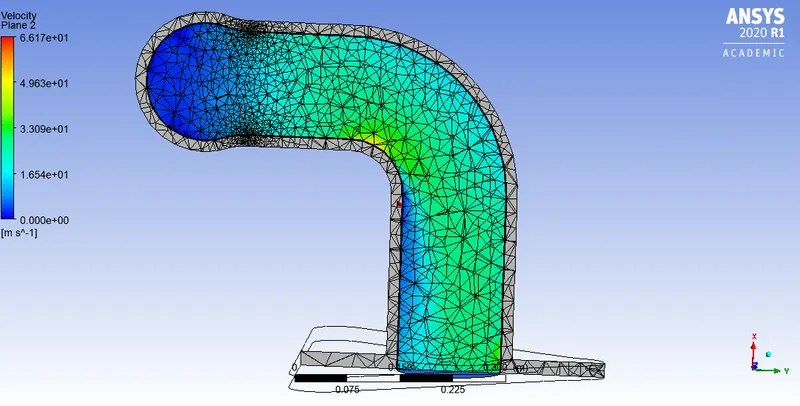
Velocity Contour at outlet :
Velocity streamline flow plot:
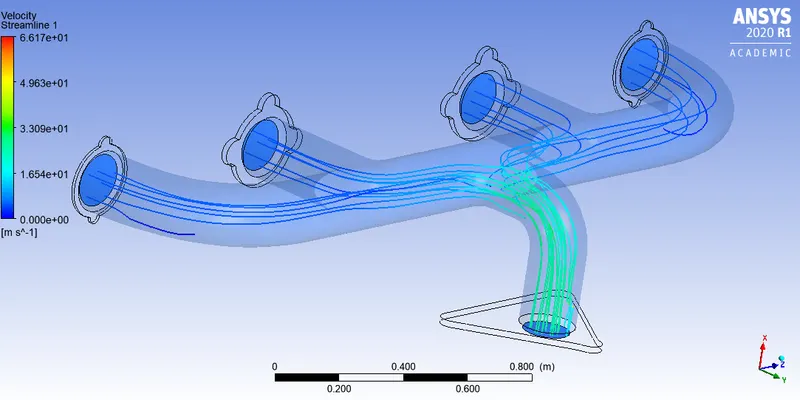
The velocity plots above shows that the velocity is lower at the starting of inlet port as we have 4 inlet port and only 1 outlet port so by the relation of flow rate velocity at the outlet is going to be high.with higher velocity we have higher reynolds number which means we have higher heat transfer queffcient in outlet port region. the high H.T rate between the fluid and the solid results in higher temperature in outlet region of exhaust port.The below plots for temperature and heat transfer coeffcient are shown in appropriate outlet region of exhaust port.
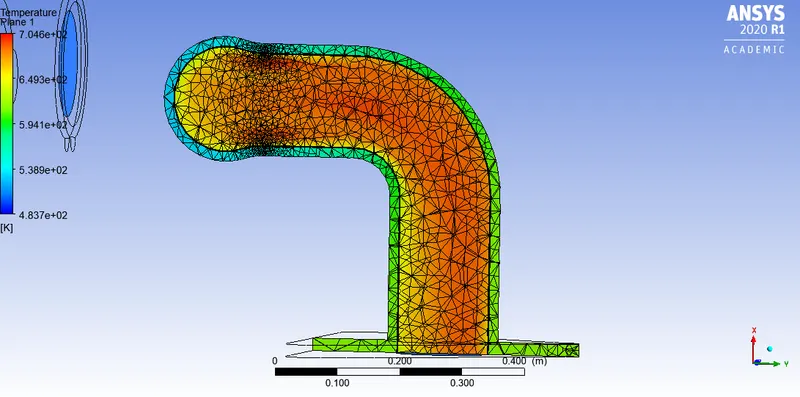
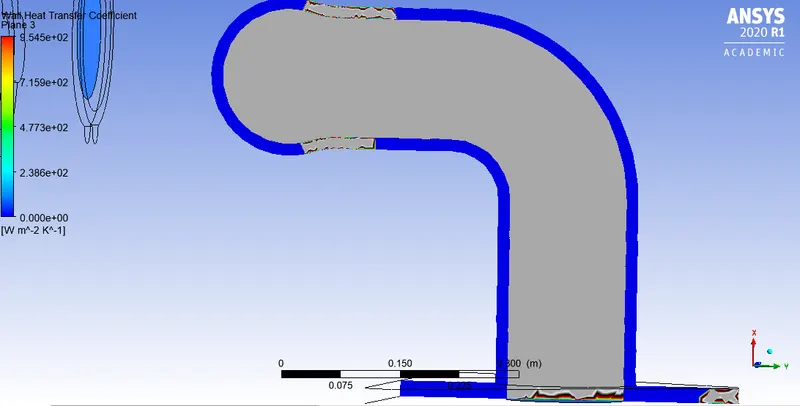
Verification of the predicted Heat tarnsfer coeffcient:
The experimental analysis shows that the velocity streamline at the exhaust port is maximum with higher velocity we have higher Reynolds number asscociate with it.The heat transfer coeffcient is directly propotional to Reynolds number hence we see that the heat transfer coeffcient is higher in outlet of exhaust port which verifies that our prediction obtained from simulation is correct.
The Heat transfer coeffcient and other experimental data depends on following factors for their accuracy:
1.Refinement of the mesh
2.Number of inflation layers and first layer thickness
3.Verification of Y plus value for turbulance model