Drag Force acting against a Cyclist Calculation using MATLAB Scripting
AIM:
- To calculate the drag force acting against a cyclist.
- To display the variation of Drag force with Drag coefficient via a plot.
- To display the variation of Drag force with velocity via a plot.
GOVERNING EQUATIONS & RELEVANT THEORY:
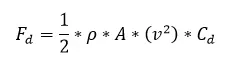
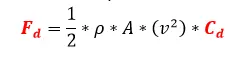
- The drag force acting against the body(cycle & the cyclist) is given by:
- Fd ->Drag Force
- ρ -> Density of air.
- A -> Frontal area of the body(cycle & the cyclist).
- v -> Upstream/Approach velocity of air/wind.
- Cd -> Drag Coefficient of the body(cycle & the cyclist)
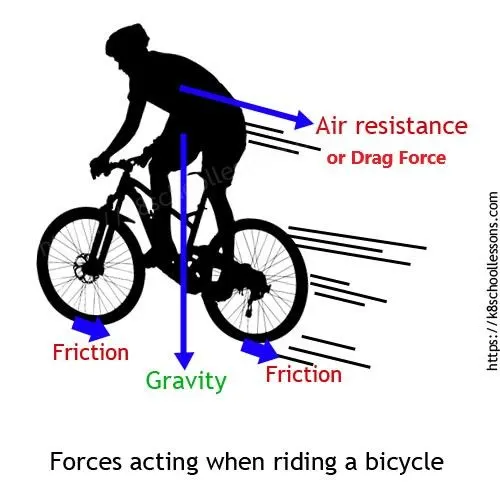
- Free Body Diagram of a various forces acting against a cyclist:
Definitions of the terminologies used in the above equation:
- Drag force (Fd): The force that a flowing fluid exerts on a body in the flow direction is called the drag force. Its SI unit is N or [(kilogram*metre)/(second)^2].
- Density (ρ): Density of a body is defined as the amount of mass, a body has, per unit volume of the body. Its SI unit is kilogram/(metre^3).
- Frontal area (A): It is the area projected on a plane normal to the direction of flow of the body. In other words, A is the area seen by a person looking at the body from the direction of the approaching fluid. For example: The frontal area of a cylinder of diameter D and length L, for example, is A =LD.Its SI unit is (metre^2).
- Upstream Velocity (v): It is the velocity of approaching fluid, far ahead of the body. Its SI unit is (metre/second).
- Drag coefficient (Cd): In fluid dynamics, Drag coefficient is a dimensionless quantity that is used to quantify the drag or resistance of an object in a fluid environment, such as air or water. It is used in the drag equation in which a lower drag coefficient indicates the object will have less aerodynamic or hydrodynamic drag.
- Mathematically, the coefficient of drag is given by:
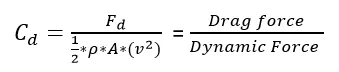
Assumption for the above equation to be true: The wind flow is steady and incompressible.
- But in general Drag coefficient for a body is experimentally derived by taking many parameters into account like Body shape, Reynold’s number, surface roughness of the body, etc.
4. When two solid bodies in contact move relative to each other, a friction force develops at the contact surface in the direction opposite to motion. To move a table on the floor, for example, we have to apply a force to the table in the horizontal direction large enough to overcome the friction force. The magnitude of the force needed to move the table depends on the friction coefficient between the table legs and the floor.
5. The situation is similar when a fluid moves relative to a solid or when two fluids move relative to each other. We move with relative ease in air, but not so in water. Moving in oil would be even more difficult, as can be observed by the slower downward motion of a glass ball dropped in a tube filled with oil. It appears that there is a property that represents the internal resistance of a fluid to motion or the “fluidity”, and that property is the viscosity. The force a flowing fluid exerts on a body in the flow direction is called the drag force, and the magnitude of this force depends, in part, on viscosity.
6. According to the question, the factors involved in calculating the drag force acting against the cyclist are:
- Velocity
- Drag coefficient
- Frontal Area
- Density of air
7. There are also other factors involved that influence the drag force but if we consider the flowing fluid(air/wind) to be steady and incompressible then only the above mentioned factors influence the drag force acting against the cyclist.
OBJECTIVES OF THE PROJECT:
- The main objective of the project is to calculate the drag force acting against a cyclist using the following relation using MATLAB.
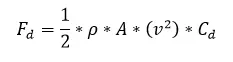
- ρ -> Density of air.
- Fd ->Drag Force
- A -> Frontal area of the body(cycle & the cyclist).
- v -> Upstream/Approach velocity of air/wind.
- Cd -> Drag Coefficient of the body(cycle & the cyclist)
- Using MATLAB, a program will also be written to:
- Calculate Drag Force acting against a cyclist.
- Plot Velocity vs Drag Force.
- Plot Drag coefficient vs Drag Force.
- In MATLAB, the programmer will specify the inputs of the parameters that affect the Drag force and using the above mentioned relation, calculate the Drag force.
- Using the inputs given by the programmer for the above specified parameters, a graph will be plotted between:
- Drag Force vs Velocity.
- Drag Force vs Drag Coeffcient.
- The Command window will generally be used for displaying the inputs given to the variables and the resultant output(s) and accessing the syntax from the code written in the Editor window.
- The syntax can also be written in the Command window but the content inside the Command window cannot be saved and will vanish once MATLAB is closed.
- For this particular project, I wrote the syntax of the problem in the Editor window and used the Command window only for displaying the inputs given to the variables and the resultant output.
- For the same frontal area, the values of Drag coefficients that will be taken up in my code are as follows:
|
Sl. No. |
Shape |
Drag coefficient |
|
1. |
Air foil |
0.045 |
|
2. |
Prism |
0.285 |
|
3. |
Bullet |
0.295 |
|
4. |
Sphere |
1.14 |
|
5. |
Flat Plate |
1.28 |
Source: https://www.grc.nasa.gov/www/k-12/airplane/shaped.html
BODY OF THE CONTENT:
- Programming Language used: MATLAB.
- Attached below is my code for taking input of the parameters that affect the Drag force (acting against the cyclist) and calculating the drag force.
clear        %(clears the previous variables and their intialised values if any.)
close all    %(closes all the output windows of MATLAB if any.)
clc          %(clears all the syntax and code previously written if any.)

u=symunit;  %(Command to return unit collection in order to load units for the the following variables)

for i=1:2       %(Command to run the contents inside this for loop 2 times)

    C_d=[0.045 0.285 0.295 1.14 1.28];   %(Initialised a variable 'C_d' with 5 values in the form of row matrix)
    A=0.1*u.m^2;                         %(Initialised a variable 'A' with a value of 0.1 m^2)
    rho=1.2*u.kg/u.m^3;                  %(Initialised a variable 'rho' with a value of 1.2 kg/m^3)
    v=[1 2 3 4 5]*u.m/u.s;               %(Initialised a variable 'v' with a (1 X 5) row matrix with each value having a unit of m/s)
    [vNum,vUnits]=separateUnits(v);      %(Command to seperate symbolic numeric values from the units in order to get an output in the form of 'double')
    vNum=double(vNum);                   %(Command to convert symbolic numeric output to double)

    if i==1   %(Command to ensure that that the content within this if statement is executed when the loop runs for the 1st time.) )

        %Finding Drag force values for one particular value of Drag coefficient(C_d):

        C_d=C_d(i+2);                                %Initialised the value of C_d to a new value of C_d(i+2))
        disp('The Force values(with units) for Drag Coefficient(C_d)=0.295 is:')   %Command to display the text given within ()
        F=0.5*rho*A*(C_d*v.^2)                      %(Assigning a variable 'F' which will find the value of (0.5*rho*A*C_d*v.^2) using the above mentioned intialised values)
        [FNum,FUnits] = separateUnits(F);            %(Seperating the units from numeric values using command seperateUnits)
        disp('The Force values(without units) for Drag coeffcient(C_d)=0.295 is:')  %Command to display the text given within ()
        FNum=double(FNum)                            %(Command to convert the numeric values which were symbolic in nature to double)

        %Plotting Velocity-Drag Force:

        plot(vNum,FNum)                              %(Command to plot a graph where the x-axis will be occupied by vNum(velocity row vector) and y-axis will be occupied by FNum(Force row vector))
        xlabel('Velocity/Speed of wind(v)')          %(Command to label the x-axis as Velocity/Speed of sound(v))
        ylabel('Drag Force(F)')                      %(Command to label the y-axis a Force(F))
        grid on                                      %(Command to put grid lines on the plot)

    else              %(Command to ensure that the content within this else statement is executed when the loop runs for the 2nd time.)

        %Finding Drag force values for one particular value of velocity(v):

        figure;                                      %(Command to ensure that 2 seperate plots come out as ouput instead of the one that is executed last)
        v=v(i+1);                                    %(Initialised the value of v to a new value of v(i+1).)
        disp('The Force values(with units) for a velocity(v)=3 m/s is:')   %Command to display the text given within ()
        F=0.5*rho*A*(C_d*v.^2)                      %(Assigning a variable 'F' which will find the value of (0.5*rho*A*C_d*v.^2) using the above mentioned intialised values)
        [FNum,FUnits] = separateUnits(F);            %(Seperating the units from numeric values using command seperateUnits)
        disp('The Force values(without units) for Drag coeffcient(C_d)=0.295 is:')  %Command to display the text given within ()
        FNum=double(FNum)                            %(Command to convert the numeric values which were symbolic in nature to double)

        %Plotting Drag Coefficient-Drag force:

        plot(C_d,FNum)                               %(Command to plot a graph where the x-axis will be occupied by C_d(Drag coefficient) and y-axis will be occupied by FNum(Force row vector))
        xlabel('Drag Coefficient(C_{d})')            %(Command to label the x-axis as Drag Coefficient(C_d))
        ylabel('Drag Force(F)')                      %(Command to label the y-axis a Force(F))
        grid on                                      %(Command to put grid lines on the plot)

    end    %(Command to signal end of content to be taken for if/else statements.)

end        %(Command to signal end of content to be taken for 'for' loop statement.)
The above code has been written in the Editor window of MATLAB.
- In MATLAB, anything written at a particular line starting with the special character '%' are comments for this programming language. The compiler skips anything that starts with '%' in a line while compiling and running the code.
- For the above case, I have used comments beside the code in each and every line to explain the functionality of that particular code.
- In the above code, I have initialised four variables: ‘C_d’, ’rho’, ’A’ and ‘v’ with integer values.
- I have initialised all the variables with their values and units within a for loop.
- In my MATLAB code, variable ‘C_d’ represents Cd (Drag Coefficient) of the main equation.
- In my MATLAB code, variable ‘rho’ represents ρ (Density of the wind) of the main equation.
- In the MATLAB code, variable ‘A’ represents A (Frontal area) of the main equation.
- In my MATLAB code, variable ‘v’ represents v (Upstream/Approach velocity of the air/wind) of the main equation.
- I have initialised variable ‘v’ with 5 integer values which are in the form of a row matrix.
- I have also initialised variable ‘C_d’ with 5 integer values which are in the form of a row matrix.
- The code for writing a single row matrix -> All the elements of the single row are enclosed within square brackets and each element in a row is distinguished from the other by a space.
- I have used for loop because:
- According to the question, I have to plot a graph depicting change of Drag Force with change in velocity keeping all the other parameters (Drag Coefficient, Density, Frontal area) constant.
- According to the question, I have to plot a graph depicting change of Drag Force with change in Drag Coefficient keeping all the other parameters (velocity, density, frontal area) constant.
- But I wanted to make my initialisations at the first place itself and not change them according to various cases (2 plots where in 1 plot I have to take a single value of Drag coefficient from 5 values of Drag coefficient and in another plot where I have to take a single value of velocity from 5 values of velocity.)
- Therefore within the if statement under the for loop, I have put a case for finding out the Drag Force values using the relation F=0.5*rho*A*C_d*v.^2 taking only one value of C_d from 5 values of C_d and then plotting the graph for Drag Force against velocity values.
- In the if statement I have put a command to take the median value of C_d(When i=1,the loop is run for the 1st time and checks the condition for i=1 in the if/else statements. When it sees that i=1,then under the the if statement I have initialised C_d to take the 3rd value of C_d using the command C_d=C_d(i+2) which indicates that C_d will take the value of C_d(1+2)=C_d(3)=0.295).
- When the loop is run for the 1st time, the content within the if statement will be executed only as evident from my declaration of a variable i against the for.
- Within the else statement under the for loop, I Have put a case for finding out the Drag force values using the relation F=0.5*rho*A*C_d*v.^2 taking only one value of v from 5 values of v and then plotting the graph for Drag Force against Drag Coefficient values.
- In the else statement I have put a command to take the median value of v(When i=2,the loop is run for the 2nd time and checks the condition for i=2 in the if/else statements. When it sees that i≠1 means i=2,then under the else statement I have initialised v to take the 3rd value of v using the command v=v(i+1) which indicates that v will take the value of v(2+1)=v(3)=3).
- I have initialised all the variables within the for loop because when I allot a particular value of variable as per a particular case (ex. C_d=0.295 for plotting Drag Force and velocity curve),then the value of C_d gets overwritten, then the new value of C_d becomes 0.295 permanently until I initialise it with a different value again.
- When the 1st loop is run, and the loop goes through the initialisations written first and then goes to the content within the if statement where the value of C_d is overwritten as 0.295 and then the subsequent commands within the if statement are executed.
- When the 1st loop is executed and the loop is run for the 2nd time then it again goes through all the initialisations where the value of C_d again gets overwritten from C_d=0.295 to C_d=[0.045 0.285 0.295 1.14 1.28] and then goes to the content within the else statement where now the value of v gets overwritten from v=[1 2 3 4 5] to v=3 and then subsequent commands within the else statement are executed.
- I have also assigned another variable 'F' and initialised to give the value of (0.5*rho*A*(C_d*v.^2)) within both if and else statements.
- In the above expression each variable have their respective meanings as mentioned above.
- In the above expression, only ‘*’ means simple multiplication between the variables.
- In the above expression, ‘.^’ represents Element-wise power.
- To demonstrate element-wise power operation, for example let C = A.^B.
- C=A.^B raises each element of A to the corresponding powers in B. The sizes of A and B must be the same or be compatible.
- If the sizes of A and B are compatible, then the two arrays implicitly expand to match each other. For example, if one of A or B is a scalar, then the scalar is combined with each element of the other array. Also, vectors with different orientations (one row vector and one column vector) implicitly expand to form a matrix.
- For example in (^2),the first element of v will be multiplied to the 1st element of v(i.e. multiplied to itself),the 2nd element of v will be multiplied to the 2nd element of v(i.e. multiplied to itself) and so on.
- In the above code I have initialised variables with integer values along with their units.
- The command u=symunit in the above code returns the unit collection.
- Before specifying units, we need to load units by using the command ‘symunit’. Then, we specify a unit by using dot notation while initialising a variable.
- For example while initialising a variable ‘rho’ in the above code along with unit of m^3/kg, the code written for it is:
- rho=1.2*u.kg/u.m^3;
- ‘1.2’ is the numerical value part of the initialisation.
- ‘u.kg/u.m^3’ is the ‘units’ part of initialisation.
- ‘u.kg/u.m^3’ is the code for initialising the unit kg/m^3 to the variable ‘rho’.
- After initialising and running the above code in the Editor Window and typing rho in the command window, we’ll get the following output:
*Insert output Attachment*
 rho

rho =

(6/5)*([kg]/[m]^3)- After running the code mentioned in point 3) ,the values of 'F'(not FNum) in output on execution of both if and else statement in the command window,comes out as follows:
The Force values(with units) for Drag Coefficient(C_d)=0.295 is:

F =

[(177/10000)*((1*[kg]*[m])/[s]^2), (177/2500)*((1*[kg]*[m])/[s]^2), (1593/10000)*((1*[kg]*[m])/[s]^2), (177/625)*((1*[kg]*[m])/[s]^2), (177/400)*((1*[kg]*[m])/[s]^2)]


The Force values(with units) for a velocity(v)=3 m/s is:

F =

[(27/625)*((1*[kg]*[m])/[s]^2), (171/625)*((1*[kg]*[m])/[s]^2), (177/625)*((1*[kg]*[m])/[s]^2), (684/625)*((1*[kg]*[m])/[s]^2), (768/625)*((1*[kg]*[m])/[s]^2)]
From the above output, the following can be concluded:
- Since I initialised the variable v with an array (row matrix) of 5 integer values, within the if statement, I got the output for value of variable ‘F’ as a row matrix of 5 integer values.
- ‘symunit’ and the above code for initialising values and units to variables ensures that when we perform standard operations/calculations between variables(numeric values and units),the resultant output displays that value and the unit which comes when the same standard operations/calculations are done with values and units using pen and paper.
- For example, the unit of variable ‘F’ according to the units of the variables initialised and the main equation should be:
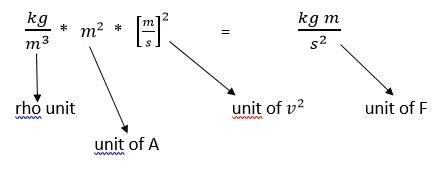
- For if statement v2 is an array (row matrix) and all other values are scalars therefore the value of (0.5*rho*A*(C_d*v.^2)) will involve elementwise multiplication of the scalars into each value of the row matrix(formed by (v.^2)) and the resultant output is a row matrix of order (1 X 5).
- Similarly for else statement C_d is an array (row matrix) and all other values are scalars therefore the value of (0.5*rho*A*(C_d*v.^2)) will involve elementwise multiplication of the scalars into each value of the row matrix(formed by (C_d)) and the resultant output is a row matrix of order (1 X 5).
- The values obtained in the output are symbolic. We may prefer a double output or require double output for a MATLAB® function that does not accept symbolic values. We can convert to double by separating the numeric value using the command separateUnits and then using double.
- In the above code we have used the command ‘separateUnits’ to separate the numeric values(symbolic form) from their units.
- FNum will contain the numeric values(still in symbolic form) of the variable F and FUnits will contain the units of the variable F.
- Finally after separating the units from the numeric values I am using the command ‘double’ to convert the symbolic form of numeric values to it’s double form.
- The output of 'FNum'(not F) in the command window:
The Force values(without units) for Drag coeffcient(C_d)=0.295 is:

FNum =

    0.0177    0.0708    0.1593    0.2832    0.4425

The Force values(without units) for velocity(v)=3 m/s is:

FNum =

0.0432 0.2736 0.2832 1.0944 1.2288- MATLAB Program to plot Velocity vs Drag Force:
- For plotting a function between two variables, I will use the plot command.
- For plotting a graph between Drag Force and Velocity,the commands within the if statement need to be executed which gets done when the for loop runs for the first time.
- For plotting Drag Force against velocity, all other parameters need to be kept constant. Therefore we’ll have to use 1 particular value of C_d.(Refer point e) under the subheading BODY OF THE CONTENT)
- plot is one such MATLAB® function that doesn’t accept values in symbolic form. If the code for plotting a function is executed without converting the symbolic values to it’s double form we’ll get an error message like this:
Error using plot
Data must be numeric, datetime, duration or an array convertible to double.

Error in DragForce (line 26)
        plot(v,F)                              %(Command to plot a graph where the x-axis will be occupied by
        vNum(velocity row vector) and y-axis will be occupied by FNum(Force row vector))
- Therefore here also we will use the command separateUnits to separate the numeric values(in symbolic form) of variable ‘v’ from the units(also in symbolic form) associated with each numeric value of variable ‘v’.
- vNum will contain the numeric values(still in symbolic form) of the variable v and vUnits will contain the units of the variable v.
- After passing the command to separate the numeric values from units,I am using the command ‘double’ to convert the symbolic form of numeric values to its double form where the new values of vNum will be of double form instead of symbolic form.
- After converting the values of ‘v’ to double form and which has been initialised to vNum, we can now use the plot command to plot the graph between vNum(velocity values in double form) and FNum(Drag Force values in double form).
- plot command in MATLAB is of the form plot(X,Y). This creates a 2-D line plot of the data in Y versus the corresponding values in X.
- In my code, the data in Y represents values of variable F(Drag force values) and data in X represents values of variable v(velocity values).
- The command xlabel is used to label the x-axis of the plot. It is of the form xlabel(txt) where txt is the label that we want to give to the x-axis of the plot.
- In my code I’ve labelled the x-axis as Velocity/Speed of wind(v).
- The command ylabel is used to label the y-axis of the plot. It is of the form ylabel(txt) where txt is the label that we want to give to the y-axis of the plot.
- In my code I’ve labelled the y-axis as Drag Force(F).
- The command grid on is used to provide grid lines on the body of the plot.
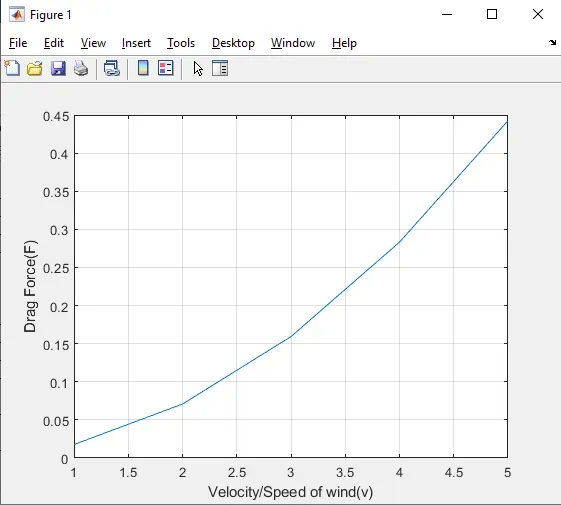
- On execution of the code, the value of F and FNum appears in the form of row matrix the Command window as before and additionally a figure box appears where the plot between Velocity/Speed of wind(v) and Drag Force(F)
- My Plot for Drag force(F) vs Velocity/Speed of Wind(v):
- MATLAB program to plot Drag-coefficient vs Drag force:
- This will be executed when the loop runs for the 2nd time and goes to the content within the end statement.
- Again for plotting a function between two variables, I will use the plot command.
- For plotting Drag Force against Drag coefficient, all other parameters(velocity, Frontal area,Density of air) has to be constant. Hence for this plot a single value of velocity needs to be taken.
- plot command in MATLAB is of the form plot(X,Y). This creates a 2-D line plot of the data in Y versus the corresponding values in X.
- In my code, the data in Y represents values of variable F(Drag force values) and data in X represents values of variable C_d(Drag Coefficient values).
- The command xlabel is used to label the x-axis of the plot. It is of the form xlabel(txt) where txt is the label that we want to give to the x-axis of the plot.
- In my code I’ve labelled the x-axis as Drag Coefficient(Cd).
- In order to label a text on a plot which includes a subscript(as in Cd) in MATLAB, we need to use modifiers.
- For writing any text in subscript in the plot, we need to use _{ }
- For example to label Cd in the plot, I wrote in MATLAB as:
C_{d}
- The command ylabel is used to label the y-axis of the plot. It is of the form ylabel(txt) where txt is the label that we want to give to the y-axis of the plot.
- In my code I’ve labelled the y-axis as Drag Force(F).
- The command grid on is used to provide grid lines on the body of the plot.
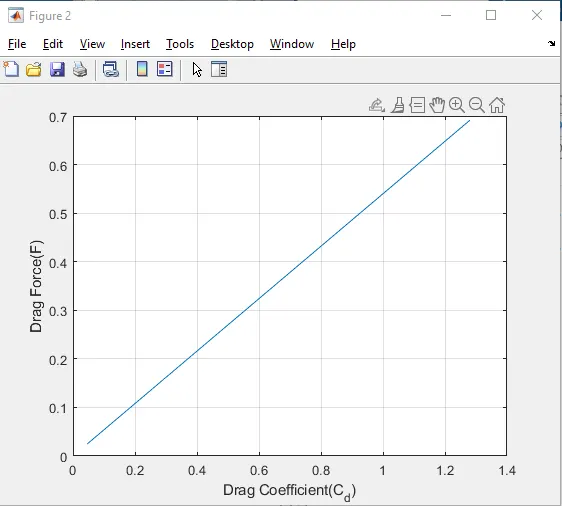
- On execution of the code, the values of F and FNum for both cases appears in the form of row matrix in the Command window as before and additionally a figure box appears where the plot between Drag coefficient(v) and Drag Force(F)
- But the previous figure box depicting the plot of Velocity of air/wind(v) vs Drag force doesn’t appear now.
- To get 2 separate figure boxes, the command figure is used.
- I have written the figure command between the commands for plotting Velocity(v)-Drag Force plot(F) and Drag coefficient(Cd)-Drag Force(F)
- On execution now, the values of F and FNum for 2 seperate cases will be displayed in the form of a row matrix and 2 separate figure boxes named Figure 1 and Figure 2 will open where the plots will be shown.
- My Plot for Drag Coefficient vs Drag Force:
CONCLUSION:
- Yesterday’s engineer spent a major portion of his or her time substituting values into the formulas and obtaining numerical results. However, formula manipulations and number crunching are now being left mainly to computers. Tomorrow’s engineer will need a clear understanding and a firm grasp of the basic principles so that he or she can understand even the most complex problems, formulate them, and interpret the results.
- From the analysis of the plots, the following can be said about each plot:
- Plot 1: Drag Force vs Velocity Plot:
- The plot is roughly parabolic in nature.
- The curve seems to be symmetric about the y-axis which represents the Drag force and also seems to pass through the origin(0,0).
- Plot 1: Drag Force vs Velocity Plot:
- Therefore we can conclude that:

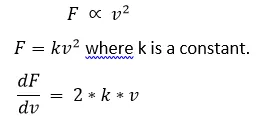
i.e. Drag Force  (Upstream Velocity of wind)2 which is also evident from the main equation:
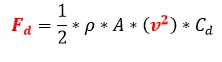
- This relation also indicates that for a Drag Coeffcient of 0.295, for every point on the curve, Drag Force increases by factor of 2*(value of velocity at that point)*k w.r.t. it’s corresponding increase in velocity.
- Plot 2: Drag Force vs Drag Coefficient:
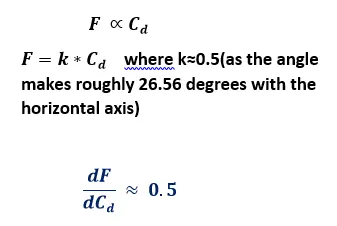
- The plot shows a straight line at an angle roughly 26.56 degrees w.r.t. Drag coefficient axis(horizontal axis).
- Therefore we can conclude that:
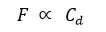
i.e. Drag Force Drag Coefficient which is also evident from the main equation:
- This relation also indicates that,for a velocity of 3 metres/second, for every point on the curve, Drag Force increases by a factor of almost 0.5 w.r.t. its corresponding increase in Drag coefficient:
REFERENCES:
- https://in.mathworks.com/help/symbolic/units-of-measurement-tutorial.html?s_cid=ans2doc_man_link
- https://in.mathworks.com/help/matlab/creating_plots/greek-letters-and-special-characters-in-graph-text.html
- https://in.mathworks.com/help/matlab/matlab_prog/matlab-operators-and-special-characters.html
- https://www.mathworks.com/help/symbolic/symunit.html
- https://www.grc.nasa.gov/www/k-12/airplane/shaped.html
- https://www.mathworks.com/help/matlab/ref/plot.html
- Fluid Mechanics: Fundamentals & Applications, Fourth Edition by Yunus A. Cengel and John M. Cimbala.