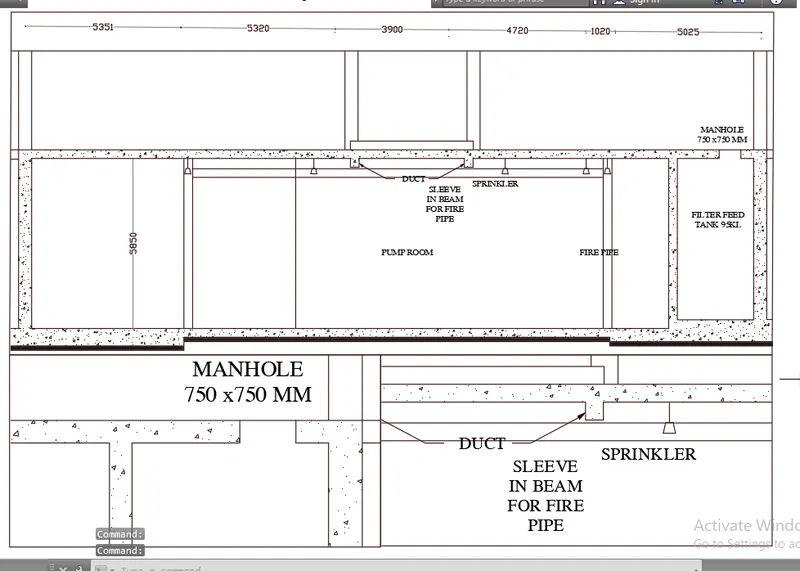
Creation of Multiple viewports, Scaling the drawing and setting in Template in AutoCad
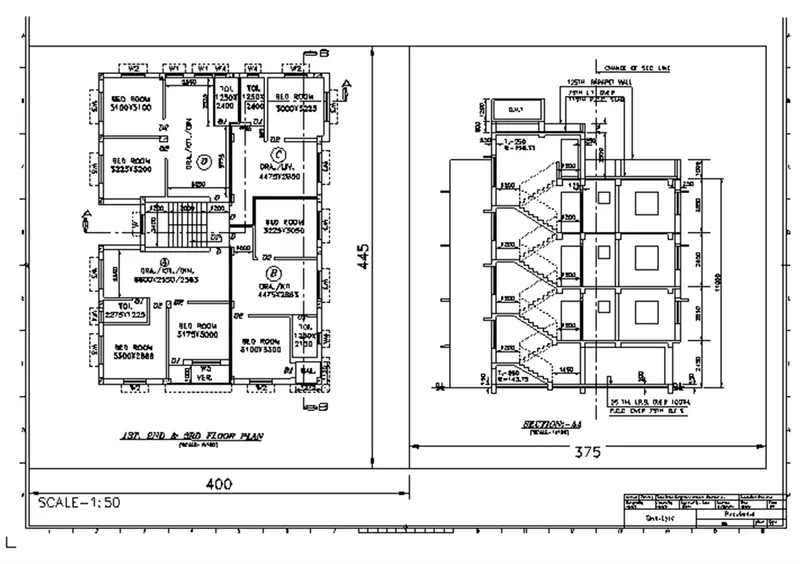
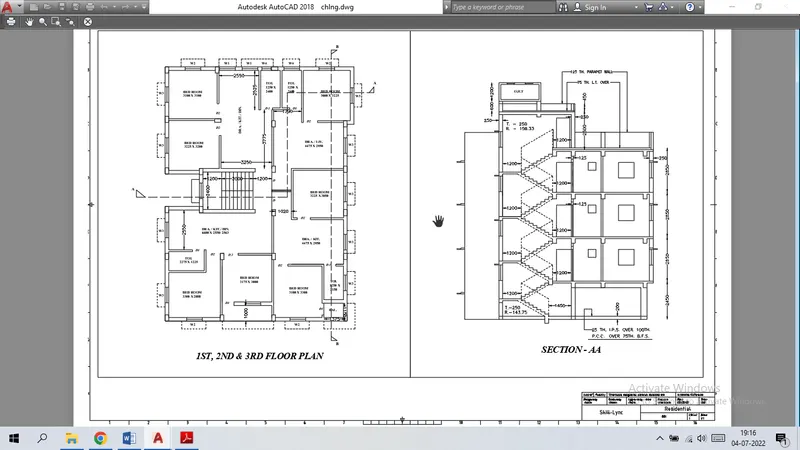
1. Create a layout of the Plan and Section A of the project in Challenges 7, using the template Tutorial-mArch.dwt in a scale as given in the Figure. Use the MV command to create the viewport of the size as shown in Figure. Also, use the ATTEDIT command to edit the information in the title block. Use A1 size for the layout. Take a plot.
AIM
To create a layout of the Plan and Section A of the project in Challenges 7, using the template Tutorial-mArch.dwt in a scale as given in the Figure
INTRODUCTION
Layout viewports are objects that display views of model space. We create, scale, and place them in paper space on a layout.
On each layout, we can create one or more layout viewports. Each layout viewport is like a closed-circuit TV monitor of a view of the model at a scale and orientation that we specify.
PROCEDURE
Creating layout
Go to the Layout tab and delete the current viewports available
Right-click on the layout tab and click on “FROM TEMPLATE”
From pop up click on tutorial-mArch right click on layout and click on rename and type
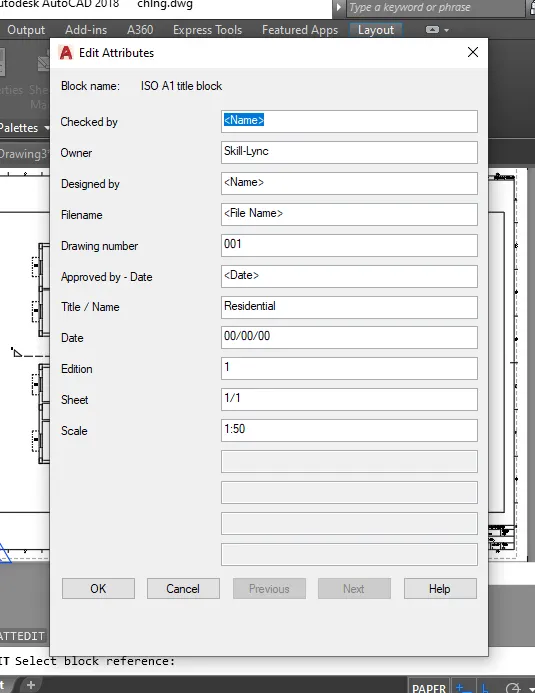
Edit the template using the ATTEDIT command as per the given figure
Creating views
Go to the model tab
Type V and press enter
Click on new
Type name as 1ST 2ND 3RD FLOOR PLAN click on define window
Select the floor plan
Press enter
Click on ok
Click on new
Type name as SECTION AA
Click on define window
Select the section view
Press enter
Click on ok
Creating viewports
Draw a rectangle from the top of the layout of dimensions 400 x 445
Draw another rectangle adjacent to the rectangle from the top right corner with dimensions 375 x 445
Go to paper space or PS
Type MV in the command box and click on the object in the command box select the object to the viewport as the first rectangle drawn
Go to model space or MS
Type V and press enter
Select the floor plan view created and click on set current and click okay change the scale to 1:50/2% and plan the figure to adjust
Go to paper space or PS
Type MV in the command box and click on the object in the command box select the object to the viewport as the second rectangle drawn
Go to model space or MS
Type V and press enter
Select the SECTION AA view created and click on set current and click okay change the scale to 1:50/2% and plan the figure to adjust
Go to paper space or PS
Select the two viewports created and go to properties change the display locked to yes
Plotting
Type plot and press enter or select plot from the menu bar
Set name as week_10_layout
Change printer to AutoCAD pdf
Set paper size as ISO A1
Change plot area to layout
Change plot style table to monochrome.ctb
Click ok to plot
RESULT
2. Create a layout of the Kitchen drawn in Challenge 9 as shown in Figure. Use the scale as shown in the Figure. Use an A4 Size page for the layout. Take a plot.
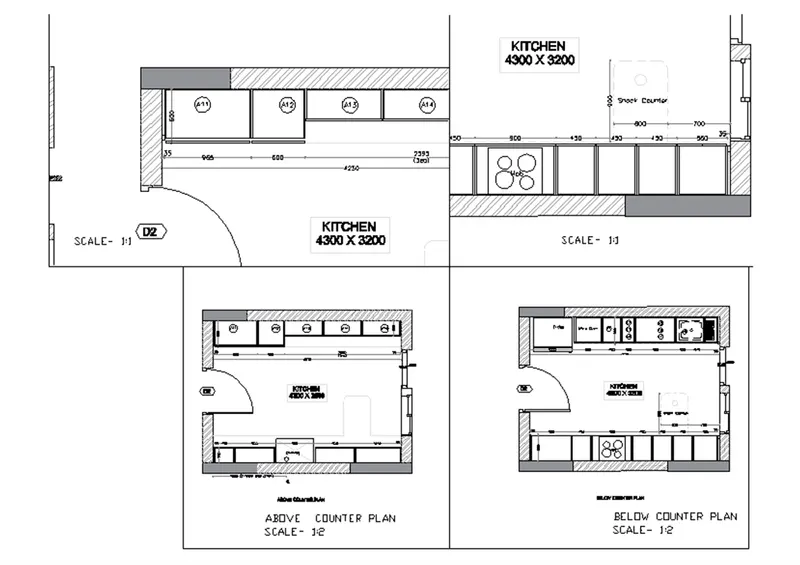
AIM
To create a layout of the Kitchen drawn in Challenge 9 as shown in Figure. And take a plot.
PROCEDURE
Creating layout
Go to the Layout tab and delete the current viewports available
Type MV to create the viewport
Create rectangles as shown in the figure
Adjust the view and scale as mentioned in the figure
Plotting
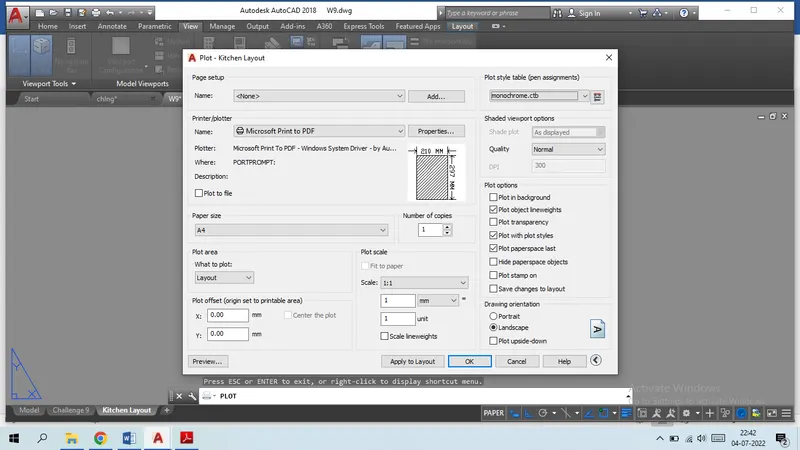
Type plot and press enter or select plot from the menu bar
Set name as Kitchen layout
Change printer to AutoCAD pdf
Set paper size as ISO A4
Change plot area to layout
Change plot style table to monochrome.ctb
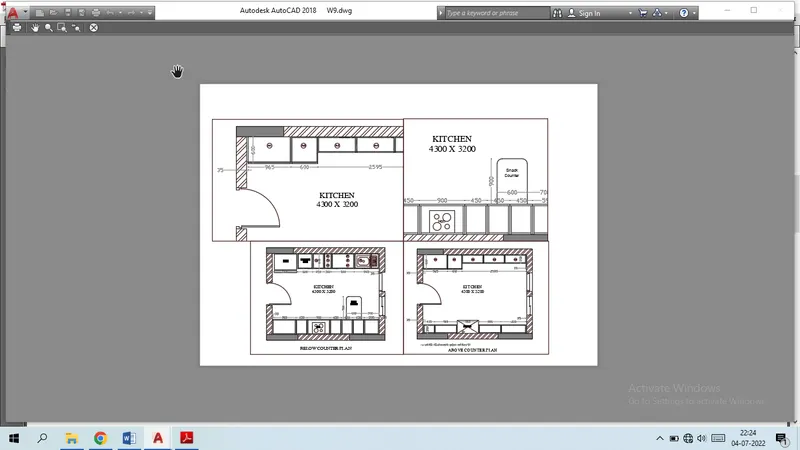
Click ok to plot
RESULT
3. Create a layout of the section created in Challenges 9.
Use the scale as mentioned in the Figure. Use the MV command to create multiple viewports. Take a plot.
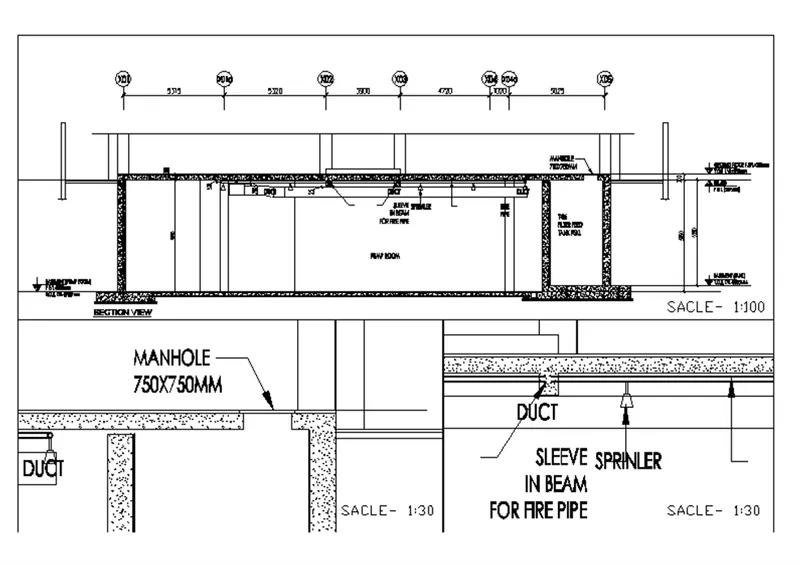
AIM
To create a layout of the section created in Challenges 9. And take a plot.
PROCEDURE
Creating layout
Go to the Layout tab and delete the current viewports available
Type MV to create the viewport
Create rectangles as shown in the figure
Adjust the view and scale as mentioned in the figure
Plotting
Type plot and press enter or select plot from the menu bar
Set name as Kitchen layout
Change printer to AutoCAD pdf
Set paper size as ISO A4
Change plot area to layout
Change plot style table to monochrome.ctb
Click ok to plot
RESULT