Configuration & Simulation of a Generic Battery Model according to a Li-Ion Datasheet for different Operating Conditions
OBJECTIVE:
- To configure the Generic Battery Model in Simulink according to a Lithium Ion Battery Datasheet.
- To simulate the configured Generic Battery Model according to the UDDS Drive Cycle Data and obtain the Charge & Discharge Characteristics according to the parameters set in the Generic Battery Block.
SOLUTIONS:
Solution to Objective 1:
The Datasheet used for this Objective is of a Lithium Ion Battery from EEMB. The Link for the Datasheet is given below:
https://drive.google.com/file/d/1E_M7h8ot1ZRcRcSIyqpIrid5Kr8nWpjq/view?usp=sharing
At first, in Simulink, the Battery Block is added. This Battery Block represents a Generic Battery which can be used as a model for most types of Rechargeable Batteries. This particular Battery Block can be obtained from Library> Simscape / Electrical/ Specialised Power Systems/Electric Drives/Extra Sources.
According to the specifications and the plots given in the Datasheet, the parameters set in the model:
- Nominal Discharge Current: As per the Datasheet, the standard Discharge & Charge Current is 0.52 A.
- Nominal Voltage: As per the Datasheet, it is clearly specified as 3.7 V.
- Initial SOC: The Initial SOC (State of Charge) of the Cell is in general 100%. Hence 100% has been put as input to this parameter.
- Battery Response Time: The Battery Response Time has been set to 30 seconds which was the default value.
Discharge Parameters of the Cell:
- Maximum Capacity: As per the Discharge Characteristics of the Cell in the Datasheet and the specification in the sheet, the maximum capacity of the Cell is 2600 mAh or 2.6 Ah.
- Cut-off Voltage: As per the Discharge Characteristics of the Cell in the Datasheet and the specification in the sheet, the cut-off Voltage of the Cell is 3.0 Volts.
- Fully Charged Voltage: As per the Discharge Characteristics of the Cell in the Datasheet and the specification in the sheet, the Maximum Charge Voltage (Voltage at 100% SOC) is given as 4.2 Volts with a tolerance of ± 0.05 Volts. For input into the Generic Battery Model Block, the value of 4.2 Volts will be taken.
- Nominal Discharge Current: As per the Discharge Characteristics of the Cell in the Datasheet, the Nominal Discharge Current is assumed to be same as Standard Discharge Current which is specified as 0.52 Amperes.
- Cell/Battery Capacity at Nominal Voltage: According to the Charge/Discharge Characteristics of the Cell in the Datasheet, the Cell Capacity at Nominal Voltage (3.7 V). Now considering the Nominal/Standard Discharge Current as 0.52 A and the Nominal Capacity of the Battery as 2.6 Ah, then the C-rate corresponding to the Cell Capacity at Nominal Voltage of the plot is 0.2C. Hence we can consider 0.2C as the Nominal C-Rate. On analysing the curve represented by 0.2 C in the Voltage-Discharge Capacity plot, the Discharged Cell Capacity at Nominal Voltage seems to correspond to 80% Discharge Capacity which is roughly equivalent to (0.8*2.6 Ah)= 2.08 Ah.
- Exponential Zone for Voltage and Capacity: The curve corresponding to the Nominal/Standard Discharge Current (0.52 A) and Nominal Capacity of the Battery (2.6 Ah) which is the curve representing the 0.2 C Rate, visually the exponential zone doesn’t seem clear. But on basis of General Discharge Characteristics of most Lithium Ion Batteries, the estimate seems to point at 3.9 V Discharge Voltage and 25% Discharge Capacity which is equal to 0.65 Ah Discharge Capacity.
- Discharge Current [i1, i2, i3,…]: The user has to give input of the values of the Discharge Currents whose curves they want to see in the Discharge Characteristics Plot (either Discharge Voltage vs Time OR Discharge Voltage vs Battery Capacity) in order to verify the accuracy and precision of the plot generated by the Generic Battery Block and the plot present in the datasheet. Since in the data sheet, the discharge Characteristics plot has curves representing the C Rates, therefore, the Discharge Current is calculated using the Rated Capacity of the Cell and the C-Rate of the Cell. After obtaining the Discharge Current Values, it is given as input.
For 0.2 C Rate, the Discharge Current is 0.52 A (this also happens to be the standard discharge/charge current as specified in the Datasheet).
For 0.5 C Rate, the Discharge Current is 1.3 A.
For 1.0 C Rate, the Discharge Current is 2.6 A.
For 2.0 C Rate, the Discharge Current is 5.2 A.
For 3.0 C Rate, the Discharge Current is 7.8 A.
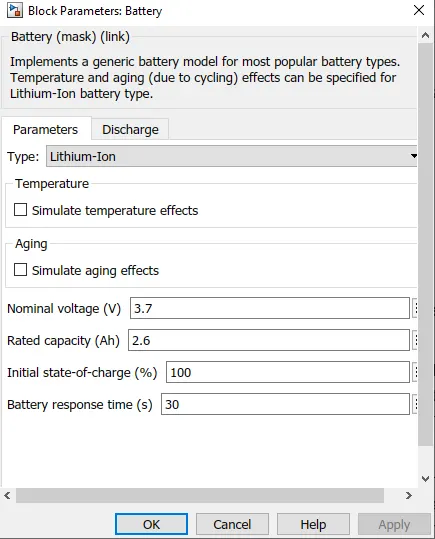
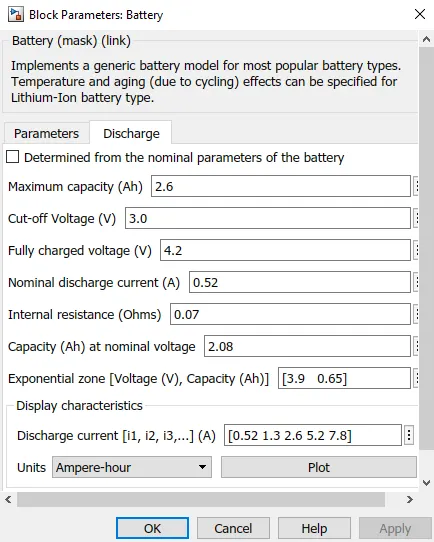
Values given to various Parameters for Modelling the Battery as per specifications given in the Cell Datasheet
The Discharge Characteristics (either Discharge Voltage vs Time OR Discharge Voltage vs Battery Capacity) can then selected and the required plot can be obtained for verification with the Discharge Characteristics Plot in the Datasheet.
NOTE: Due to lack of required information about the behaviour of the cell based on Temperature (both of cell and ambient and other temperature related factors) and Aging factors, the Temperature Effects and Aging Effects cannot be simulated.
After entering the values to the required parameters, the plot obtained is as follows:
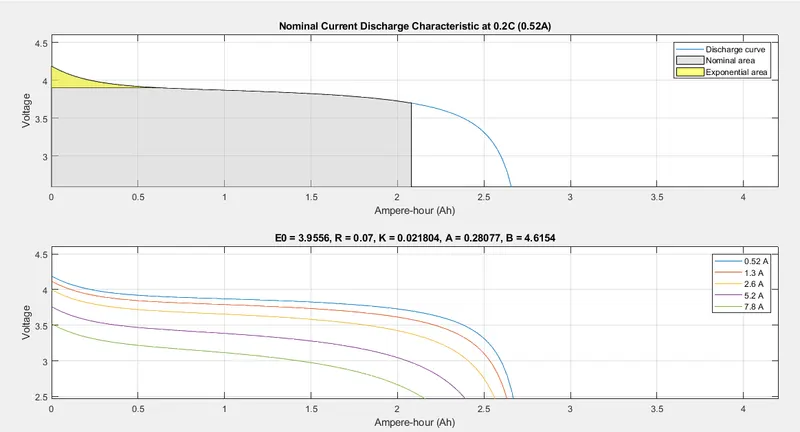
Plot obtained by the Generic Battery Model Block in Simulink after entering the values obtained from the Cell Datasheet.
VS
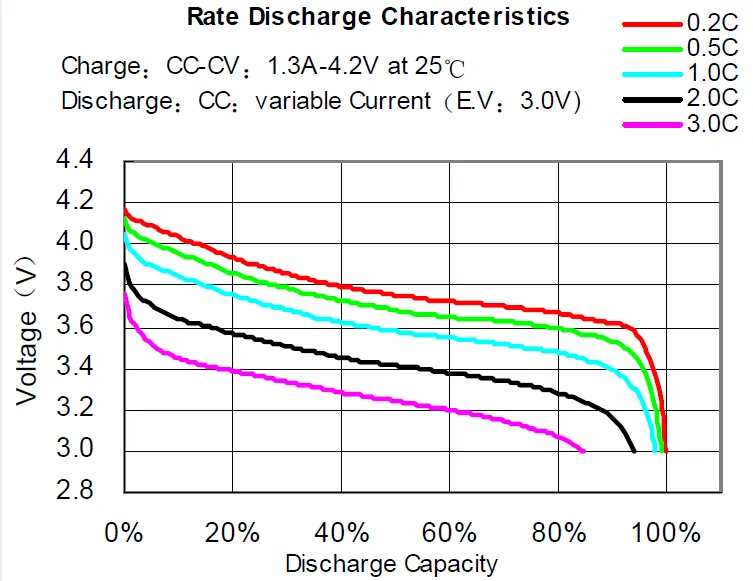
Discharge Characteristics Plot in the Datasheet
Analysis on comparing the plots: In the Datasheet, the Discharge Terminating Voltage is 3.0 Volts which is same as the Discharge Cut-Off Voltage mentioned in the Datasheet, however in the Generic Battery Model Block, the Discharge Terminating Voltage continues to go below 3.0 Volts.
After entering the parameter values in the Generic Battery Model Block, the applicability of this Battery Model is now checked by connecting the model to the following Simulink Model Blocks:
- Controlled Current Source Block: This block converts the Simulink input signal into an equivalent current source. The generated current is driven by the input signal of the block. This block is connected to the Generic Battery Model Block.
- Constant Block: For the time being, the applicability of the configured Battery Model is checked for a constant Current Value. This Constant Value is set to 0.52 which means that the Controlled Current Source Block will be fed a constant Current Value of 0.52 A which is the standard Discharge & Charge Current for the Battery Model as specified in the Datasheet.
- Scope Block: After feeding the Constant Discharge Current of 0.52 A to the Generic Battery Model Block, the Battery Model characteristics are analysed on the Scope Block.
- powergui Block: powergui Block is needed to simulate any Simulink model containing Simscape™ Electrical™ Specialized Power Systems blocks. It stores the equivalent Simulink circuit that represents the state-space equations of the model. The simulation type is set to Continuous.
- Bus Selector block: This Block outputs the elements you select from the input bus(Generic Battery Model Block). The block has been put to output the selected elements separately(SOC(%),Voltage(V) & Current(A)) .
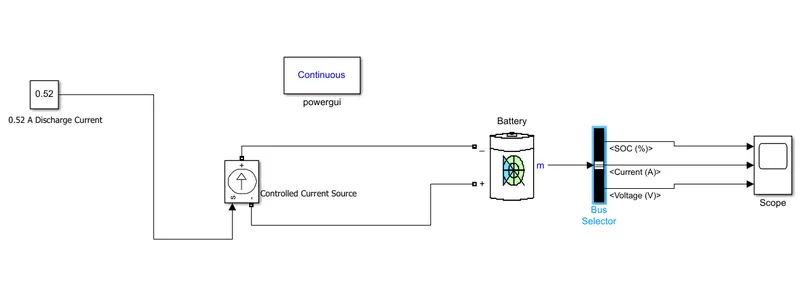
My Simulink Model for simulating the Battery at Constant Current
The Simulation time is now set to 18000 which corresponds to 18000 seconds because for the Standard Discharge Current of the Battery is 0.52 A and the Rated/Nominal Capacity of the Battery is 2.6 Ah. If 2.6 Ah Capacity Battery is is discharged at Constant current of 0.52 A, then the total discharge time for the Battery to reach SOC (State of Charge) of 0% (considering initially the SOC of Battery is 100%) is given by the formula:
Q=I X t
where Q -> Capacity of the Battery
I -> Current flowing to/from the Battery
t-> Time taken by the Current to discharge/charge the Battery.
Therefore, 2.6 = 0.52 X t
=> t=[2.6/0.52]= 5 hours = 5 X 60 minutes =300 minutes = 300 X 60 seconds = 18000 seconds.
Hence the Simulation time is set to 18000 seconds as it represents the total discharge time based on the specifications in the datasheet.
After the model is simulated by pressing the Run Logo, the Discharge Characteristics of the Battery can be analysed.
The output from the Scope Block is given below:
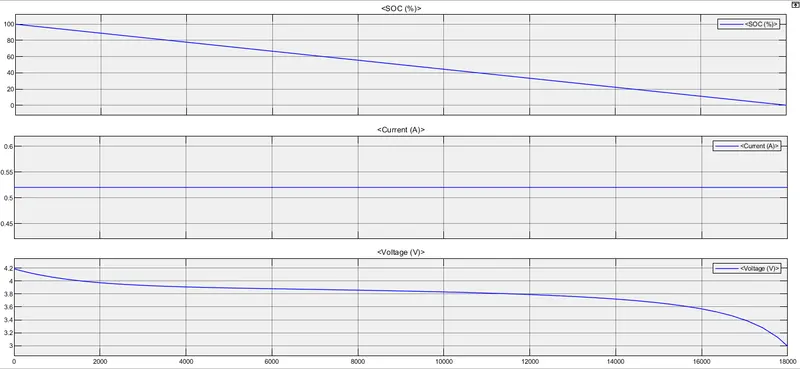
Battery SOC, Discharge Current and the Cell Voltage when a Discharge Current of 0.52 A is taken from cell for 5 hours.
As per the values put in the Generic Battery Model Block, the output plot matches with the expected results as is evident from the Cell SOC (going down from 100% to 0%), the Battery Voltage reducing from 4.2 Volts to approximately 3 Volts (equal to cut-off Voltage mentioned in Datasheet and Geneic Battery Model Block Parameter) which almost aligns with Datasheet Plot representing the 0.2C Curve in the Discharge Characteristics of Battery Voltage-Discharge Capacity (in %). The Discharge Current remains constant at 0.52 A throughout the entire Discharge time period.
Therefore, it can be concluded that the Generic Battery Model Block in Simulink can implement the behaviour of the Actual Cell/Battery Model to a good degree of accuracy and precision.
Solution to Objective 2
This objective will again analyse the behaviour of the Generic Battery Model in Simulink as per the specifications in the Datasheet but this time, it will not be for a constant Discharge Current, but for a continuously varying Current profile. The continuously Varying Current profile is derived from the UDDS Drive Cycle. An EV/HEV draws/provides current from/to the Battery as per the variations in speed of the vehicle w.r.t. time.
The parameter values set in the Generic Battery Model Block for this objective is equal to the values fed to the parameters in the Generic Battery Model Block in the previous Objective.
Values given to various Parameters for Modelling the Battery as per specifications given in the Cell Datasheet
After implementing the required parameters from the Datasheet into the Battery Block (Generic), the Charge & Discharge Characteristics of the Battery in accordance to the UDDS Drive Cycle are to be obtained and analysed.
For this Objective, the ‘From Workspace’ Block is used to provide the required Drive Cycle data as input to the configured Battery Block and the results are observed by connecting the Scope Block to the Battery Block.
Since the output of the ‘From Workspace’ Block will be fed as input to the Generic Battery Model Block and the Generic Battery Model Block takes current as input for modelling the Battery, hence the data in the ‘From Workspace’ block should represent the current profile(Current vs Time) corresponding to the UDDS Drive Cycle (Speed vs Time Plot). Therefore the Current drawn/given from/to the Battery data is required to be found out for the speed data in the UDDS Drive Cycle. The Current Profile for the UDDS Drive Cycle can be obtained from the given link below:
https://drive.google.com/file/d/11B_lu9lWQ-FH_-lPO_x9hWaHKU_KP3C6/view
The UDDS Drive Cycle Data along with the current values (in Excel Sheet format) are then exported to the MATLAB Workspace using the ‘Import Data’ under the HOME Tab in the main MATLAB Window.
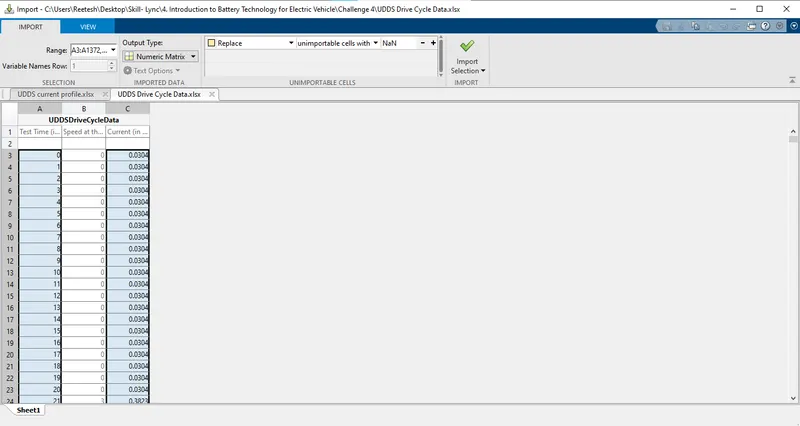
Importing Time & corresponding Current from the Excel File
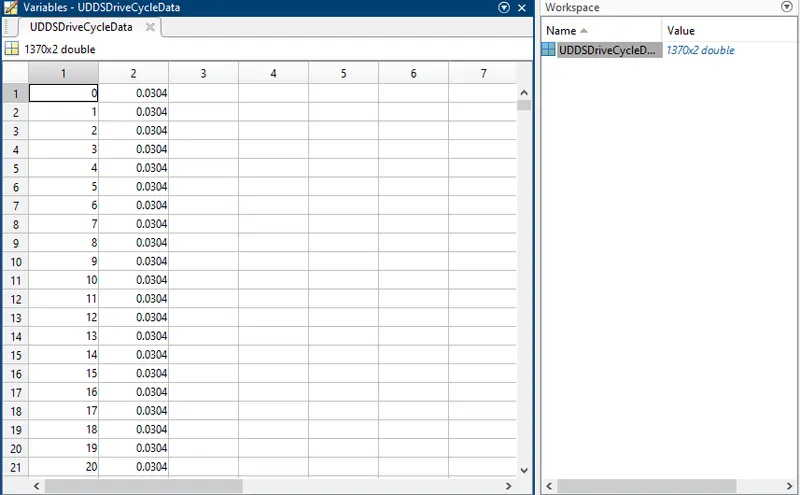
Imported Time & Corresponding Current Data from Excel File to MATLAB Workspace
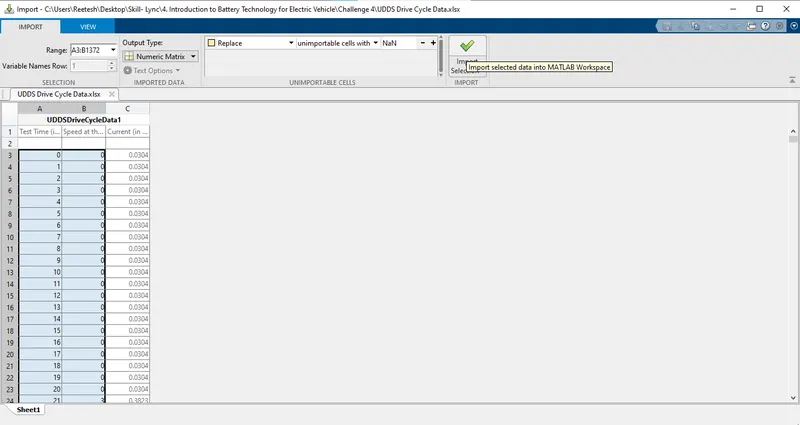
Importing UDDS Drive Cycle Data from Excel File to MATLAB Workspace
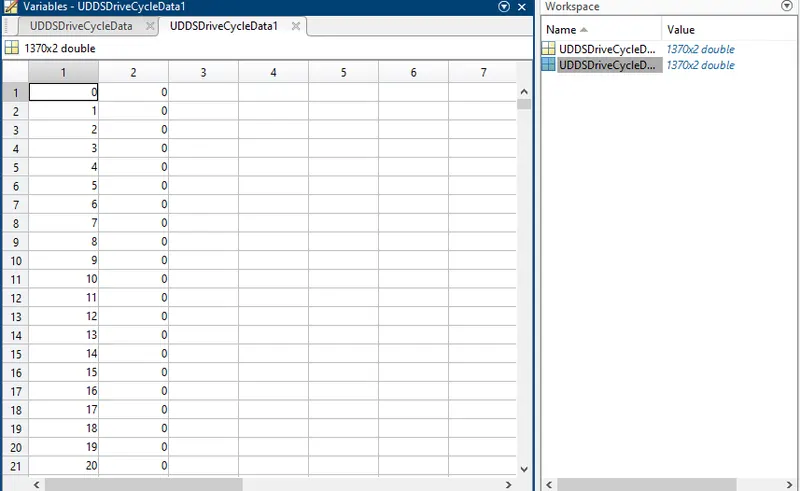
Imported UDDS Drive Cycle Data from Excel File to MATLab Workspace
In the Simulink Window, the ‘From Workspace’ Block can be used to obtain the required data already loaded in the MATLAB Workspace by double clicking on the Blocks and writing the File Name (in MATLAB Workspace) under the Data parameter, whose data you want to be loaded in the Block.
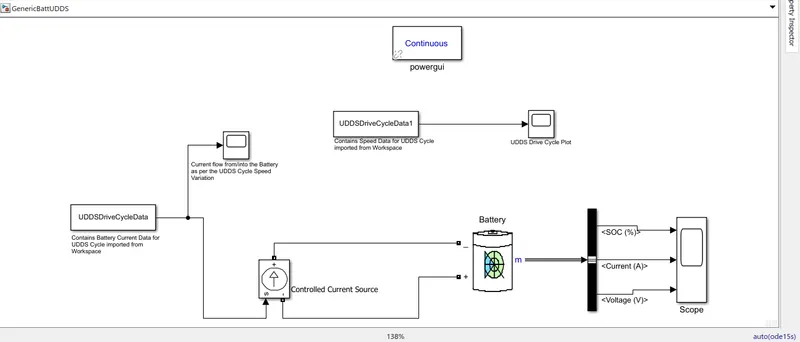
Simulink Model to Simulate the customized Generic Battery Model according to the UDDS Drive Cycle & it's corresponding Current Data
The Current Profile and the UDDS Drive Cycle Data plots obtained from the Scope Block connected to the ‘From Workspace’ Blocks after simulating the model is shown below:
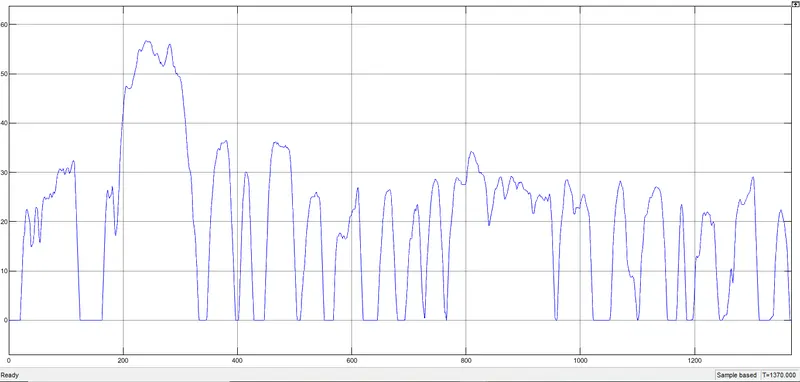
UDDS Drive Cycle Plot obtained from Scope Block
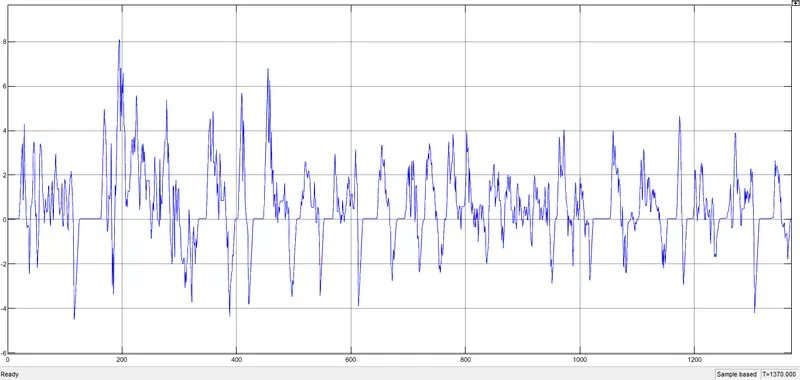
Current Profile for UDDS Drive Cycle
On simulating the Battery Model for the UDDS Drive Cycle for time set to the number of ascending time values as given in the link containing the Time, Speed and the corresponding Current in the Link:https://drive.google.com/file/d/11B_lu9lWQ-FH_-lPO_x9hWaHKU_KP3C6/view, the results from the Scope Block connected to the Generic Battery Model are given below:
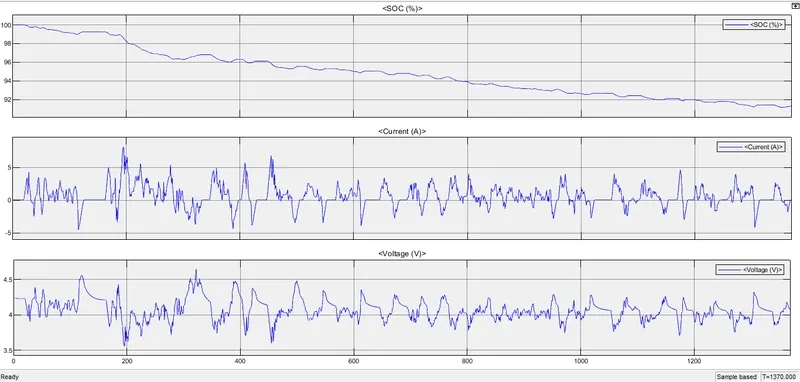
Output Plots on Simulating the Model
From the plots we can conclude, that when SOC is constant, there is no current charge or discharge from the Cell. When Current is getting discharged from the Cell, the SOC of the Cell is decreasing and When the Cell is getting charged (Battery flowing into Current), the SOC of the Cell is increasing.

Indication of Charging & Discharging of Cell in the Plot
When the vehicle is accelerating, the Current getting discharged from the Battery is increasing which is marked by increase in Current in the Current Plot and when the vehicle is decelerating, current getting discharged from the Battery is decreasing (negative rate of Current Flow), until it goes below 0, where now the Current is flowing back to the Battery (negative value of Current). Whenever Current Value goes below 0, that means Regenerative action of the Brakes has kicked in and is regaining the energy released during Braking action, which in general cases gets lost to the surrounding as Heat Energy.
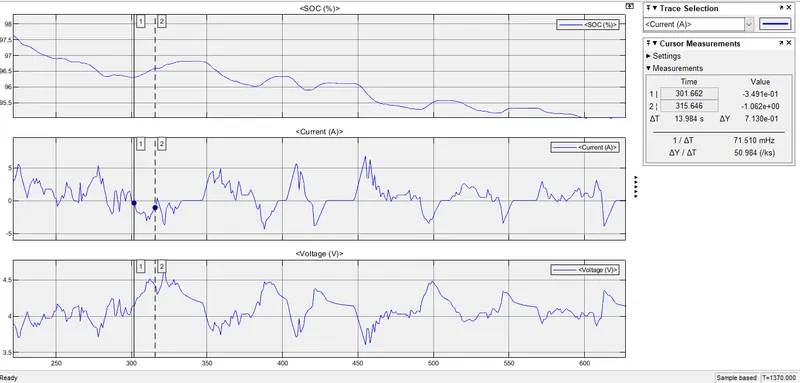
Zoomed In View of the plots for Indication of the Cell Charging (SOC increasing) when the Current values lie in the negative region(below 0) and the Voltage Level exceeding the Initial Fully Charged Voltage(4.2 Volts)
Correspondingly, as the current is getting discharged from the Battery, the Voltage of the Cell is decreasing. Similarly when the Rate of Current is decreasing, the Voltage of the Cell is increasing. In the plots obtained, whenever the Current Value in the Current Plot is going below 0(when Regenerative Braking Action kicks in), the Voltage of the Cell is exceeding the Fully Charged Voltage of the Cell which is set to 4.2 Volts. From the plots, with a quick glance, we can say that the Current Plot and the Voltage Plot are mirror representatives of each other, however on closer look, when there is no current Flow in the Circuit, the Battery Voltage somewhat follows the nominal Discharge characteristics of the Cell as seen for a Constant Discharge Current done during Objective 1 and the value of the Cell Voltage is returning to roughly equal to 4.0 to 4.2 Volts which is roughly equal to the Fully Charged Initial Voltage of the Cell.
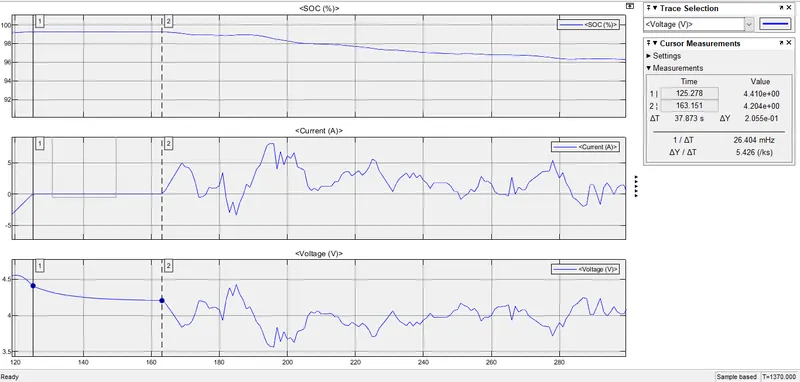
Zoomed In View of the Plots indicating the Nominal Discharge Voltage Curve of the Cell when the Current is Constant at 0 Amperes for the given time period.
REFERENCES: