Challenge 2- Comparing the performance of three types of beams under bending load.
COMPARING THE PERFORMANCE OF THREE BEAM UNDER BENDING LOAD
AIM:- To compare the performance of three beam of different type under bending load.
INTRODUCTION:-This report presents the results of nonlinear analysis performed on three different cross section beam: Rectangular Beam of dim. 80x45 , I section Beam having flange of width 40 mm and web of length 54.83 mm and a C section beam of depth 80mm and flange of width 45 mm and applying a load of 1500 N on the smaller face (i.e. 40 mm for case 1, 45 mm for case 2 and 45 mm face for case 3 ). and fixed on one side and applying load of 1500 N on smaller length face.
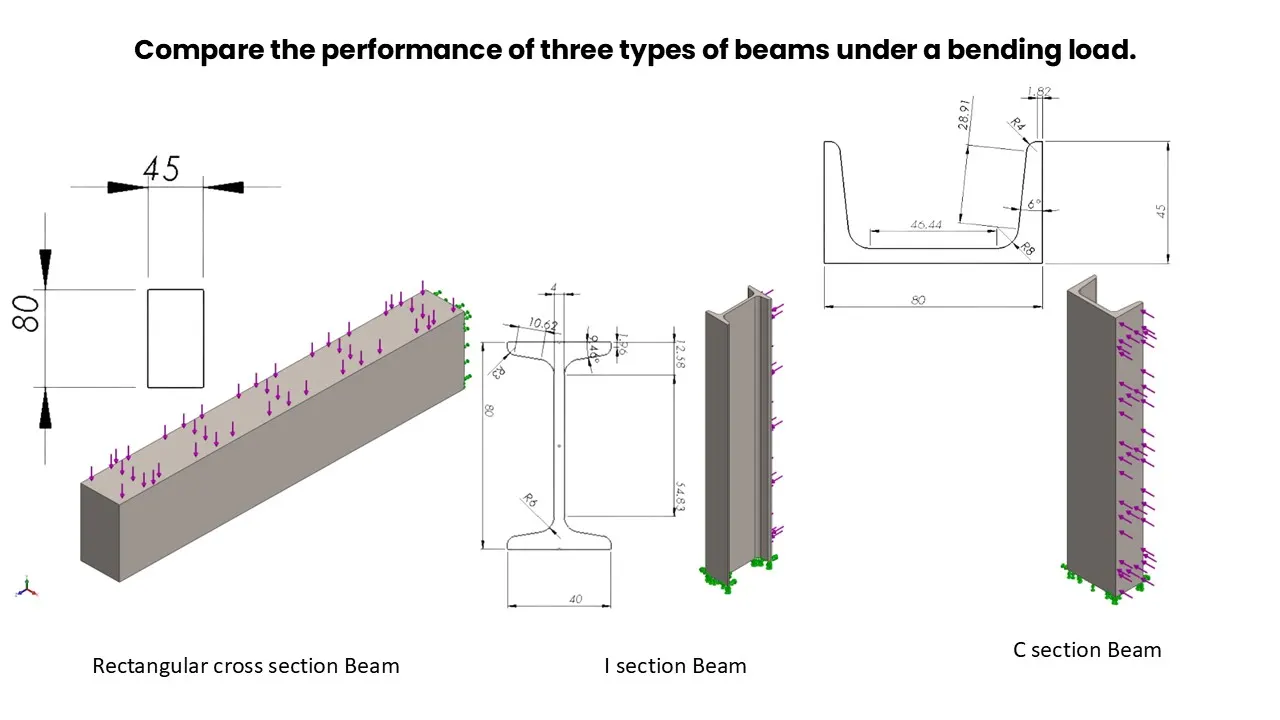
Simulation Setup
Software Used: SolidWorks Non-Linear Analysis
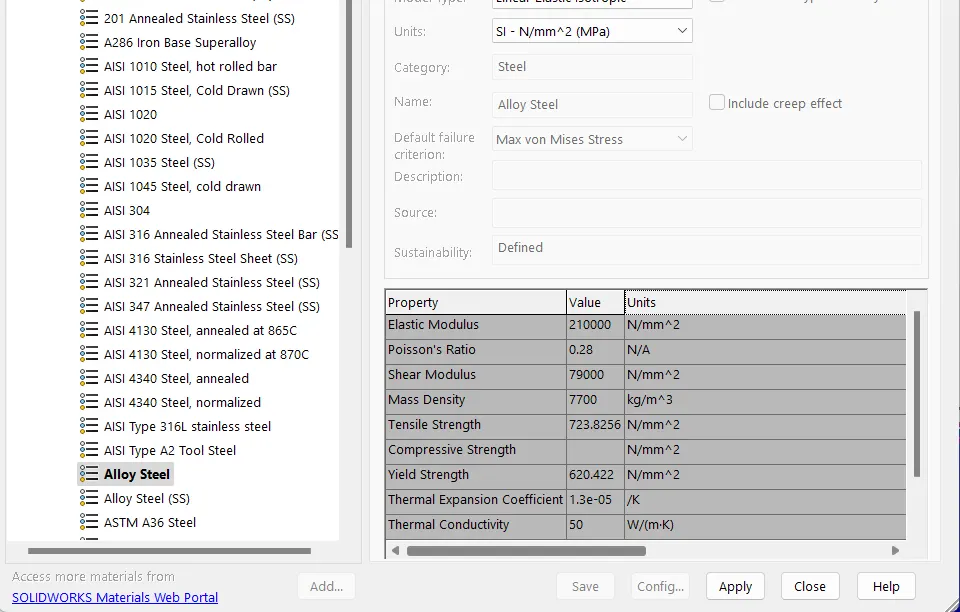
Material: Alloy Steel (Mechanical Properties considered from standard data)
Young’s Modulus: ~210 GPa
Poisson’s Ratio: ~0.3
Yield Strength: ~620.422 MPa (Assumed, may vary based on grade)
Ultimate Tensile Strength: ~723.83 MPa
Loading Conditions:
Load Applied: 1500N
Application Side: Smaller side of the beams
Support Condition: Fixed at one end
Mesh Type: Tetrahedral elements (Fine mesh refinement near high-stress areas)
Analysis Type: Non-Linear Static Analysis
1.Beam Geometry & Mass Properties
| PROPERTIES | I BEAM | C-SECTION BEAM | 80X45 RECT BEAM |
|---|---|---|---|
| Mass ( kg) | 2.36359 | 3.22266 | 11.088 |
| Volume (m^3) | 0.00030696 | 0.000418527 | 0.00144 |
| Weight (N) | 23.1632 | 31.582 | 108.662 |
2. Mesh Details
| PARAMETER | I SECTION BEAM | C-SECTION BEAM | 80X45 RECT BEAM |
|---|---|---|---|
| MESH TYPE | SOLID MESH | SOLID MESH | SOLID MESH |
| MAX ELEMENT SIZE(mm) | 6.86372 | 7.482205 | 11.2949 |
| MIN ELEMENT SIZE (mm) | 2.28788 | 2.49399 | 11.2949 |
| Total Nodes | 57,824 | 28,556 | 11,549 |
| Total Elements | 31,986 | 15,315 | 7,282 |
| MESH QUALITY | HIGH | HIGH | HIGH |
3 Comparison and Key Observation
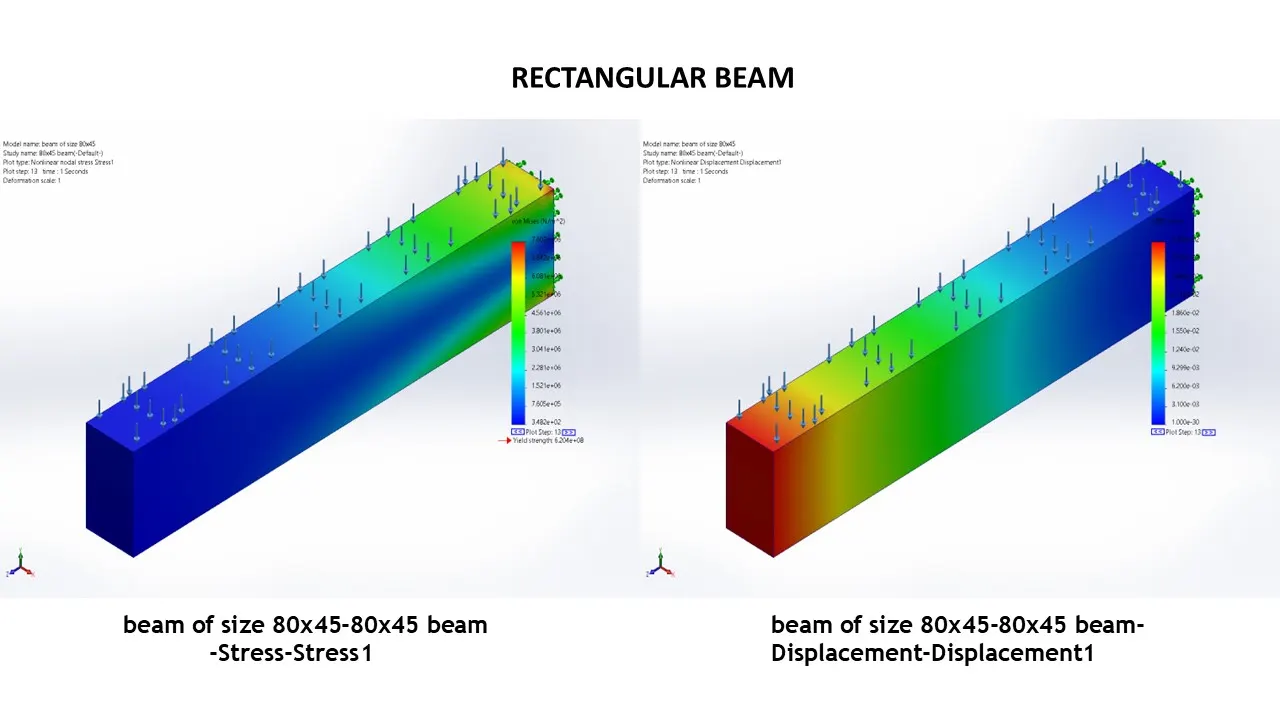
3.1Rectangular Beam
Maximum Stress: 7.602 MPa (from the simulation image)
Maximum Deformation:3.102X10^-2 mm at length of 400mm
Stress analysis: The rectangular beam has an intermediate stress level but lacks the weight efficiency of the beam.
Deformation Analysis: it has moderate displacement value 0.03102 suggesting it stable but more heavier than the I beam.
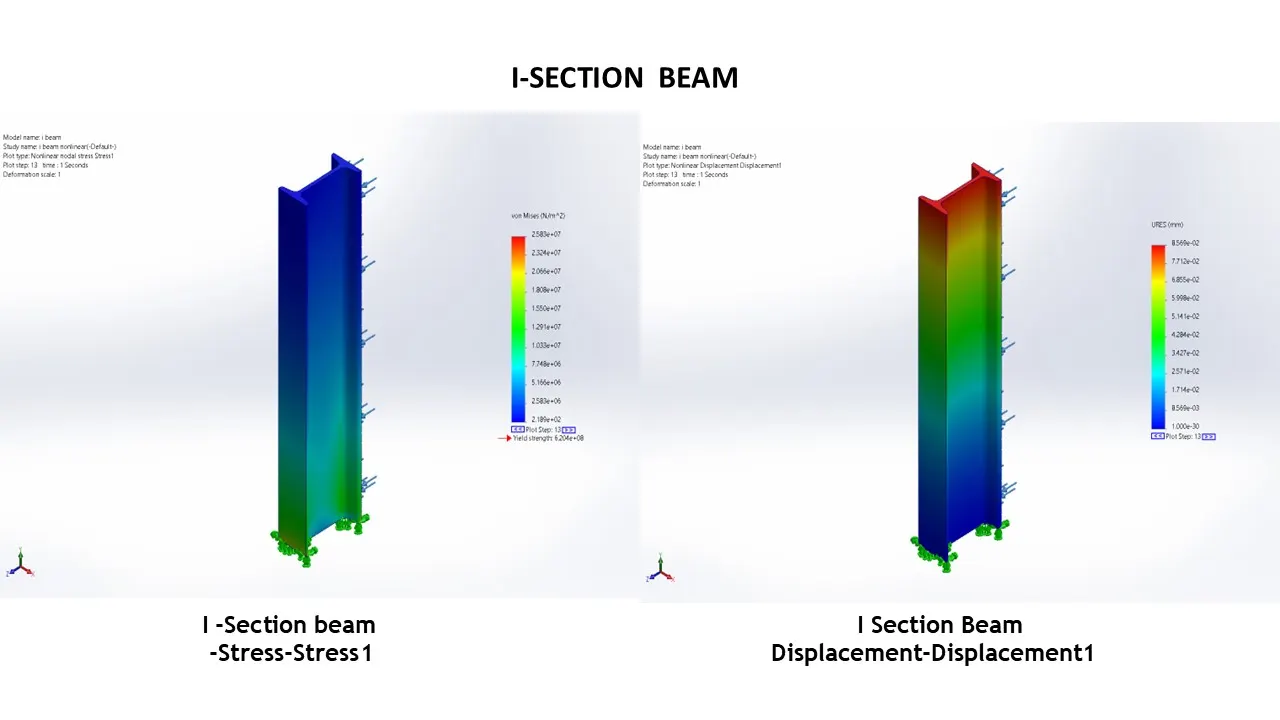
3.2 I Section Beam
Maximum Stress: 2.58X10^7Pa
Maximum Deformation: 8.569X10^-02mm
Stress analysis: The I beam experience the maximum highest on Mises stress (2.583e+07 N/m²), but remains well within its yield strength, indicating high structural efficiency.
Deformation Analysis: Deformation is maximum among three i.e. it deforms the most under load i,e 0.08569 mm
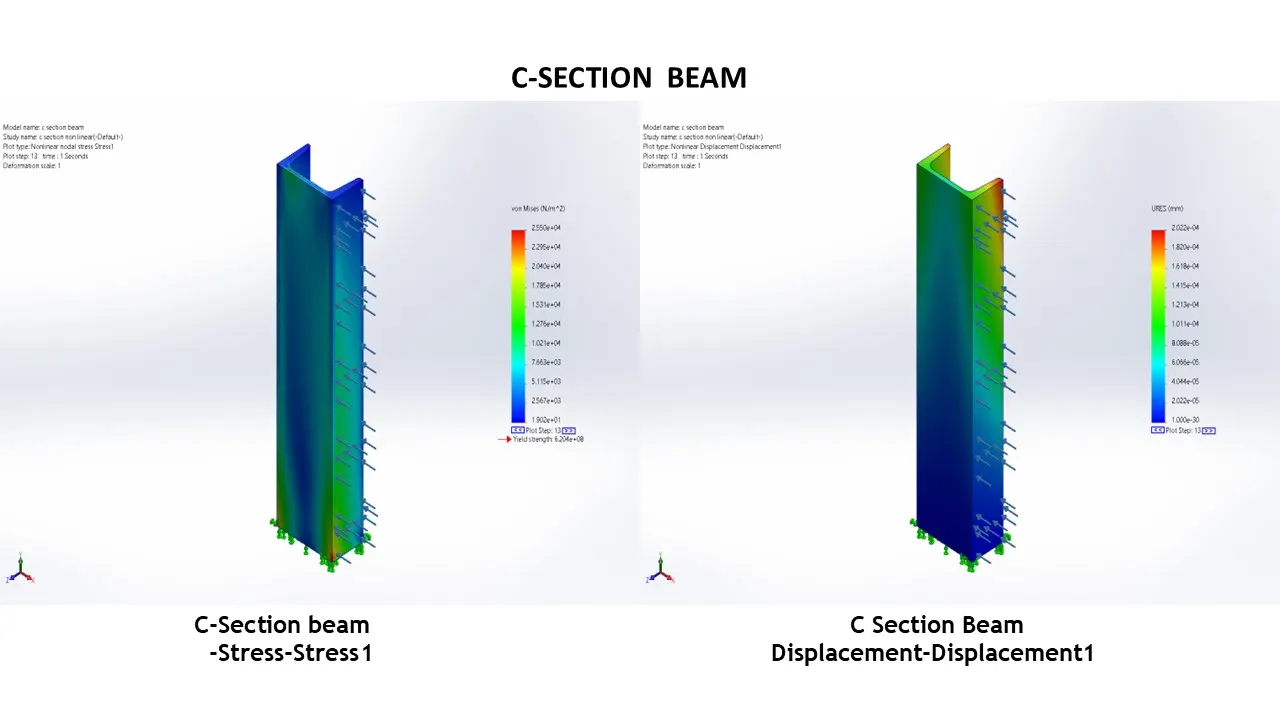
3.3 C-Section Beam
Maximum Stress: 2.55x10^4 Pa at the fixed end
Maximum Deformation: 2.022x10^-4 mm
Stress analysis: The C section Beam observed lowest stress level but may be prone to buckling or torsional instability due to its open profile
Deformation Analysis: Deformation is lowest among three indicating better stiffness but potential instability.
4.Conclusions:-
- Best Beam for Efficiency & Strength: The I-Beam takes the top spot since it resists heavy loads efficiently while making the best use of material.
- Best Beam with Least Deflection: The C-Section Beam has minimal displacement but may require additional support to prevent buckling.
- Best Beam for Simplicity and Stability: The 80x45 Rectangular Beam strikes a good balance between simplicity and stability, though it is on the heavier side.
5. Recommendation:-
If you require the optimal balance of strength and weight efficiency, the I-Beam is the preferred choice. When buckling is a concern, the C-Section Beam performs well with additional support. For applications where weight is not a critical factor, the Rectangular Beam remains a reliable option.