Centrifugal pump design and analysis
- Performance diagram. Obtain the relationship between Pressure ratio and mass flow rate and explain your results.
- Pressure ratio = Outlet total pressure/ Inlet total pressure
SOLUTION:
INTRODUCTION
SolidWorks Flow Simulation is a powerful computational fluid dynamics (CFD) software that is used to simulate and analyze fluid flow and heat transfer in various engineering applications. It is a comprehensive tool that is seamlessly integrated into the SolidWorks CAD environment, allowing engineers to perform fluid flow analysis directly on their 3D models.With SolidWorks Flow Simulation, engineers can gain insights into the behavior of fluids, such as liquids and gasses, and study how they interact with their surrounding environment. By simulating fluid flow and heat transfer, engineers can optimize designs, improve product performance, and make informed decisions before manufacturing or implementing a system.The software offers a wide range of capabilities, including steady-state and transient flow analysis, laminar and turbulent flow modeling, conjugate heat transfer analysis, and multiphase flow simulations. It provides a user-friendly interface that allows engineers to define the geometry, set up boundary conditions, and specify fluid properties easily.
SolidWorks Flow Simulation utilizes the finite volume method, which discretizes the domain into a finite number of control volumes. It then solves the governing equations of fluid flow, including the continuity equation, momentum equations, and energy equation, to calculate fluid velocities, pressures, temperatures, and other relevant parameters.
The software offers advanced visualization tools to help engineers interpret and analyze the simulation results effectively. It provides detailed data on fluid flow patterns, pressure distributions, temperature gradients, velocity vectors, and other important quantities. Engineers can use this information to evaluate the performance of their designs, identify potential issues, and optimize their systems.SolidWorks Flow Simulation finds applications in a wide range of industries, including automotive, aerospace, HVAC (Heating, Ventilation, and Air Conditioning), electronics cooling, chemical processing, and more. It enables engineers to validate and optimize their designs early in the development process, reducing the need for costly physical prototypes and iterations.
Theory of Topic:
Pressure ratio = Outlet total pressure/ Inlet total pressure
Pressure Ratio (x-axis)
This represents the ratio of outlet total pressure to inlet total pressure. It's often expressed as a dimensionless number, such as "2" for a pressure ratio of 2:1 (meaning the outlet pressure is twice the inlet pressure).
Mass Flow Rate (y-axis)
This represents the rate at which fluid (usually air or another gas) is flowing through the system. It's typically measured in units like kilograms per second (kg/s).
Behavior and Interpretation of the Performance Diagram:
Low Pressure Ratio (left side of the diagram)
When the pressure ratio is low, it means that the outlet pressure is close to or slightly higher than the inlet pressure. In this region, the mass flow rate will typically increase as the pressure ratio increases. This is because a lower pressure ratio results in less compression or expansion of the fluid, allowing more mass to flow through the system. However, there will be diminishing returns as the pressure ratio increases.
Optimal Pressure Ratio (peak performance)
At a certain pressure ratio, the system will achieve its peak performance. This is often referred to as the "design point" for the system. At this point, the mass flow rate is maximized for the given pressure ratio. This happens because the system is designed to operate most efficiently at this specific combination of pressure ratio and mass flow rate.
High Pressure Ratio (right side of the diagram)
When the pressure ratio becomes very high, it means that the outlet pressure is significantly higher than the inlet pressure. In this region, the mass flow rate will start to decrease. This is because the compressor or expander (depending on whether the system is a turbine or a compressor) may encounter flow separation, shock waves, or other issues that limit its ability to efficiently handle high-pressure differentials.
Choke Point (far right of the diagram)
Beyond a certain point, you may encounter a phenomenon known as "choking." Choking is a condition where the mass flow rate becomes nearly constant, regardless of further increases in pressure ratio. This is because the system reaches its maximum capability to handle the flow, and additional increases in pressure ratio do not result in a proportional increase in mass flow rate.
To summarize, the performance diagram for a fluid system shows how the mass flow rate varies with changes in pressure ratio. It typically exhibits an inverted U-shape, with an optimal operating point where the system performs at its best. Beyond this point, further increases in pressure ratio may not yield significant gains in mass flow rate and can lead to operational issues. Understanding this diagram is crucial for designing and optimizing fluid systems such as gas turbines, compressors, and jet engines.
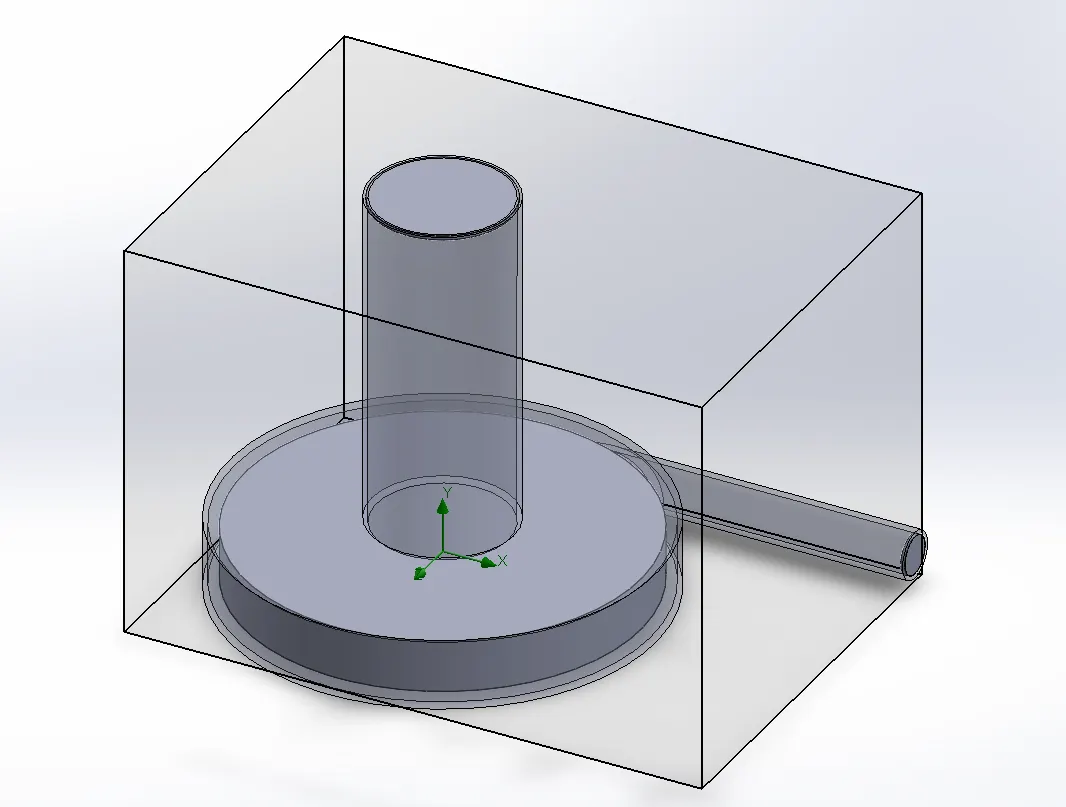
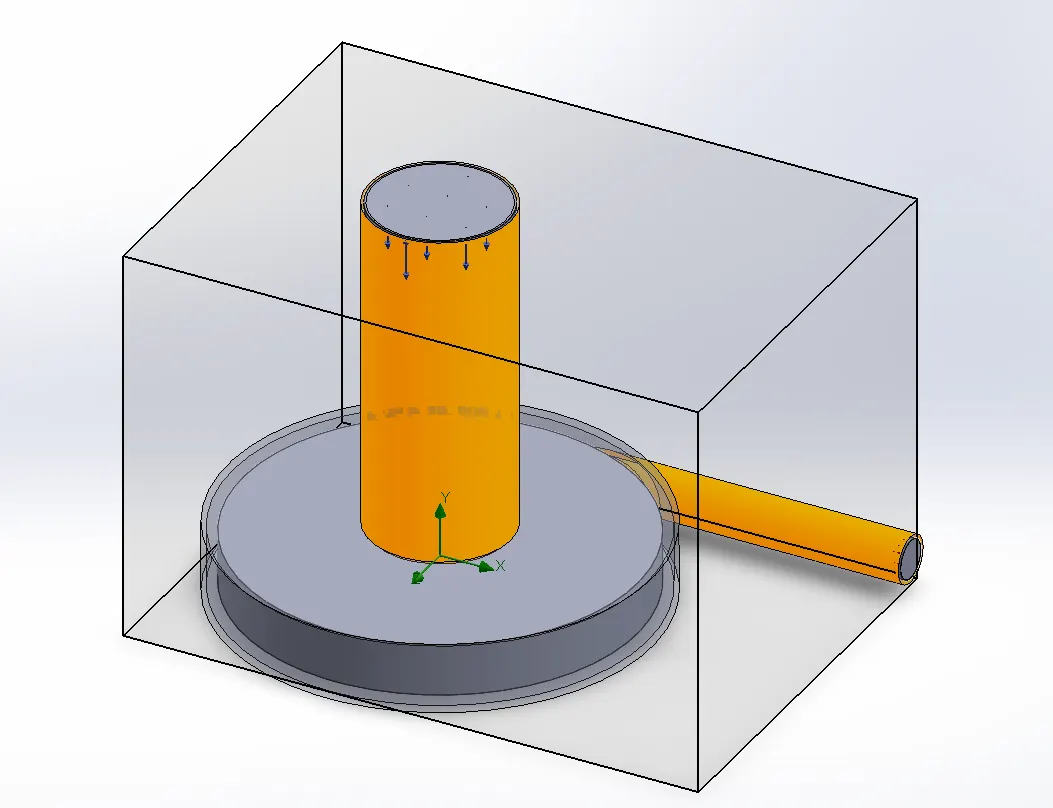
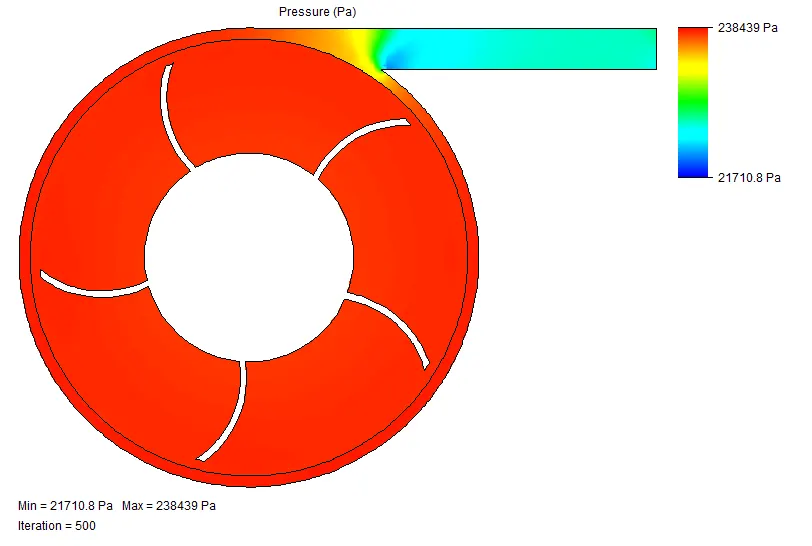
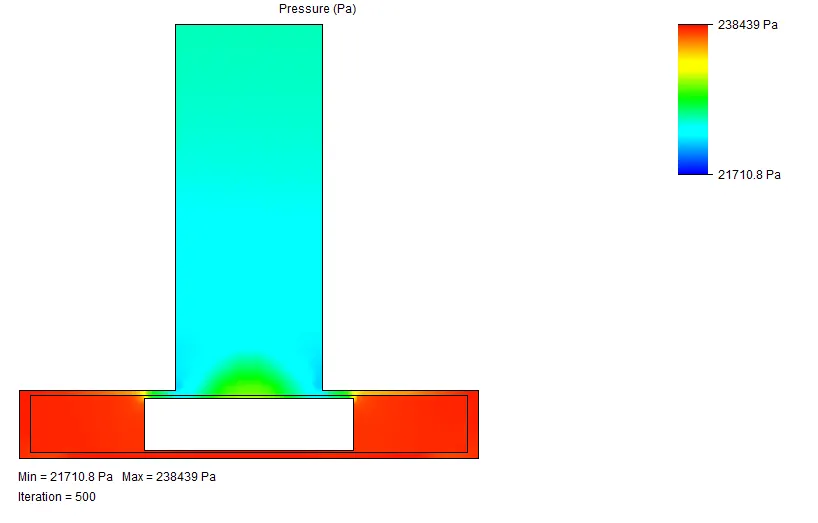
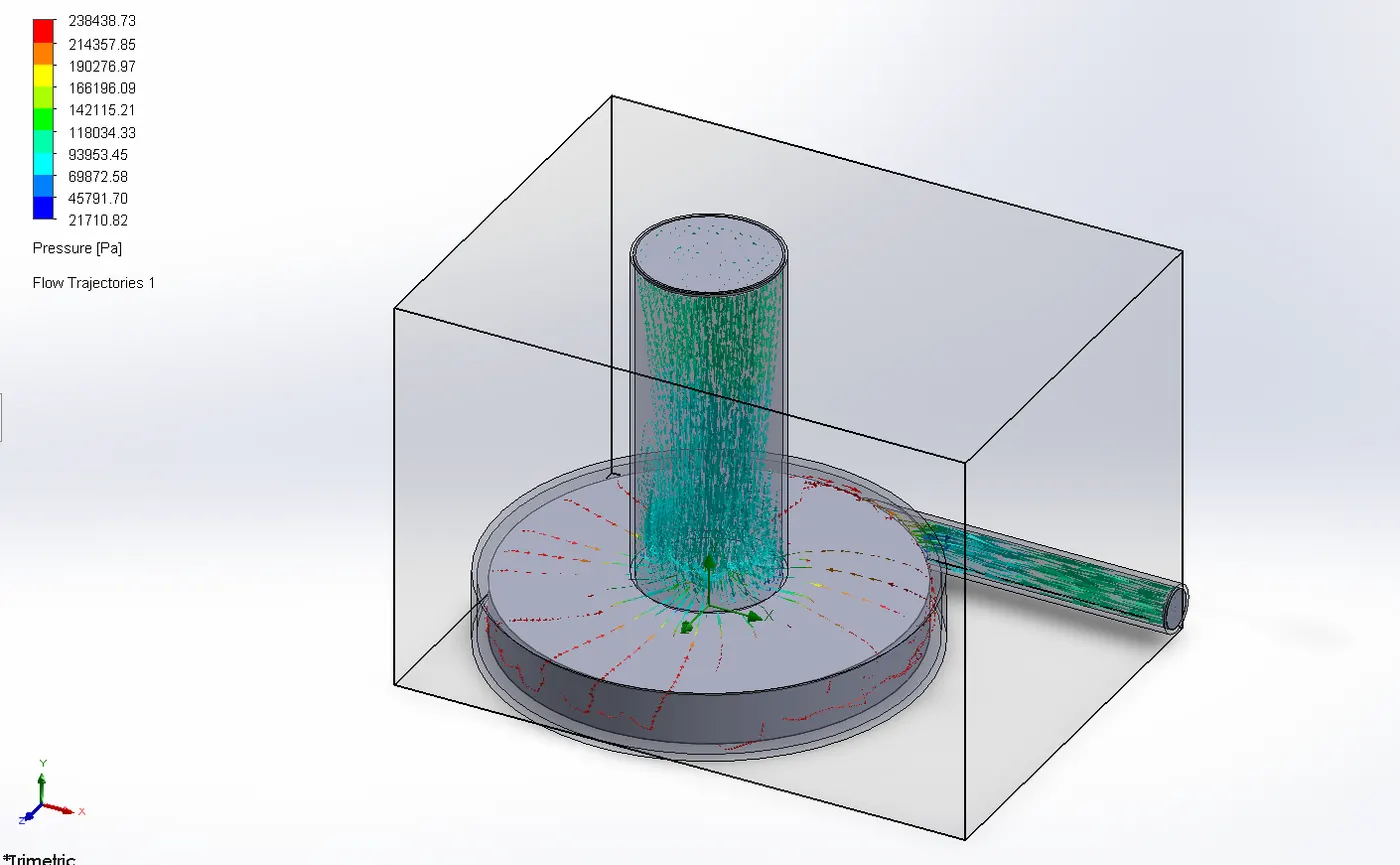
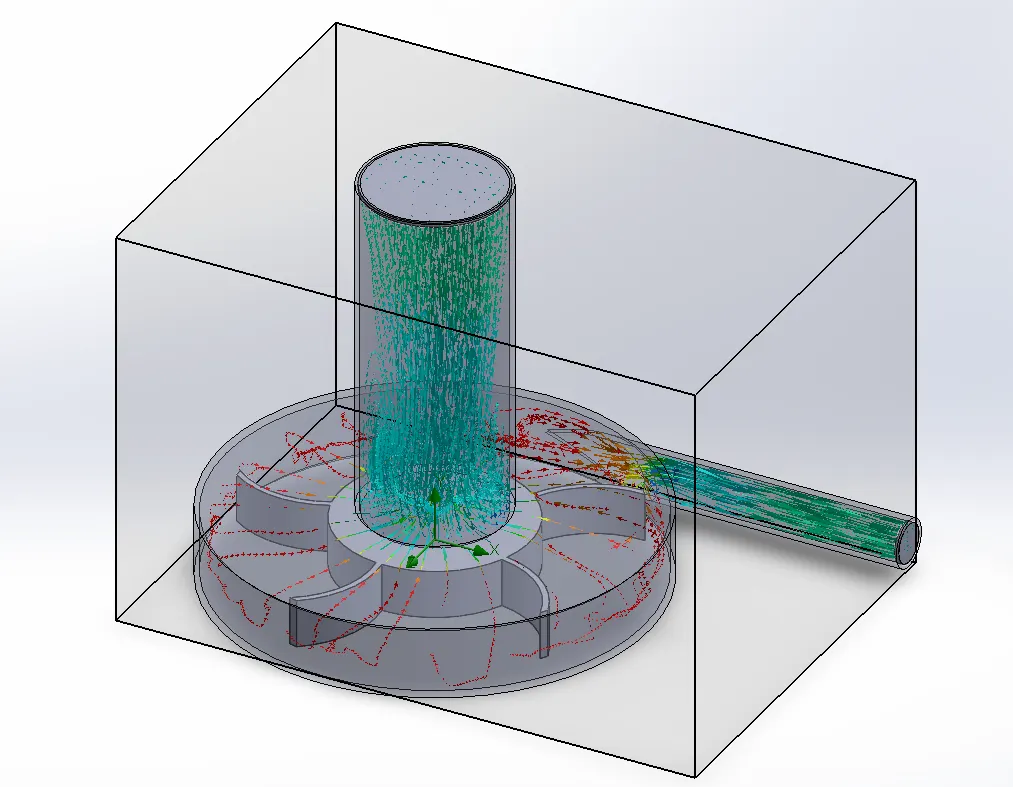
Performance diagram. Obtain the relationship between Pressure ratio and mass flow rate :
CONCLUSION
The performance diagram that depicts the relationship between pressure ratio and mass flow rate is a crucial tool for engineers and designers across various industries. It enables them to make informed decisions about system performance, efficiency, and safety, ultimately leading to more effective and reliable systems. Understanding this relationship is essential for achieving the desired balance between pressure ratio and mass flow rate in various applications.
REFERENCE
ChatGPT
https://www.solidworks.com/media/simulate-design-durability-complex-environments
https://www.goengineer.com/solidworks/simulation/solidworks-simulation