Basics of Probability and Statistics Week 1 Challenge
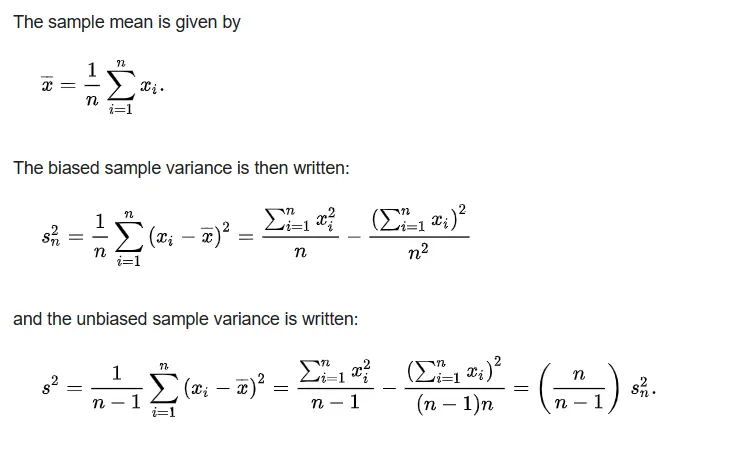
Ans 1) The difference in the formulas for population variance and sample variance is due to the concept known as Bessel's correction.
Bessel's correction:
Formula:
Proof:
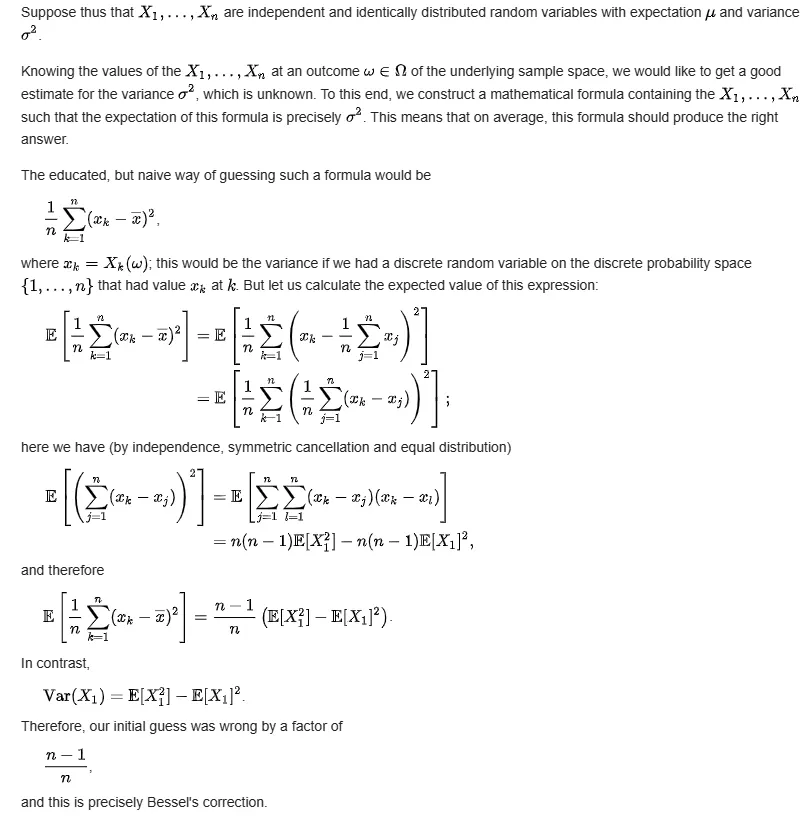
(Reference source: Wikipedia)
. When calculating variance for a sample, we divide by (n-1) instead of (n) to correct for the bias in the estimation of the population variance from the sample. This is because a sample tends to be less varied than the actual population, as it may capture all the variability present in the population.
A more detailed explanation of the above statements is as shown:
Population Variance: When we have data for the entire population, the variance is calculated using the formula:
σ2 = Σ(xi-μ)2/N
Where μ is the population mean, N is the size of the population and (x_i) are the individual values.
Sample variance: When we have a sample from the population, the variance is calculated using the formula:
s2 = Σ(xi-μ)2/(N-1)
where x bar is the sample mean, (x_i) is the individual sample values, and (n) is the sample size.
The (n-1) term in the sample variance formula is what applies to Bessel's correction, accounting for the fact that we're estimating the population variance from a sample. By using (n-1), we get an unbiased estimate of the population variance, which tends to be more accurate, especially for smaller sample sizes. This adjustment helps to compensate for the fact that the sample mean is just an estimate of the population mean and may not fully represent the population's variability.
Ans 2) The difference between stratified sampling and cluster sampling lies in how the subgroups within the population are formed and sampled:
Stratified Sampling:
- In stratified sampling, the population is divided into smaller groups, known as strata, based on shared attributes or characteristics.
- These strata are homogeneous internally, meaning the members within each stratum are similar to each other.
- The researcher manually creates these strata to ensure that they represent specific characteristics of the population.
- A random sample is then taken from each stratum.
- This method ensures that all the characteristics of interest are represented in the sample.
Cluster sampling:
- Cluster sampling divides the population into clusters that are heterogeneous or diverse.
- These clusters are naturally occurring groups, such as geographical areas or schools.
- Instead of sampling from each group, the researcher randomly selected the entire cluster.
- All members of the chosen clusters are included in the sample.
- It's a more cost-effective method, especially when dealing with a large population spread across a wide area.
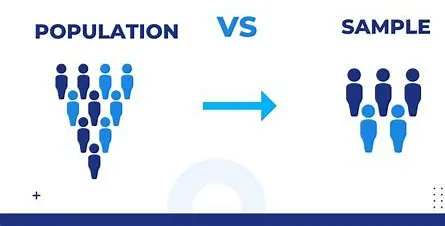
Ans 3) The number of samples that can be created from the population of size (N) depends on whether you are sampling with or without replacement, and whether the order of selection matters.
- Without replacement and Order, it doesn't matter: The number of different samples of size (n) is given by the combination formula C(N,n) = N!/(n!)(N-n)! Where (!) denotes the factorial.
- With replacement and order, it doesn't matter: The number of different samples of size (n) is given by the combination and replacement formula (C(N+n-1,n).
- Without replacement and order matters: The number of different order samples or permutations of size(n) is given by (P(N,n) = N!/(N-n)!.
- With replacement and order matters: The number of different ordered samples is (N^n) since each of the (n) elements in the sample can be any of the (N) possibilities.
for eg., if you have a population of 5 items and want to know how many different samples of 2 can be drawn without replacement, the calculation would be (C(5,2)= 5!/2!*(5-2)!= 10 different samples.
Ans 4) Probability of drawing 2 jacks from a standard deck of 52 playing cards can be calculated using the combinations since we are drawing the 2 cards without replacement and order. Here's how we can calculate it:
Different types of cards in a deck of 52 playing cards:
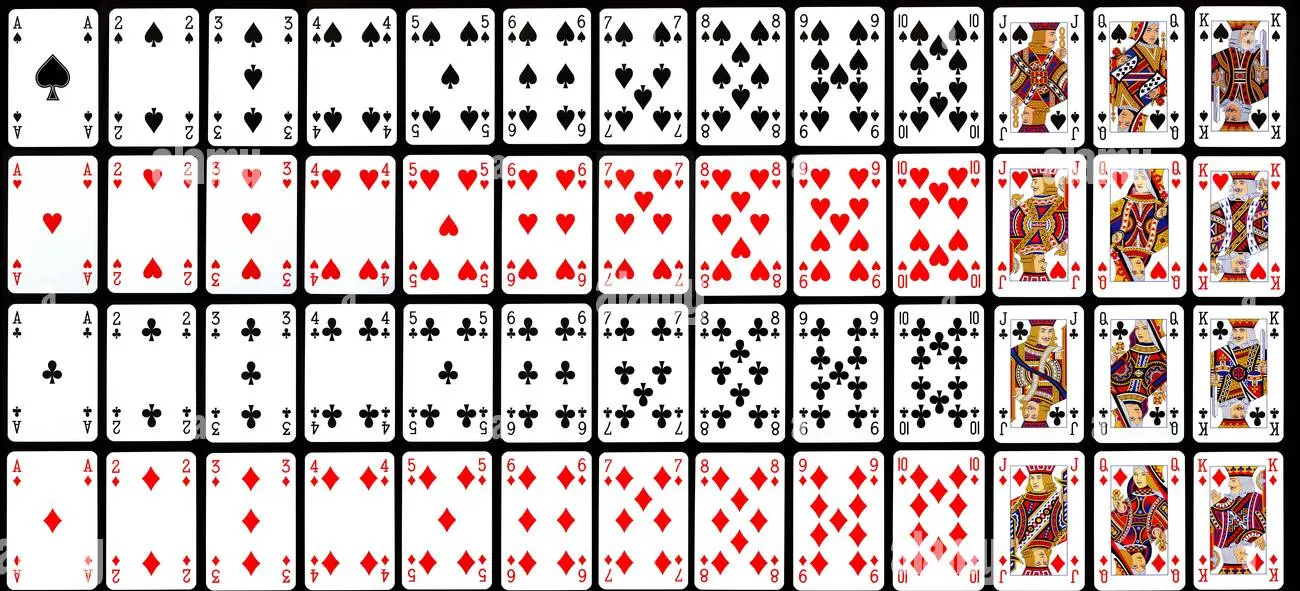
1. There are 4 jacks in a deck of cards.
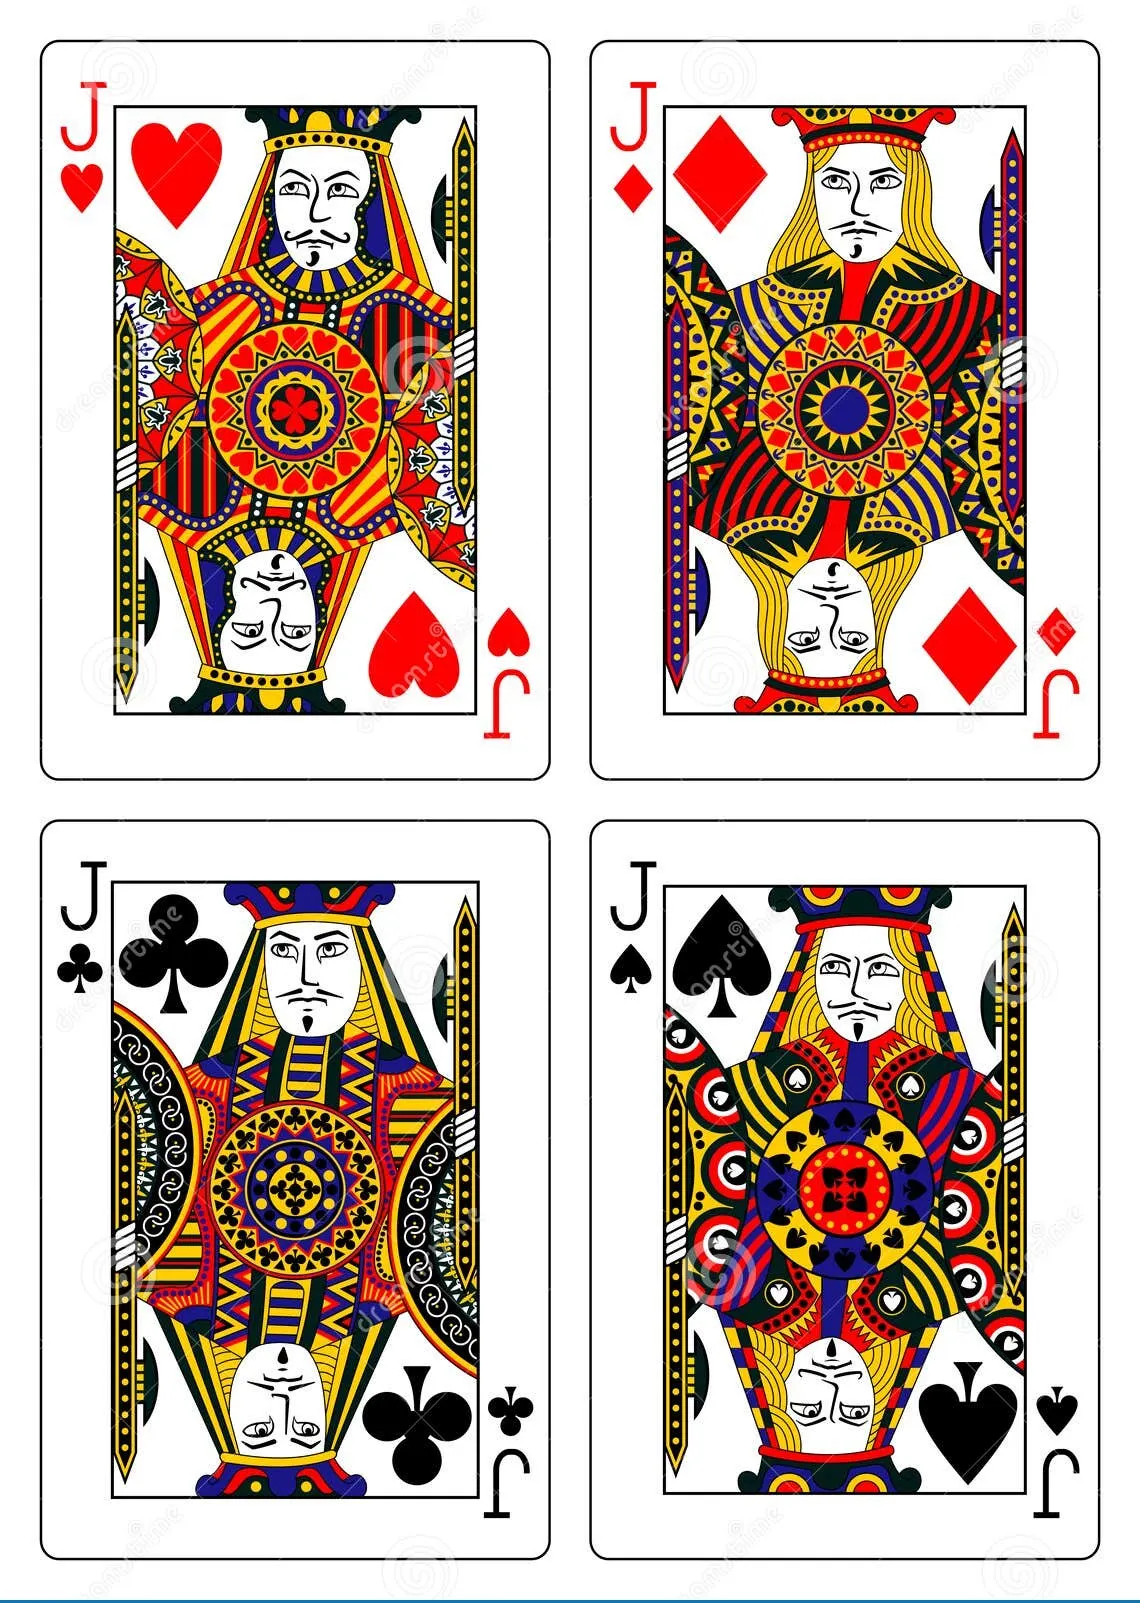
2. You want to draw 2 jacks out of these 4.
3 The number of ways to draw 2 jacks is the combination of 4 taken 2 at a time: (C(4,2)).
4. The total number of ways to draw any 2 cards from the deck is the combination of 52 cards taken 2 at a time: (C(52,2)).
Since the probability is = No. of favourable outcomes/ Total no. of outcomes
P = C(4,2)/C(52,2)
P= {4!/2!(4-2)!}/{52!/2!(52-2)!}
P= 6/26x51 = 6/1326
= 1/121
So, the Probability of drawing 2 jacks from a pack of cards is 1/121, or approximately 0.00452, which is about 0.452%.
Ans 5) Probability of drawing the same no. on pair of dice on rolling can be obtained as:
Since all the outcomes of rolling the dice can be represented as :
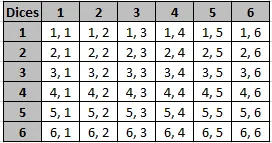
and we know the probability = No. of favourable outcomes / Total no. of outcomes
Favourable outcomes are (1,1),(2,2),(3,3),(4,4),(5,5),(6,6) = 6 and from the above table we could say total no. of outcomes are 6X6=36
Probability= 6/36 = 1/6 = 0.167
Ans 6) Standard deviation is often preferred over variance when measuring the dispersion of data because it is expressed in the same units as the data itself making it easier to interpret.
The formula of standard deviation,
SD= √Σ(xi-μ)^2/N ( same unit as that of dataset x)
where SD stands for standard deviation xi is each data point, N is the size of the dataset ( the number of data points), and μ is the mean.
Variance, on the other hand, is expressed in squared units, which can be less intuitive to understand.
As the variance formula is
Var = Σ(xi-μ)^2/N (Squared units of dataset x)
where Var stands for variance, xi is each data point, N is the size of the dataset ( the number of data points), and μ is the mean.
Here are a few reasons why standard deviation is commonly used:
Interpretability: Standard deviation is in the same units as the original data, which makes it easier to understand and communicate the variability.
Comparability: It allows for direct comparison between different datasets, which is not as straightforward with variance due to squared units.
Outlier Sensitivity: Standard deviation, by taking the square root of the variance, gives a measure that is less influenced by extreme values or outliers in the data.