Basics of Probability and Statistics Week 1 Challenge
1) Why there is a difference in the formula of variance for population and sample?
| Population | Sample | |
| Mean | 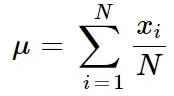 |
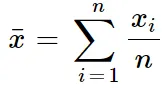 |
| Variance | 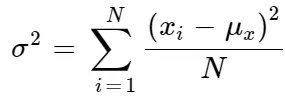 |
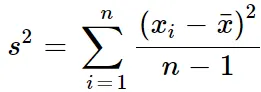 |
Population: Population is considering the entire category and mean is caluclated for entire category.
eg: To find the Population variance of score in maths of 10 students
Student 1 - 70
Student 2 - 53
Student 3 - 64
Student 4 - 97
Student 5 - 42
Student 6 - 89
Student 7 - 72
Student 8 - 100
Student 9 - 65
Student 10 - 73
Step 1: Calculate the mean
In the above, category is students marks in maths
`mean(mu) = (70+53+64+97+42+89+72+100+65+73)/10`
`=725/10`
=72.5
Step 2: Calculate the Population Variance
Variance: The deviation from the mean
(For Ref purpose:-`sigma^2=((70-72.5)^2+(53-72.5)^2+(64-72.5)^2+(97-72.5)^2+(42-72.5)^2+(89-72.5)^2+(72-72.5)^2+(100-72.5)^2+(65-72.5)^2+(73-72.5)^2)/10`)
| N | Mean | 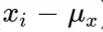 |
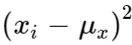 |
| 70 | 72.5 | -2.5 | 6.25 |
| 53 | 72.5 | -19.5 | 380.25 |
| 64 | 72.5 | -8.5 | 72.25 |
| 97 | 72.5 | 24.5 | 600.25 |
| 42 | 72.5 | -30.5 | 930.25 |
| 89 | 72.5 | 16.5 | 272.25 |
| 72 | 72.5 | -0.5 | 0.25 |
| 100 | 72.5 | 27.5 | 756.25 |
| 65 | 72.5 | 7.5 | 56.25 |
| 73 | 72.5 | 0.5 | 0.25 |
| Total | 3074.51 | ||
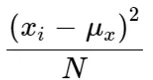 |
=3074.51/10 | 307.451 |
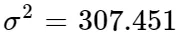
Standard Deviation
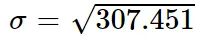
S.D=17.534
Sample: Randomly picking the data from population or picking up certain type of data from the entire popualtion to analyse the data is a sampling.
eg: To find the sample variance of score in maths of 10 students, we randomly pick marks of 4 students
Student 2 - 53
Student 3 - 64
Student 6 - 89
Student 10 - 73
Step 1: Calculate the mean
In the above, category is students marks in maths
`mean(x)=(53+64+89+73)/4`
`=279/4`
=69.75
Step 2: Calculate the Population Variance
Variance: The deviation from the mean
(For Ref purpose:-`s^2=((53-69.75)^2+(64-69.75)^2+(89-69.75)^2+(73-69.75)^2/4`)
| n | Mean |  |
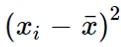 |
| 53 | 69.75 | -16.75 | 280.5625 |
| 64 | 69.75 | -5.75 | 33.0625 |
| 89 | 69.75 | 19.25 | 370.5625 |
| 73 | 69.75 | 3.25 | 10.5625 |
| Total | 694.75 | ||
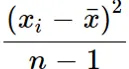 |
= 694.75/(4-1) | 231.583 |

SD = 15.217
The graph below shows the mean marks of population and sample of 10 and 4 students accordingly.
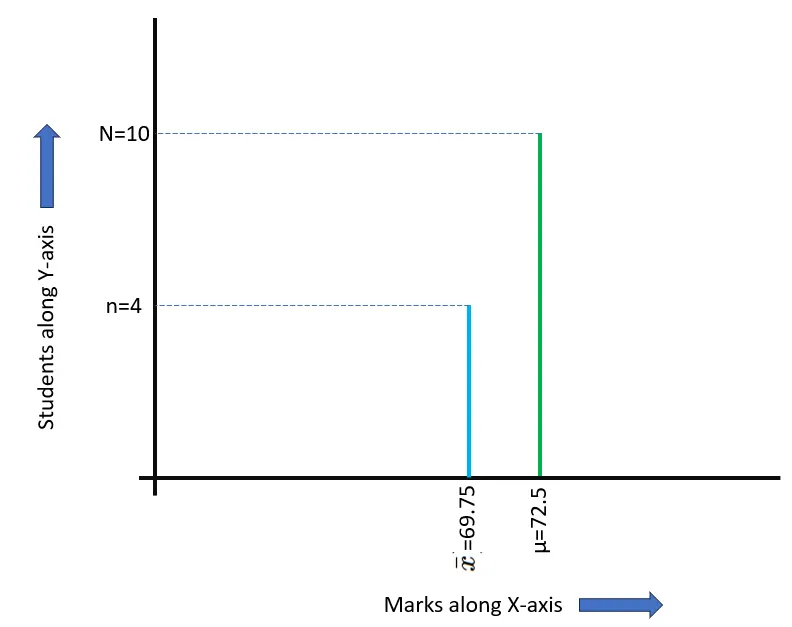
Sample variance would have a deviation of 15.217 from mean
In sample variance,
if we consider denomiator to be
(i) n, then S_sample variance = 13.17
(ii) n-1, then S_sample variance = 15.217
(iii) n-2, then S_sample variance = 18.627
(iv) n-3, then S_sample variance = 26.23
Justification for n-1 in denominator:
If we consider denominator to be n, then the devaition from the population variance is more than sample variance
To get the approx value closer to population variance we use (n-1).
In few cases it can be noted that (n-2),(n-3)....... would give a better approx value to population variance. But to standardize the procedure and limit the Degree of freedom n-1 is made as a default value for sample variance by researchers.
(if noted in the above example, n-2 gives an approx value to the population variance but we have considered only n-1 accroding to the standards)
in case of skewed data n-1 would give a better approximate value closer to population variance when compared to (n),(n-2),(n-3),....
So, sample variance is called as unbiased data to get a fair value.
2) Difference between stratified and clustered sampling
Let us assume population of animals in a forest consisting of Lion, Hippo, Elephant, Giraffee.
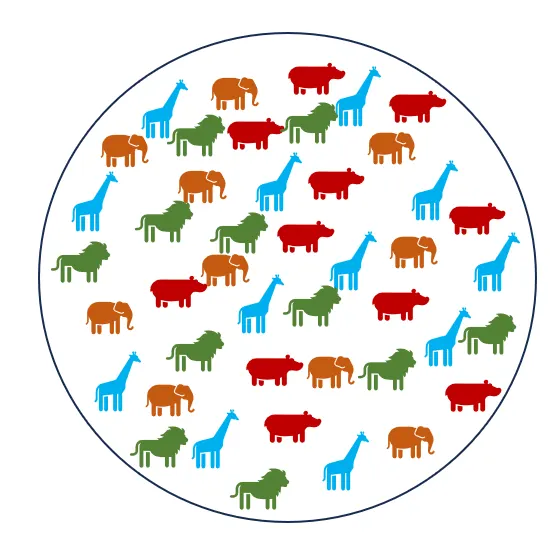
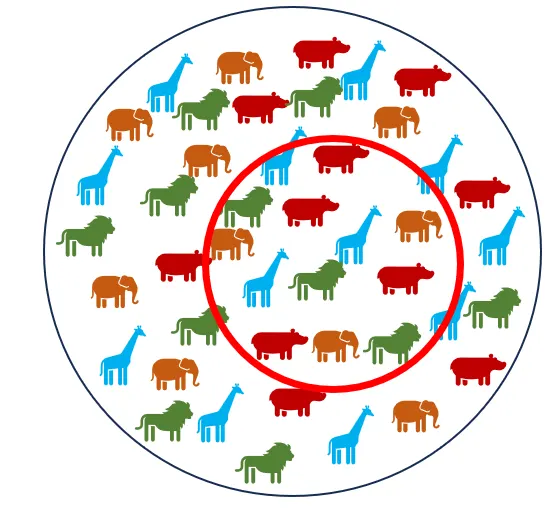
The sampling to be done on the red bounded area consiting of elements of sampling with Lion, Giraffee, Hippo and Elephant.
Stratified Sampling:
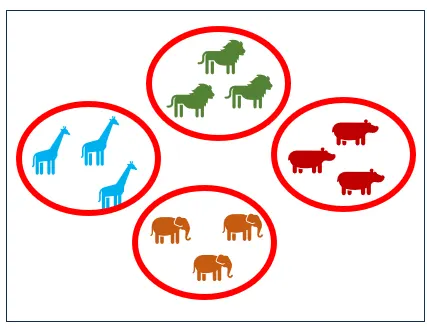
If we draw sample from population then we would have 4 stratas. Stratas are group of population which are divided on basis of common characterstics like size, colour, shape, functionality etc.,
one Group: within one stratas all elements will be alike(Homogeneous).
Entire Set: when comparing with other strata/group, every strata/group is same (Hetrogeneous)
(simple random sampling method is used as sampling method to draw sample from each strata)
(sample is drawn from all the stratas)
In the below example we have performed strafied sampling based on the animal shape and visual features.
Clustured sampling:
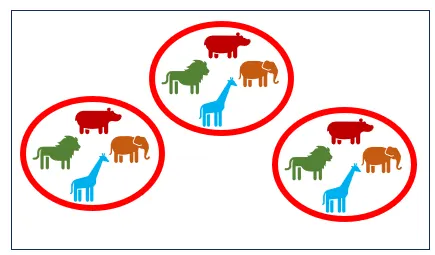
It is the true representation of the whole population.
one Group: withinin a group/cluster all elements will be different (Hetrogeneous)
Entire Set: when comparing with other cluster/group, every cluster/group is same (Homogeneous)
(Simple random sampling is used as sampling method and entire cluster is drawn as sampling data)
(only few cluster are used for sampling)
In the below example we have performed clustured sampling based on the animal shape and visual features.
3)How many different samples can be created out of population of size n?
The combination formula: NCn
Where,
N=Population Size
n=sample size
eg:
Total population is 10 and samplie is 4
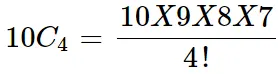
4) What is the probability of drawing 2 jacks from a pack of card
Total no of cards - 52
sample space of selecting 2 cards,
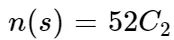
=(52 X 51)/(2 X1)
n(s) = 1326
sample space of selecting 2 jacks,
Total no of jack in a deck of cards - 4
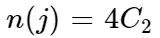
n(j)=(4 X 3)/(2 X 1)
n(j) = 6
Probability of drawing 2 Jacks
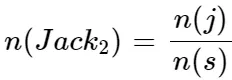
= 6/1326
n(jack_2) = 1/122
5) What is the probability that both the numbers on dice are same while rolling 2 dice
Dice has 6 sides
No of elements when rolling 2 dice = 6 X 6 = 36outcomes
{(1,1) ,(1,2) , (1,3) , (1,4) , (1,5) , (1,6) ,
(2,1) ,(2,2) , (2,3) , (2,4) , (2,5) , (2,6) ,
(3,1) ,(3,2) , (3,3) , (3,4) , (3,5) , (3,6) ,
(4,1) ,(4,2) , (4,3) , (4,4) , (4,5) , (4,6) ,
(5,1) ,(5,2) , (5,3) , (5,4) , (5,5) , (5,6) ,
(6,1) ,(6,2) , (6,3) , (6,4) , (6,5) , (6,6)}
There are 6 possibilities of getting same no on both dice, (1,1) ,(2,2) ,(3,3) ,(4,4) ,(5,5) & (6,6)
Probability of getting exactly 2 nos on the dice,n(s)
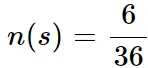
n(s)=1/6
6) Why standard deviation when variance can measure the dispersion in data?
Variance: It gives the proper measure of dispersion in a data set. Variance shows the sacttering or dispersion of data from mean.
Standard Deviation: Variance involves the sum of squares, the proper measure of disperion from the mean for set a observation is the square root of variance.