Basics of ML & AL Week 2 Challenge
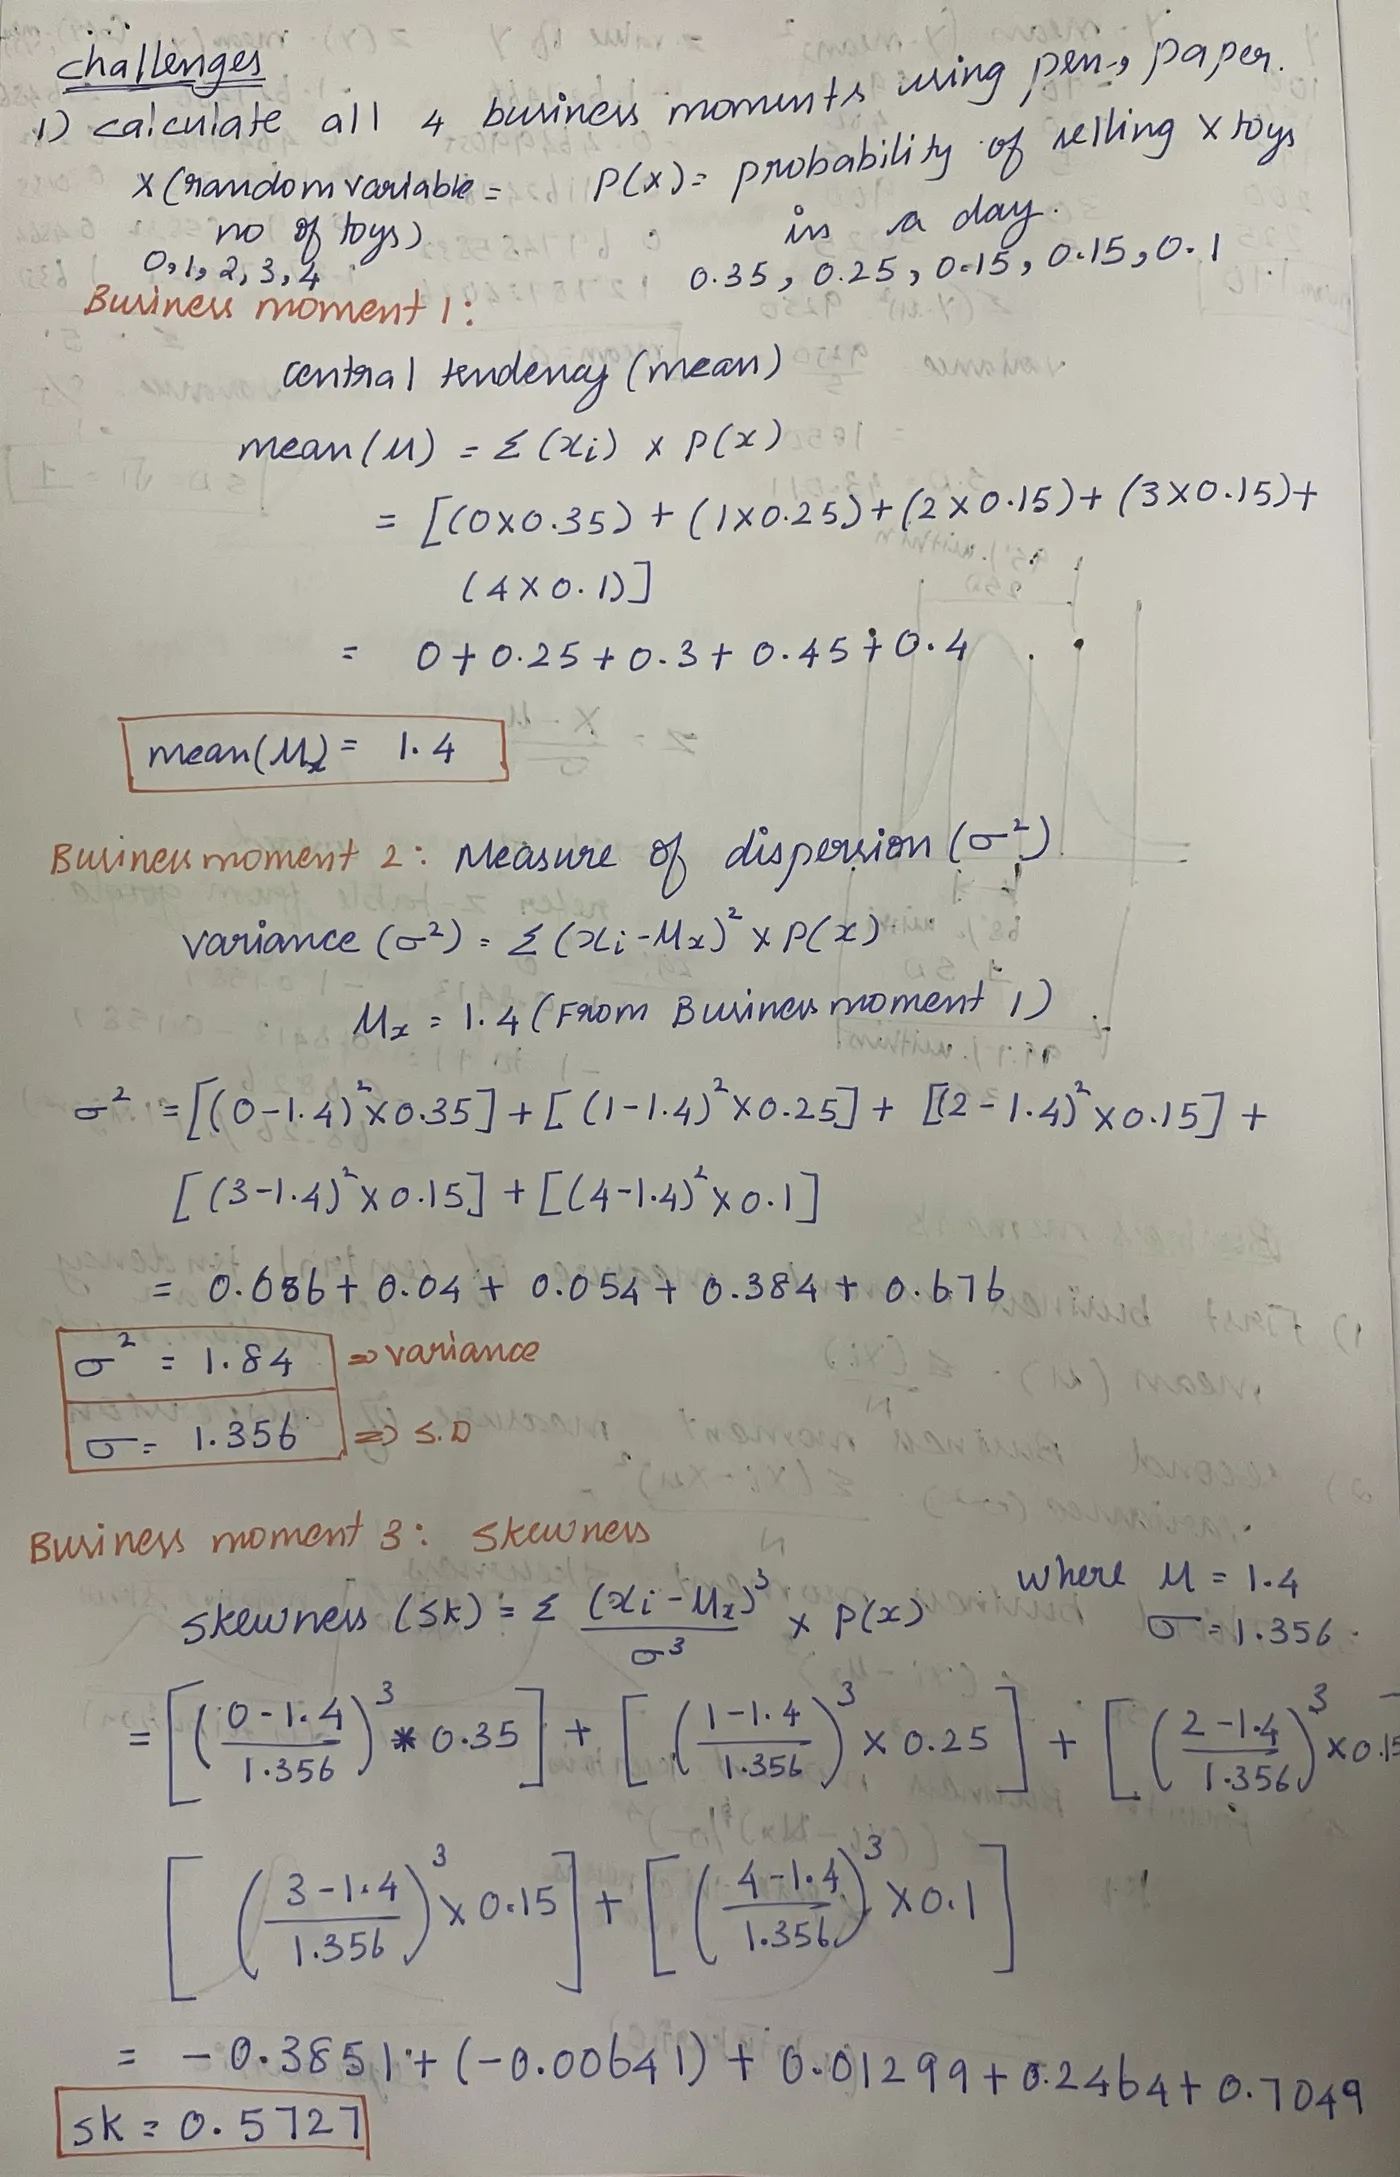
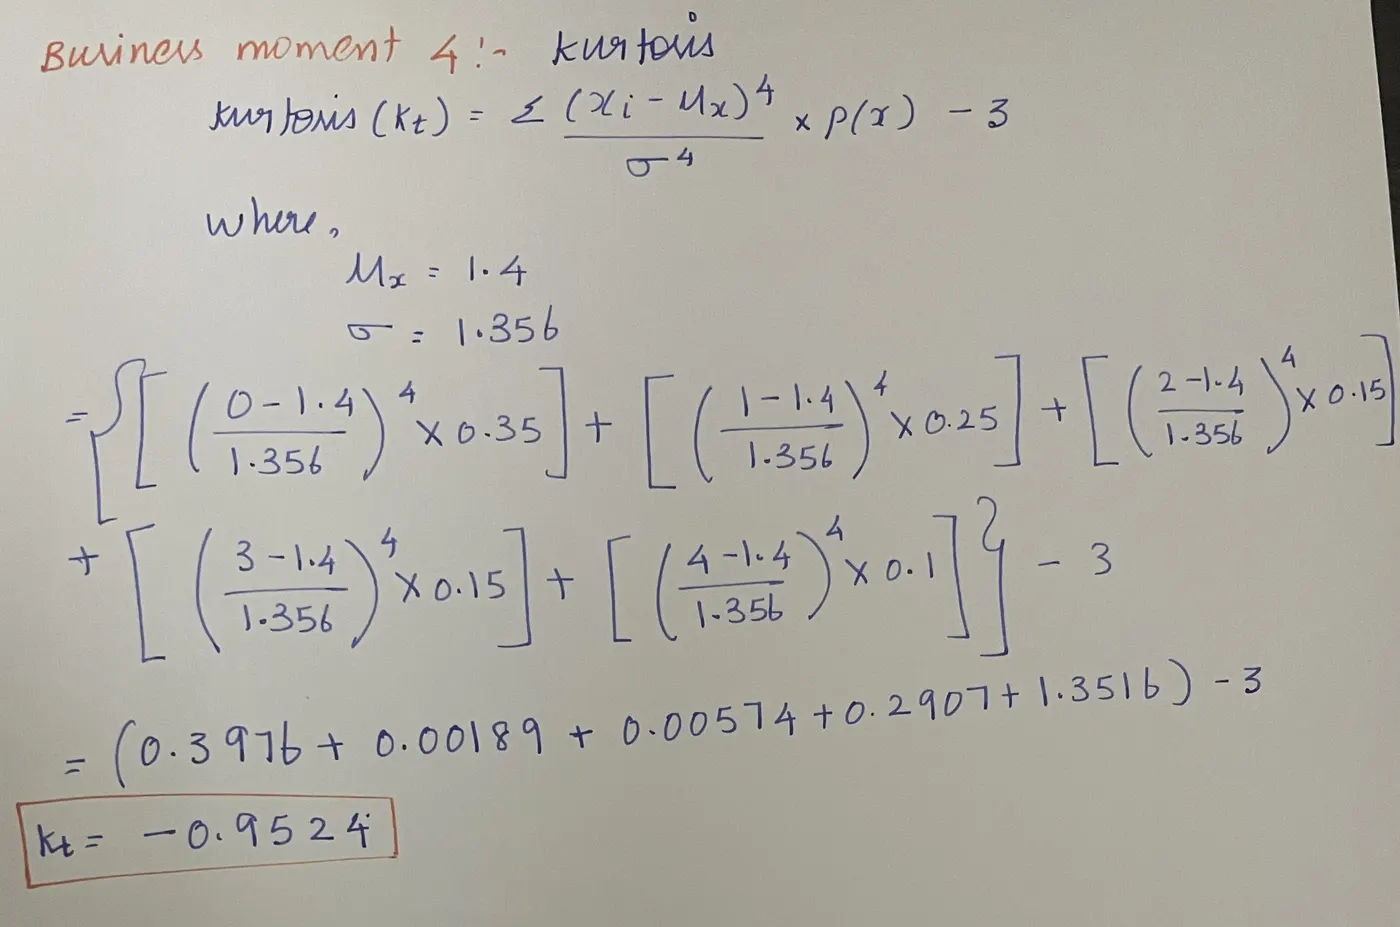
1)Calculate all 4 business moments using pen and paper for the below data set?
Solution:
Business Moment 1: Mean(`mu`) = 1.4
Business Moment 2: Variance = 1.84, SD = 1.356
Business Moment 3: Skewness(sk) = 0.5727
Business Moment 4: Kurtosis(kt) = - 0.9542
2)What is the significance of expected value when simple mean (Sum of all observations/number of observations) is already in place
Expected value: It is the Probability of an event multiplied by the amount of time the event happens in case of smaller studies.
The number of observations can be noted accordingly and the mean can be derived using the formaula = Sum of all observations/number of observations
A Probability Function defines the relative frequency outcomes of a random variable - the expected value is determinded using sample study.
In case of infinite number of Observations, it is very difficult to note each and every outcome. In such cases the probability of each outcome is determined using this probability. The formula is :
μ=∑x⋅P(x)
Simple Mean : In case of Finite number of Observations the sample mean is calculated by (Sum of all observations/number of observations) .
3)Having skewness in the curve considered to be bad in the analysis?
In case of bell curve or Normal distribution curve, there is no thumb rule stating the curve has to be symmetry.
In many data set the curve will be assymetric too. For assymetric curve, the data concentration is indicated by skewness.
The skewness indicates a lot about the variation in mean, median and mode.
The skewness are classified based on outliners.
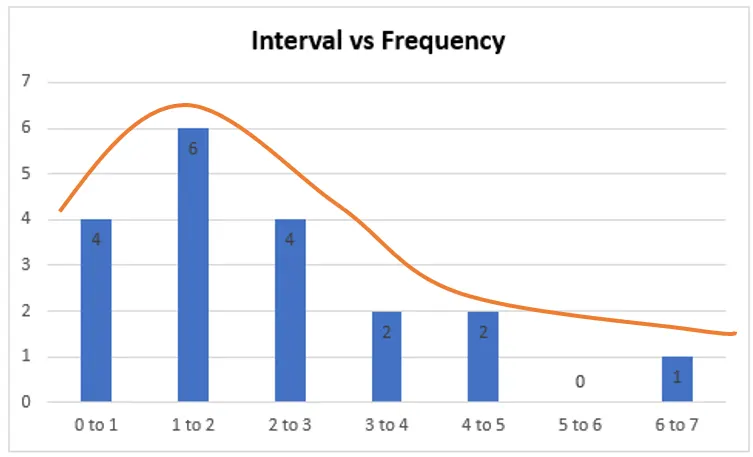
1) Eg of right skew
Dataset 1: 1,1,1,1,2,2,2,2,2,2,3,3,3,3,4,4,5,5,7
| Interval | Frequency |
| 0 to 1 | 4 |
| 1 to 2 | 6 |
| 2 to 3 | 4 |
| 3 to 4 | 2 |
| 4 to 5 | 2 |
| 5 to 6 | 0 |
| 6 to 7 | 1 |
Mean = 2.71
Median = 2
Mode = 2
Inferences:
From the above graph it can be seen the data is a right skew as the outliers are on right.
It can also be noted the curve is not symmetry and most of the data is concentrated towards the left.
Additonally, it can be noted that Mean > Median
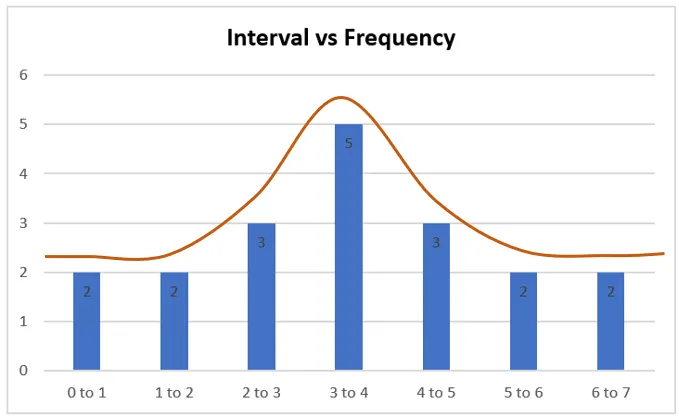
2) Eg of zero skew
Dataset 1: 1,1,2,2,3,3,3,4,4,4,4,4,5,5,5,6,6,7,7
| Interval | Frequency |
| 0 to 1 | 2 |
| 1 to 2 | 2 |
| 2 to 3 | 3 |
| 3 to 4 | 5 |
| 4 to 5 | 3 |
| 5 to 6 | 2 |
| 6 to 7 | 2 |
Mean = 4
Median = 4
Mode = 4
Inferences:
From the above graph it can be seen the data is a zero skew.
It can also be noted the curve is symmetry and the data is concentrated in the centre.
Additonally, it can be noted that Mean = Median = Mode
3) Eg of left skew
Dataset 1: 1,2,3,3,4,4,4,5,5,5,5,6,6,6,6,6,6,7,7,7
| Interval | Frequency |
| 0 to 1 | 1 |
| 1 to 2 | 1 |
| 2 to 3 | 2 |
| 3 to 4 | 3 |
| 4 to 5 | 4 |
| 5 to 6 | 6 |
| 6 to 7 | 3 |
Mean = 4.9
Median = 5
Mode = 6
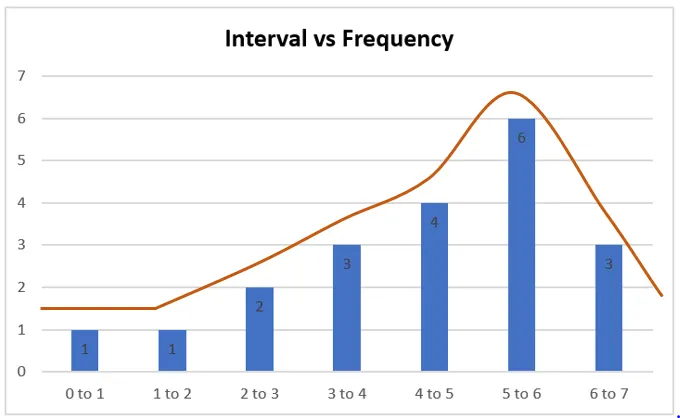
Inferences:
From the above graph it can be seen the data is a left skew.
It can also be noted the curve is asymmetry and the data is concentrated in the left.
Additonally, it can be noted that Mean < Median
4)Evaluate the probabilities for continuous normal distribution with given mean = 680 and standard deviation = 31
a)P(X<711)
b)P(X>740)
c)P(600)<x<720)< p=""></x<720)<>
d)P(X=720)
Continuous Normal Distribution (Z) = (observation-mean)/Standard Deviation
a) P(X<711)
X=711,(μ+1σ)
711=P(680+31)
P(680) = 50% area to the left of the curve from the mean(0.5)
P(31) = area from the mean to the 31 values to the right
1σ = 68%
σ/2= half corresponds to 34%(0.34)
Then P(X<711) = P(680+31)
= 0.5 + 0.34
=0.84
Therefore the probability of 711 and the area covered is 84%
b)P(X>740)
Z=(740-680)/31
=1.935
The z(1.935) corresponds to the value of P(X<740)
From Z-table, P(Z<1.935) = 0.9735
then,P(X>740) = 1-0.9735
= 0.0265
c)P(600<X<720)<x<720)< p=""></x<720)<>
We have to determine the probability of area between 600 and 720.
For 600:
Z=(600-680)/31 = -2.58
From Z-table, Z(-2.58) = 0.0049
= 0.0049
For 720:
Z=(720-680)/31 = 1.29
From Z-table, Z(1.29) = 0.9015
P(-2.58<z<1.29) = P(Z<1.29)-P(z<-2.58)
=0.9015 - 0.0049
=0.8966
d)P(X=720)
Z = (720 - 680) / 31
= 1.29
Z(1.29) = 0.9015
P(Z=1.29) = P(1.29<Z<Z1.29)
= 0.9015 - 0.9015
= 0
5)Explain the curve on the right side
The above corresponds to the Probability Distribution curve.
The curve is symmetry and is 50% above the mean and 50% below the mean.
From the mean, 34.1% lie between mean and (μ−1σ) and 34.1 % lie between mean and (μ+
1σ)
From the mean, 34.1%+13.6%(47.7%) ( lie between mean and (μ−2σ) and 34.1%+13.6%(47.7%) lie between mean and (μ + 2σ)
Additionally,
From the mean, 34.1%+13.6%+2.15%(99.7%) ( lie between mean and (μ−3σ) and 34.1%+13.6%2.15%(99.7%)(99.7%) lie between mean and (μ + 3σ)