MATLAB Project 2 - Parsing NASA thermodynamic data using MATLAB
Aim:-
To write a program
  - To extract the NASA thermodynamics co-efficient of each species
  - Evaluate the specific heat, enthalpy, entropy using the given function
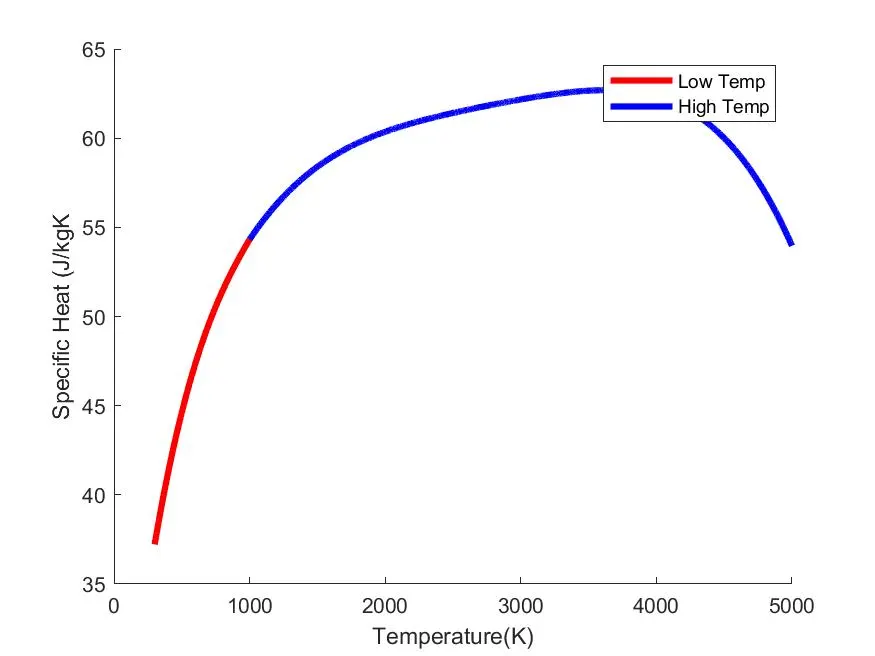
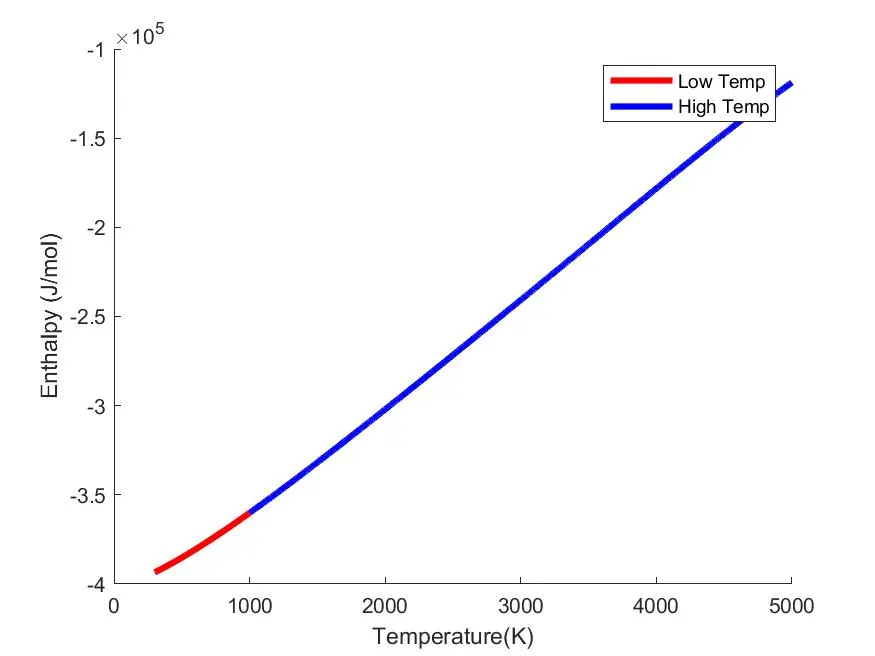
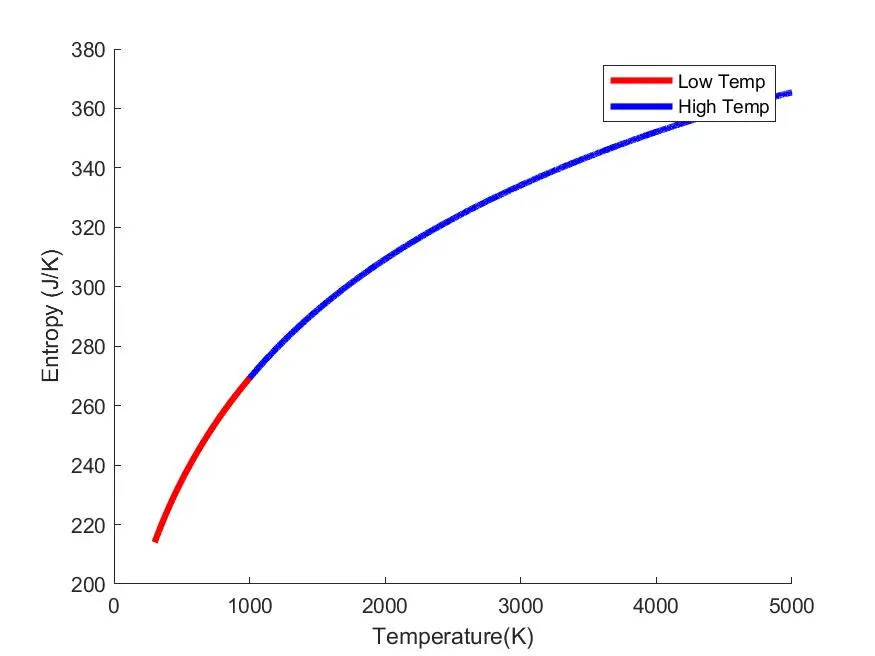
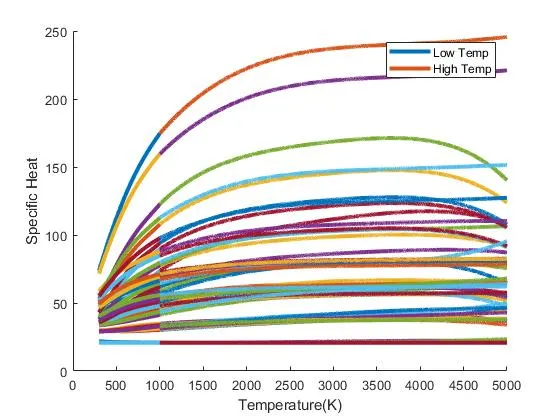
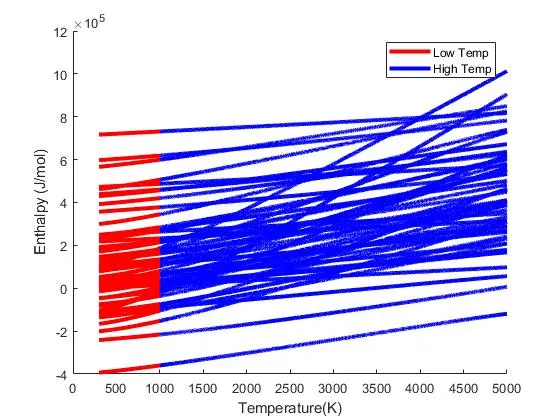
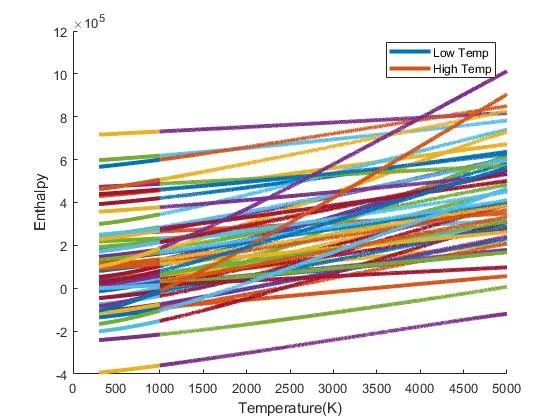
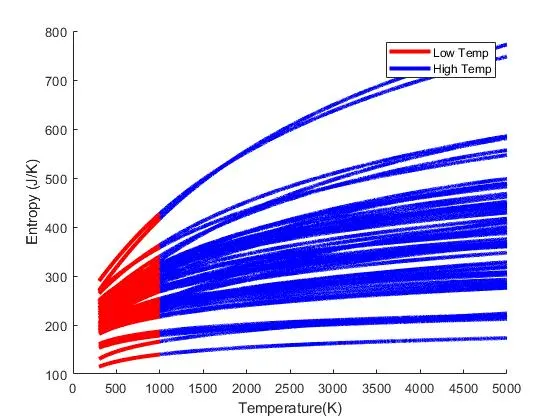
  - To plot Temperature(higher and lower) vs specific heat,enthalpy,entropy
  - To save the plots in each folder for different species
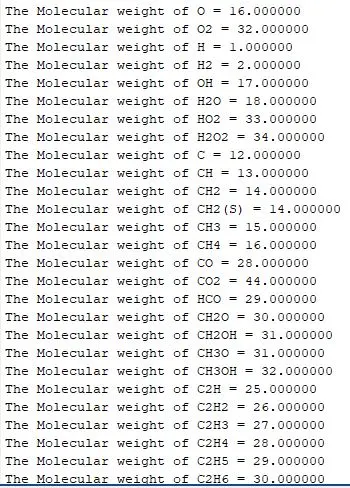
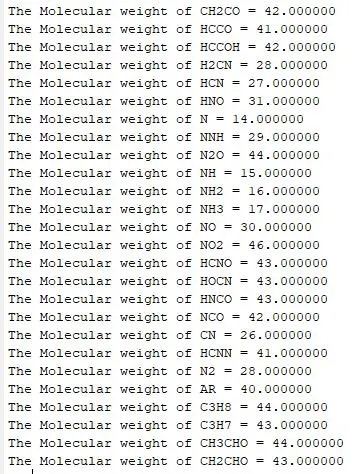
  - To calculate the Molecular weight of each species
Given Formula for calculating Specific heat, enthalpy, entropy:-
`(Cp)/R = a1 + a2*t + a3*t^2 + a4*t^3 + a5*t^4`
`H/(Rt) = a1 + a2*(t/2) + a3*(t^2/3) + a4*(t^3/4) + a5*(t^4/5) + a6/t`
`S/R = a1*ln(t) + a2*t + a3*t^2/2 + a4*t^3/3 + a5*t^4/4 + a7`
Theory:-
Specific Heat:-
The specific heat is the amount of heat per unit mass required to raise the temperature by one degree Celsius. Unit is J/K.
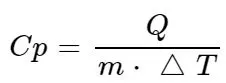
Cp - Specific heat
Q - Heat addition/Heat Rejection
m-mass
T-change in temperature.
Enthalpy:-
Enthalpy is the heat content of a system. The enthalpy change of a reaction is equivalent to the amount of energy lost or gained during the reaction. Unit is J.
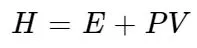
H - Enthalpy
E - Internal energy
P - Pressure
V - Volume
Entropy:-
Entropy, the measure of a system's thermal energy per unit temperature that is unavailable for doing useful work.Unit is J/K
Molecular Weight:-
Molecular weight is a measure of the sum of atomic weight values of atoms in a molecular weight.
Syntax used:-
fopen('file_name','r') - open a file and read
fgetl(input) - Read a line
strsplit - split a line based on the constants provided as input
str2num - convert string to number
str2double – convert string to double precision
x=input(prompt) - to enter a input and perform a particular operation
while ~feof(input) - returns the value 1 or 0
strcmp - compare between 2 strings
mkdir(input) - make a new folder
cd(input) - change the directory
fprintf('constant') - used to print the content of the file
Logic followed:
Logic used:-

1) File is opened and read using "fopen"
2) For each line like topic and comments are extracted using "fgetl(file_name)"
3) Individual global temperature are extracted (global high temperature, global mid temperature, global low temperature) and converted to number using "str2num"
4) used "while ~feof" used for creating a series of operation for individual species.
5) strcmp(species_name,END) used to compare and to terminated using "break"  when reads END.
6) Individual co-efficient of the species is extracted and string converted to number.
7) Range of temperature for low(t) and high(T) temperature is assigned using "range operator"
8) Function is called to get the required specific heat, enthalpy and entropy  values for low and high temperature respectively.
9) "CD" is used to change the directory and create mkdir for creating new individual folder for individual species.
10) The corresponding values are plotted for temperature(high and low) vs Specific Heat, Enthalpy and Entropy.
11) Each plots are saved "saveas" command in the individual folder. the directory is changed to perform the next series of operation for a different species.
11)  Calling the function to calculate the molecular weight of individual species and print the values "fprintf"
12) When the loop is completed the file is closed "fclose(filename)"
MAIN PROGRAM

clear all
close all
clc

% Opening the Thermo file
a=fopen('THERMO.dat','r');

% Extracting the Header(1st Line)
topic = fgetl(a);

% Extracting global Temperature as string(2nd Line)
% Getting the line
global_temp_str = fgetl(a);
%splitting the values as a integer
global_temp = strsplit(global_temp_str,' ');
% Removing the 1st space
remove_1st_space = str2num(global_temp{1});
% Extracting Global Lower,middle and Higher temperature as number
global_low_temp = str2num(global_temp{2});
global_mid_temp = str2num(global_temp{3});
global_high_temp = str2num(global_temp{4});


% reading the comments of the next 3 lines,
for i=1:3;
    comment=fgetl(a);
end

% "Input" displays the text in prompt and waits for the user to enter the input
% In our program if we want the output of particlar species then the
% required species can be entered as input

% z=input('enter species name:','s');

% "while ~feof(file_name)
% (if 1, foef returns the set of operation performed as a series until the the end of file indicator)
% (if 0, foef doesn't returns the previous operation set)
while ~feof(a)
    line_1 = fgetl(a);
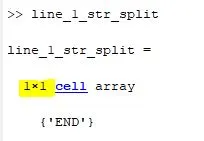
    line_1_str_split =strsplit(line_1,' ');
    species_name = line_1_str_split{1};


% "strcmp" text are compared for identical based on the inputs and returns 0 and 1.
% (1-true, not identical)
% (0-false, identical)
% END is the last line in the document
% when "while" function performs set of series of operation when series reached END, the operation has to be terminated
% The BREAK command termiantes/declares the end of the document
    if strcmp(line_1_str_split{1},'END')
        break;
    end

% When declaring a single species/single plot of single species is required
% (z from input)
% " if(strcmp(input(prompt),variable)==1 compares the operand and returns the value"
%    if(strcmpi(z,species_name))==1;
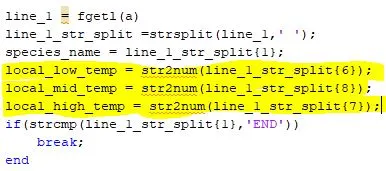
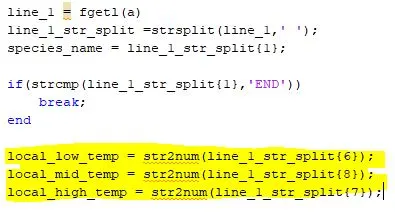
    local_low_temp = str2num(line_1_str_split{6});
    local_mid_temp = str2num(line_1_str_split{8});
    local_high_temp = str2num(line_1_str_split{7});

    % Extracting the co-efficient of individual species
    line_2 = fgetl(a);
    line_3 = fgetl(a);
    line_4 = fgetl(a);
    line2_str = findstr(line_2,'E');
    line3_str = findstr(line_3,'E');
    line4_str = findstr(line_4,'E');

% Extracting the co-efficients(a1 - a14) as string
    a1_str = line_2(1:line2_str(1)+3);
    a2_str = line_2(line2_str(1)+4:line2_str(2)+3);
    a3_str = line_2(line2_str(2)+4:line2_str(3)+3);
    a4_str = line_2(line2_str(3)+4:line2_str(4)+3);
    a5_str = line_2(line2_str(4)+4:line2_str(5)+3);
    a6_str = line_3(1:line3_str(1)+3);
    a7_str = line_3(line3_str(1)+4:line3_str(2)+3);
    a8_str = line_3(line3_str(2)+4:line3_str(3)+3);
    a9_str = line_3(line3_str(3)+4:line3_str(4)+3);
    a10_str = line_3(line3_str(4)+4:line3_str(5)+3);
    a11_str = line_4(1:line4_str(1)+3);
    a12_str = line_4(line4_str(1)+4:line4_str(2)+3);
    a13_str = line_4(line4_str(2)+4:line4_str(3)+3);
    a14_str = line_4(line4_str(3)+4:line4_str(4)+3);

% Converting the co-efficients string to number
    a1 = str2num(a1_str);
    a2 = str2num(a2_str);
    a3 = str2num(a3_str);
    a4 = str2num(a4_str);
    a5 = str2num(a5_str);
    a6 = str2num(a6_str);
    a7 = str2num(a7_str);
    a8 = str2num(a8_str);
    a9 = str2num(a9_str);
    a10 = str2num(a10_str);
    a11 = str2num(a11_str);
    a12 = str2num(a12_str);
    a13 = str2num(a13_str);
    a14 = str2num(a14_str);

% Inputs
    R = 8.3145;
    t = global_low_temp:1:global_mid_temp;
    T = global_mid_temp:1:global_high_temp;

% Function to determine specific heat,enthalpy,entropy for higher temperature
    for i = 1:length(T);
        [cplow,Hlow,Slow] = File_parsing_low_temp(a1,a2,a3,a4,a5,a6,a7,T(i),R);
        CP_low(i) = cplow;
        H_low(i) = Hlow;
        S_low(i) = Slow;
    end

% Function to determine specific heat,enthalpy,entropy for lower temperature
    for j = 1:length(t)
        [cphigh,Hhigh,Shigh] = File_parsing_high_temp(a8,a9,a10,a11,a12,a13,a14,t(j),R);
        CP_high(j) = cphigh;
        H_high(j) = Hhigh;
        S_high(j) = Shigh;
    end

% Changing the directory to save the output (plots) inside the folder
    cd('E:MATLAB CODESfile_parsingfiles')

% Creating a new folder based on species name
    mkdir(species_name)

% Creating plots for temperature(high temperature and low temperature) vs specific heat
    figure(1)
    hold on
    plot(t,CP_high,'linewidth',3,'color','r');
    plot(T,CP_low,'linewidth',3,'color','b');
    xlabel('Temperature(K)')
    ylabel('Specific Heat (J/kgK')
    legend('Low Temp','High Temp')

% Creating plots for temperature(high temperature and low temperature) vs Enthalpy
    figure(2)
    hold on
    plot(t,H_high,'linewidth',3,'color','r');
    plot(T,H_low,'linewidth',3,'color','b');
    xlabel('Temperature(K)')
    ylabel('Enthalpy (J/mol)')
    legend('Low Temp','High Temp')

% Creating plots for temperature(high temperature and low temperature) vs Entropy
    figure(3)
    hold on
    plot(t,S_high,'linewidth',3,'color','r');
    plot(T,S_low,'linewidth',3,'color','b');
    xlabel('Temperature(K)')
    ylabel('Entropy (J/K)')
    legend('Low Temp','High Temp')

% Changing the directory for the plots to save in the respective species folder
    cd(species_name)
    saveas(figure(1),sprintf('T vs cp.jpg','jpeg'));
    saveas(figure(2),sprintf('T vs H.jpg','jpeg'));
    saveas(figure(3),sprintf('T vs S.jpg','jpeg'));

% Closing the plots to perform next series of operation(species)
    close all

% Changing the directory back to the main operating folder
cd('E:MATLAB CODESfile_parsing')

% Function for calculating the molecular weight
[molecular_weight] = mol_wt(species_name);

% To print the values of molecular weight for all the species
fprintf('The Molecular weight of %s = %fn',species_name,molecular_weight);

end
% end

% Closing the file
fclose(a);
Function for Specific Heat, Enthalpy and Entropy:-
1) Seperate function for calculating the Specific heat, enthalpy and entropy for high and low temperature.
a) Low Temperature
b) High Temperature
2) A single function for calculating the Specific heat, enthalpy and entropy for high and low temperature.
1) Separate function for calculating the Specific heat, enthalpy and entropy for high and low temperature:
a) Low Temperature
function [cphigh,Hhigh,Shigh] = File_parsing_high_temp(a8,a9,a10,a11,a12,a13,a14,t,R)

cphigh = (a8 + a9.*t  + a10.*t .^2 + a11.*t .^3 + a12.*t .^4).*R;

Hhigh = (a8 + a9.*t./2 + a10.*(t.^2)./3 + a11.*(t.^3)./4 + a12.*(t.^4)./5 + a13./t).*t.*R;

Shigh = (a8.*log(t) + a9.*t  + a10.*(t .^2)./2 + a11.*(t .^3)./3 + a12.*(t .^4)./4 + a14).*R;

end
b) High Temperature
function [cplow,Hlow,Slow] = File_parsing_low_temp(a1,a2,a3,a4,a5,a6,a7,T,R)

    cplow = (a1 + a2.*T + a3.*T.^2 + a4.*T.^3 + a5.*T.^4).*R;

    Hlow = (a1 + a2.*T./2 + a3.*(T.^2)./3 + a4.*(T.^3)./4 + a5.*(T.^4)./5 + a6./T).*T.*R;

    Slow = (a1.*log(T) + a2.*T + a3.*(T.^2)./2 + a4.*(T.^3)./3 + a5.*(T.^4)./4 + a7).*R ;

end
2) A single function for calculating the Specific heat, enthalpy and entropy for high and low temperature:
Main program function Code:-
[T,t,CPL,CPH,HL,HH,SL,SH] = specific_heat(a1,a2,a3,a4,a5,a6,a7,a8,a9,a10,a11,a12,a13,a14,global_low_temp,global_mid_temp,global_high_temp,R)Function:-
function [t,T,CPL,CPH,HL,HH,SL,SH] = specific_heat(a1,a2,a3,a4,a5,a6,a7,a8,a9,a10,a11,a12,a13,a14,global_low_temp,global_mid_temp,global_high_temp,R)

t = (global_low_temp:1:global_mid_temp);
T = (global_mid_temp:1:global_high_temp);

CPL = (a1 + a2.*T + a3.*T.^2 + a4.*T.^3 + a5.*T.^4).*R

HL = (a1 + a2.*T./2 + a3.*(T.^2)./3 + a4.*(T.^3)./4 + a5.*(T.^4)./5 + a6./T).*T.*R

SL = (a1.*log(T) + a2.*T + a3.*(T.^2)./2 + a4.*(T.^3)./3 + a5.*(T.^4)./4 + a7).*R

CPH = (a8 + a9.*t  + a10.*t .^2 + a11.*t .^3 + a12.*t .^4).*R

HH = (a8 + a9.*t./2 + a10.*(t.^2)./3 + a11.*(t.^3)./4 + a12.*(t.^4)./5 + a13./t).*t.*R

SH = (a8.*log(t) + a9.*t  + a10.*(t .^2)./2 + a11.*(t .^3)./3 + a12.*(t .^4)./4 + a14).*R

end
Function for Molecular Weight
function [mw] = mol_wt(z)

S_atomic = ['H','C','N','O','AR'];
atomic_mass = [1 12 14 16 40];
mw = 0;
position = 0;


for q = 1:length(z);
    for p = 1:length(atomic_mass);
        if strcmp(z(q),S_atomic(p));
        mw = mw + atomic_mass(p);
        position=p;
        end
    end
    n = str2double(z(q));

    if n > 1
    mw = mw+atomic_mass(position)*(n-1);
    end
end
Output:-
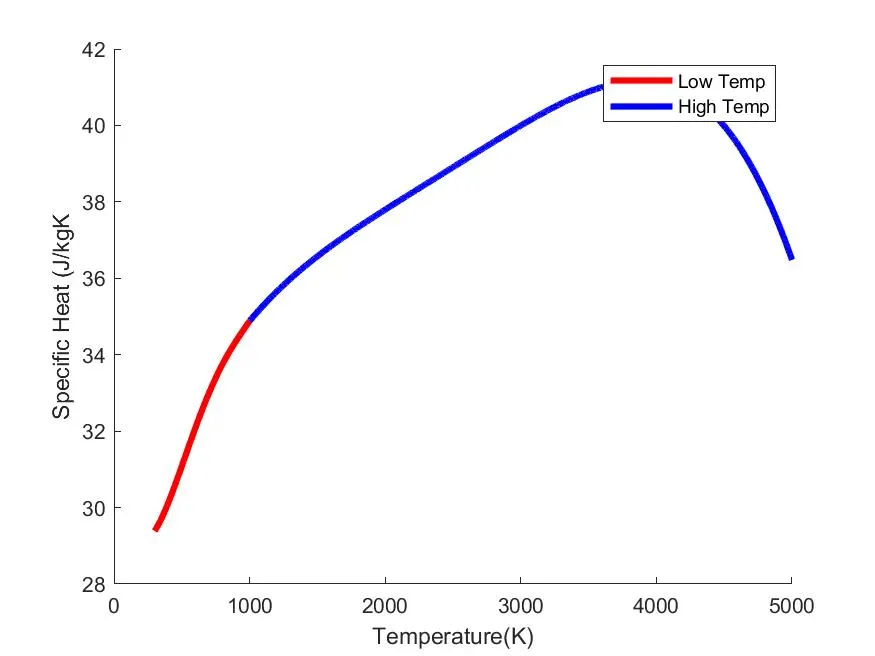
1) Species Type:- O2
Temperature vs Specific Heat
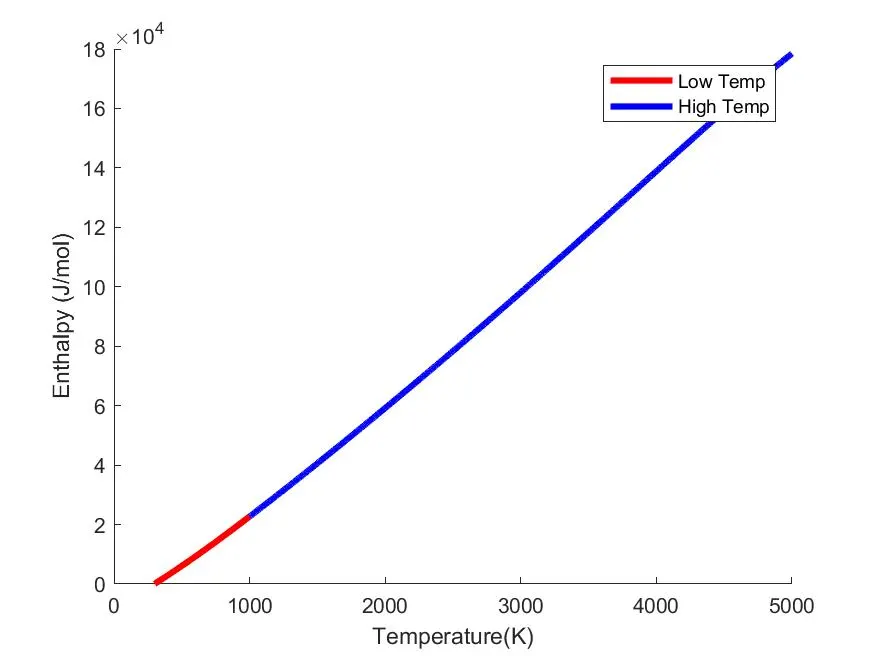
Temperature vs Enthalpy
Temperature vs Entropy
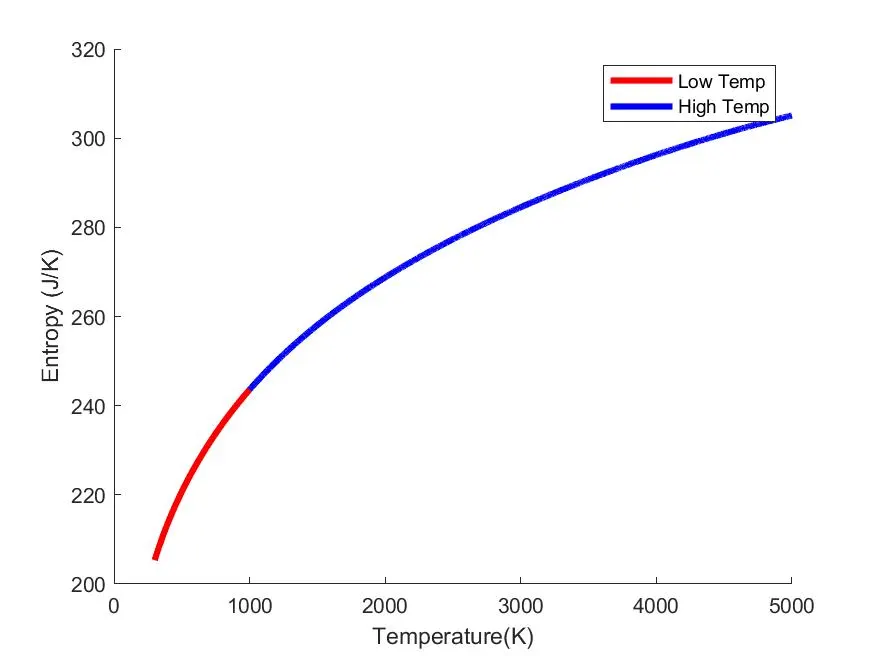
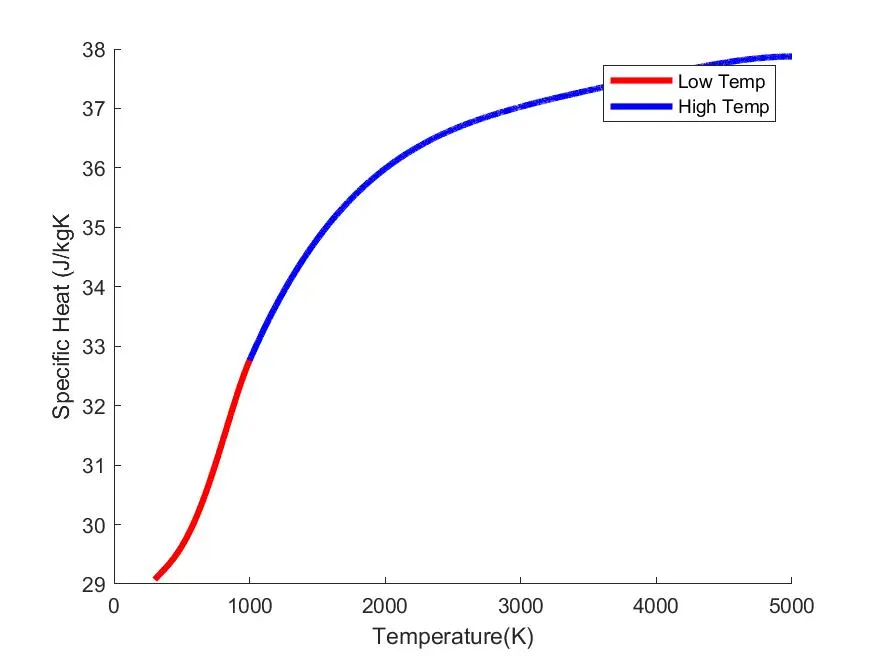
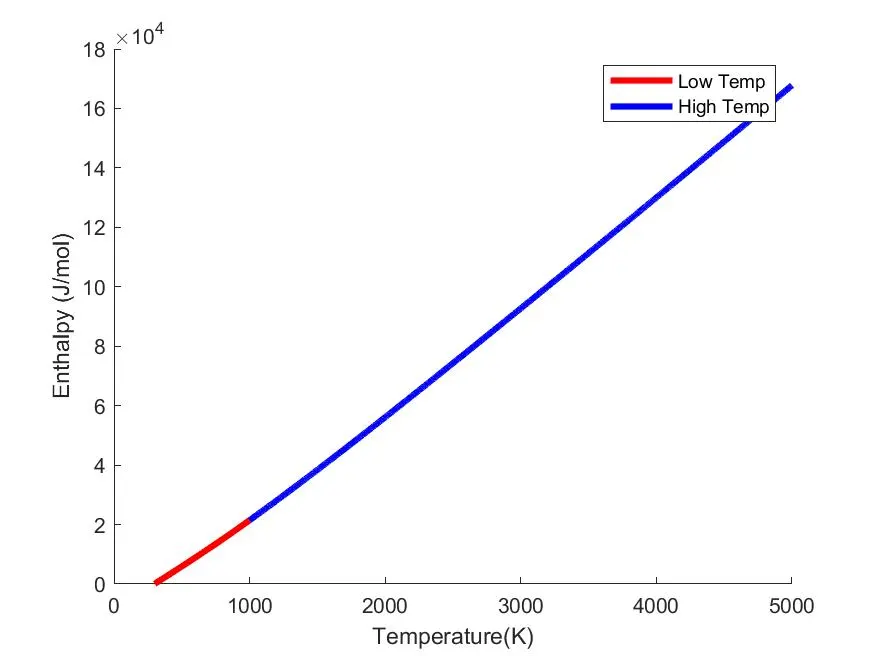
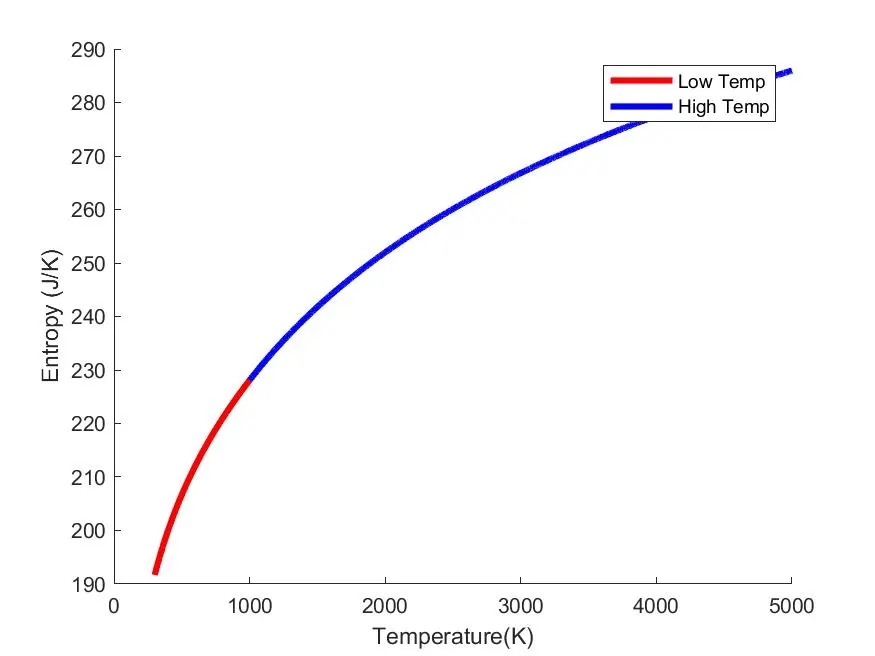
2) Species Type:- N2
Temperature vs Specific Heat
Temperature vs Enthalpy
Temperature vs Entropy
3) Species Type:- CO2
Temperature vs Specific Heat
Temperature vs Enthalpy
Temperature vs Entropy
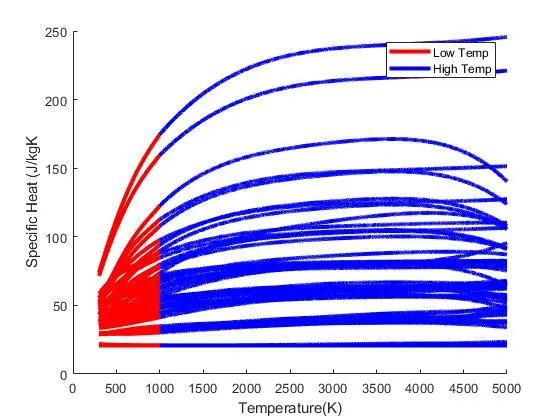
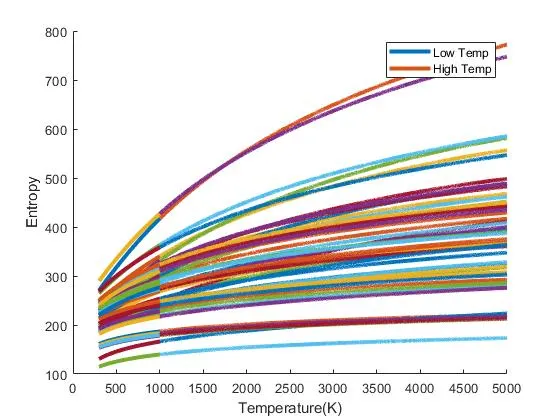
Output of all species in single plot:-
Temperature vs Specific Heat
(image 1 and 2 are same) shown for easy tracing
Temperature vs Enthalpy
(image 1 and 2 are same) shown for easy tracing
Temperature vs Entropy
Molecular weight of all species:-
Plots in Individual folder:

Errors:-
Error 1:-
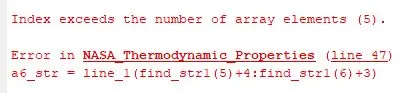
Solution:-
Error 2:-

Solution:- missed to add end parentheses ")"
Error 3:-

Solution:- Should be an element wise operator .^
Error 4:-

Solution:- Should be an element wise operator .^
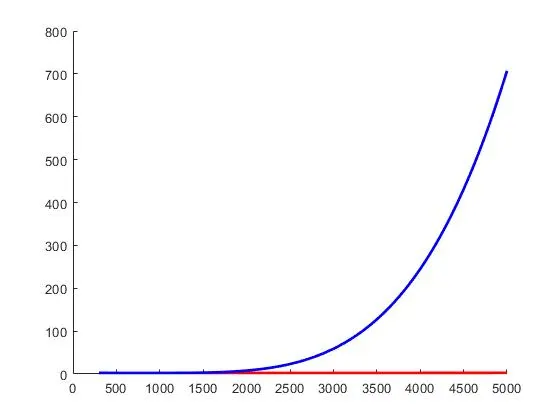
Error 5:- Error in plot
Solution:-
error in the function,(i.e) low temperature and high temperature assigned inversly.
Error 6:-

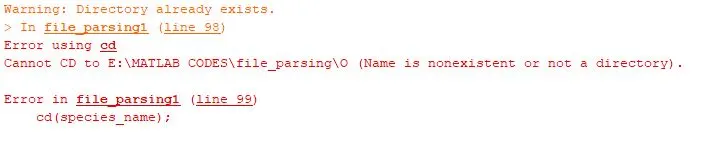
Solution:-
After creating the individual folder for species, the code directry is not assigned to continue the While loop. Added cd('E:MATLAB CODESfile_parsing')
Result:-
The thermodynamic properties of Specific heat, enthalpy and entropy are calculated and molecular weight of each species is evaluated using Matlab program.