Frontal Crash Simulation
Project 1
Front Crash Simulation
Aim
Frontal crash simulation of the given Fe Biw Neon Model using Hypermesh/Radioss Solver.
Setup Requests
- Check unit system and either follow[Mg mm s] or [Kg mm ms].
- Create appropriate interface ,friction 0.2 and recommended parameters.
- Make sure of no penetrations and intersection.
- Correct rigid bodies if any issues.
- Create rigid wall with friction 0.1.
- Compare the model weight with the full scale 300k nodes model and use added masses to reach target weight 700kg while getting CG about the required range.
- Initial velocity 35 mph.
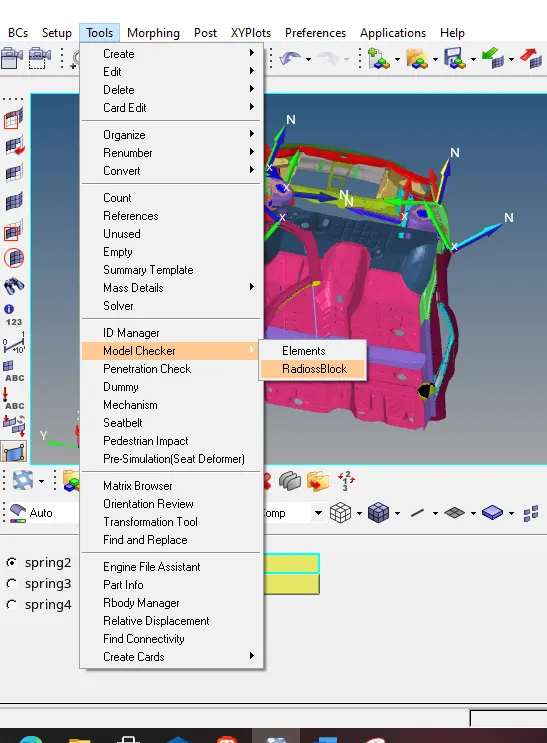
- Use model checker to ensure good quality.
- Time-step :0.5 to 0.1 microseconds.
- Run 80 ms.
Output requests:
- Sectional force in the rails at location of indicated node 174247.
- Axial force received on the rails from bumper.
- Shotgun cross sectional forces.
- A pillar cross section.
- Acceleration curve received on the accelerometer at base of B pillar (on B pillar rocker).
- Intrusions on the dash wall 66695,66244.
Procedure
- The units can be checked by simply opening the neon_front_000.rad file on a text editor like notepad.
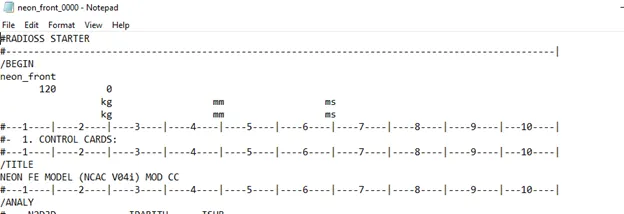
- Since the given units are kg mm and ms,on opening hypercrash we set the units accordingly.
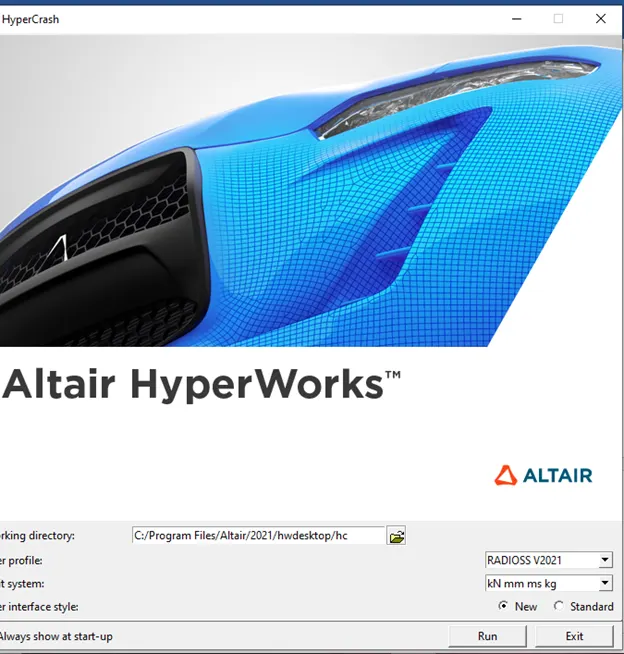
- In hypercrash, we will be checking for penetrations/intersections and balancing the mass according to the required CoG.
- Penetration is defined as overlap of the material thickness of shell elements, while intersection is defined as elements completely passing through one another
- They adversely affect simulation results and must be removed
- To check for any penetration or intersection in hypercrash
- Quality >Check intersection on tree > Select Parts > Click on Check penetrations
- Thus,there are no penetrations or intersections on the given model
- Next, we can move on to mass balancing.
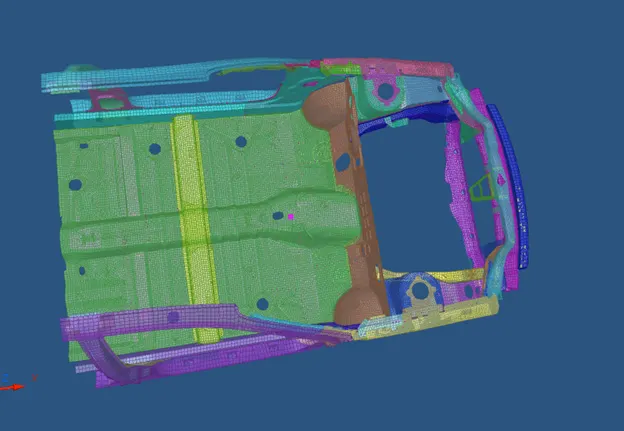
- The reduced models weight is 188 kg which needs to be increased to 700 kg while the CoG needs to be brought to the center of the Ch-Cbn-Seat-Reinf-Ft component
- We can ignore the z axis while mass balancing and add masses on the floor panel appropriately.
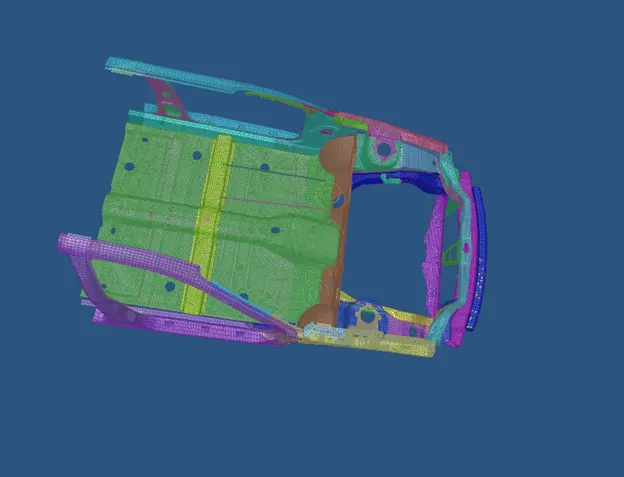
- After Mass Balancing, we can export the model in .rad format so that we can make the other changes in hypermesh.It is possible to make the changes in hypercrash but it is easier to do so in hypermesh
- File->Export->Radioss
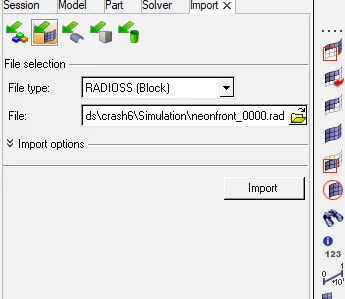
- Open Hypermesh and import the file.
- First, we can create the interfaces.There are 2 interfaces that we need to make.One is the self contact type 7 interface and the bumper interface so that we can determine the axial force experienced during impact
- Before creating this,delete any previous interface groups
- The type 7 node to surface interface is used for both groups.
- The master and slave contacts will be same since there is self intersection during impact.
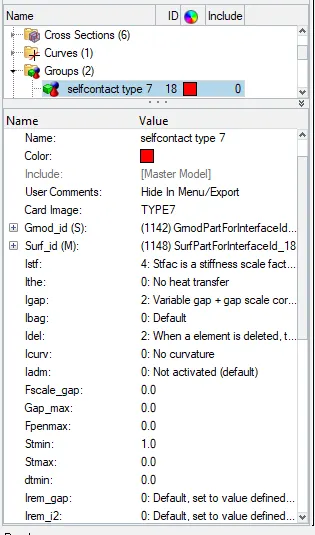
- The recommended values for type 7 are
Igap=2
Idel=2
Inacti=6
Istf=4
Gapmin=0.5mm
Iform=0
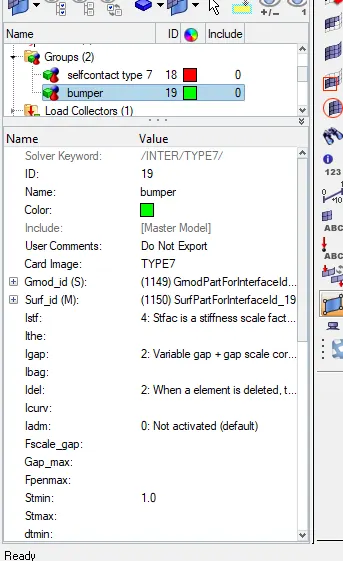
Stmin=1Kn/mm - For the bumper/bracket Interface
The bumper will be the slave while the bracket component will be the master - The property values will be the same as the ones used for type 7 self contact
- After this we can create the rigid wall
- The rigid wall is created in the solver browser.
- View ->Browser->Hypermesh->Solver
- In the solver browser, Create->Rwall->Plane
- We need a reference node to create the rigid wall.This can be created by selecting any node in the centre of the bumper and creating an rwall few units higher in the x axis.
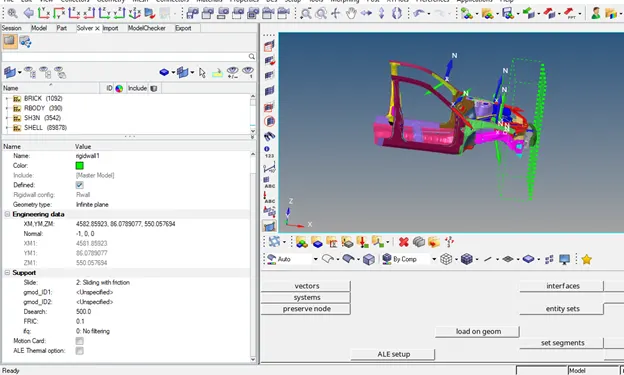
- All nodes within the value of Dsearch=500 mm will be treated as slave nodes for the contact between the car and the rwall
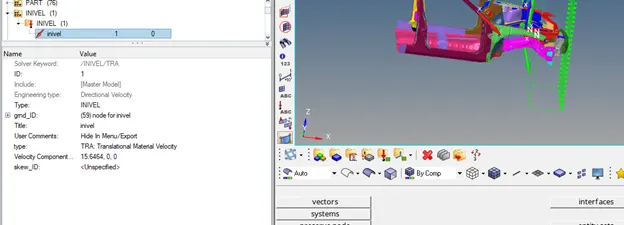
Input Velocity
- The requested initial velocity is 35Mph which converted to m/s is 15.6464
- In solver browser,Create->Boundary Condition->Inivel
- We need to create a set of nodes to assign a Initial Velocity to.
- In this simulation, we are assigning this initial velocity to all the nodes of the component,so creating a new set consisting of all the nodes is necessary.
- Sections
- We will be creating sections at the pillars,rails and shotgun.
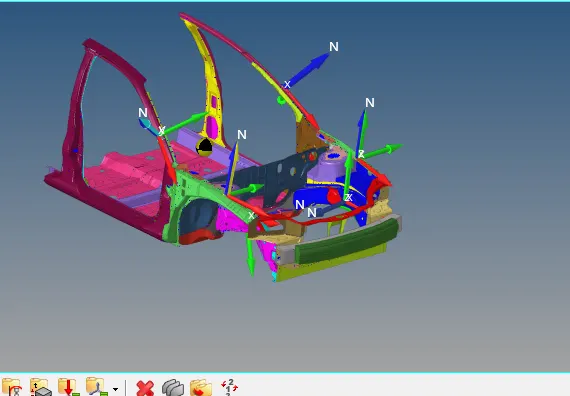
- For each section that is created, it is necessary to create a moving frame as well.
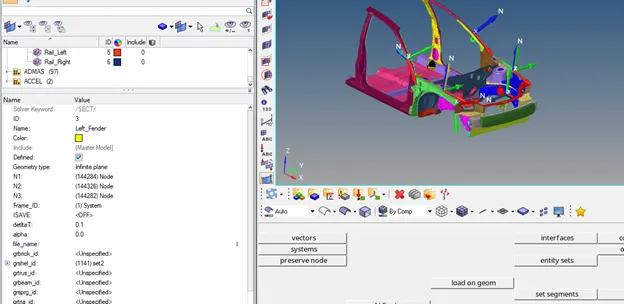
- Create a set in grshel_id and select a group of 3 rows of elements to create the section.
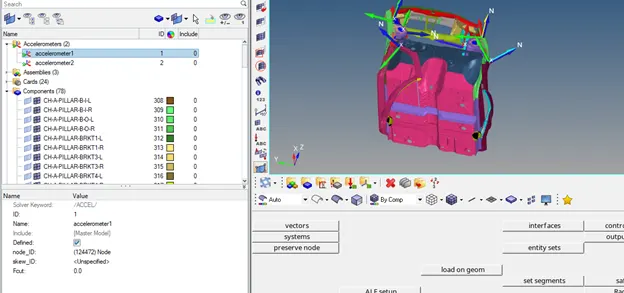
- After creating the sections,we create an accelerometer at the base of the 2 pillars
Accelerometer
- In model brower, Create->Accelerometer->select node 1d->proceed.
- Name the accelerometers appropriately so that we can differentiate them in the results.
- Springs
- 2 Springs are created from node 66695 and 66244 to the cross beam section
- In 1D panel, go to springs and create 2 springs from the above 2 nodes to the cross beam section
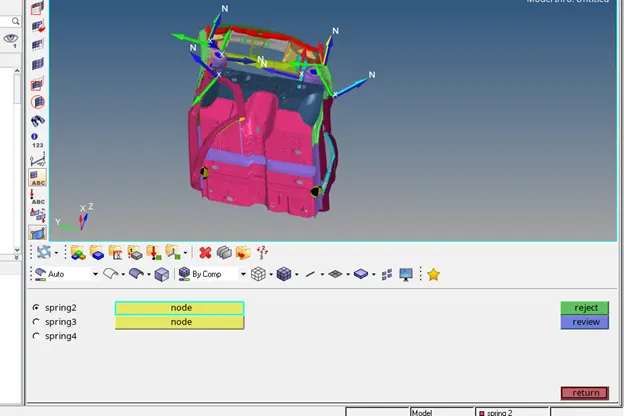
- The purpose of these springs is to study any intrusions,so assign a very low stiffness and mass.
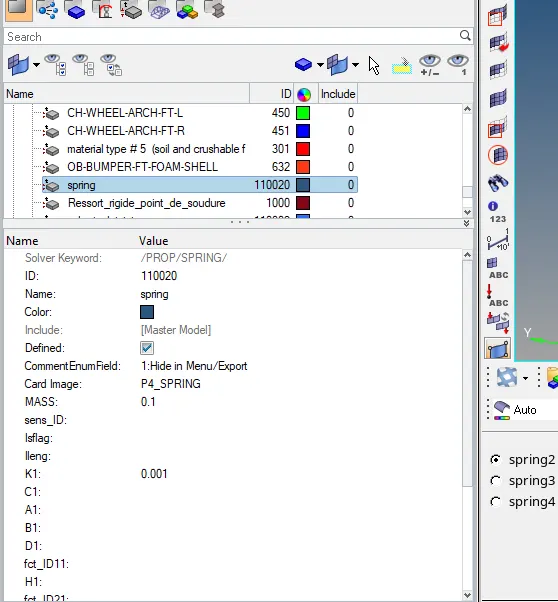
- After assigning the property to the springs,run the model checker in hypermesh.
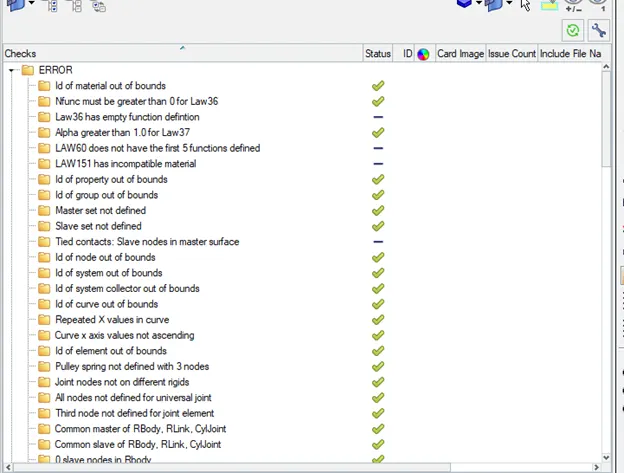
- There are no errors,only warnings in the model checker.
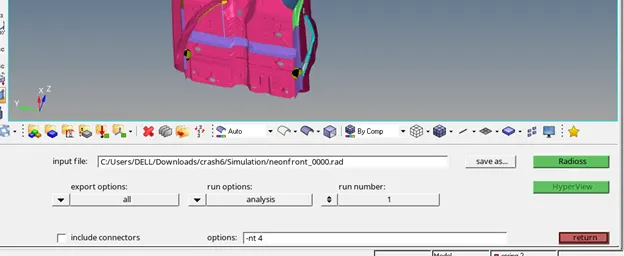
- With This, we can run the model on the radioss solver in analysis->radios and analyse the results.
Results
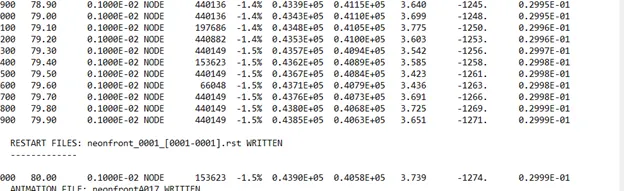
- The energy error is at -1.5% and the mass error is low,this indicates that the simulation is good for further analysis.
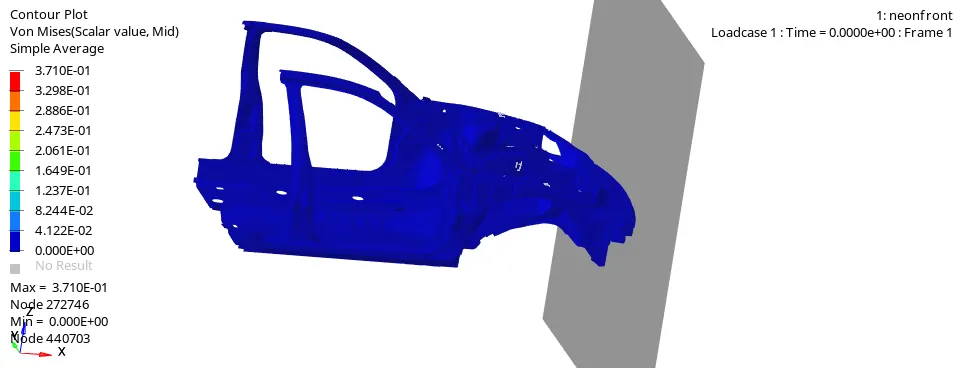
- From the animation,we can see that force is distributed from the bumper to the side rails and then to the pillar.
- In each stage,the force decreases as some of it is absorbed by the system.
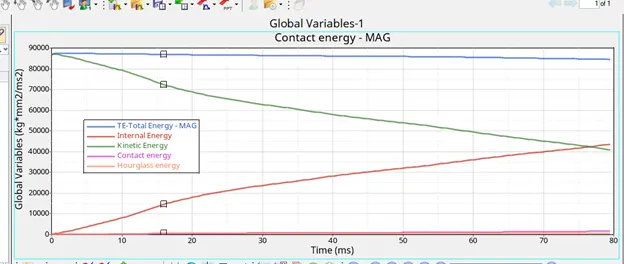
- Energy Graphs
- Initially, the kinetic energy is very high due to an initial velocity of 15.3434 m/s or 35Mph.
- Once the car collides with the rigid wall, the vehicle starts deforming and loses its velocity resulting in the loss of Kinetic Energy.
- We know that,according to the law of conservation of enery, Energy can neither be created or destroyed.Thus the kinetic energy is converted into internal energy.
- After a certain point,beyond the 80 ms time limit, the velocity will reach 0 m/s.This will lead to no energy available to be converted to internal energy.Thus internal energy will become constant.
- The total energy is almost constant with slight loss in the end which can be attributed to the energy loss% seen in the output file.
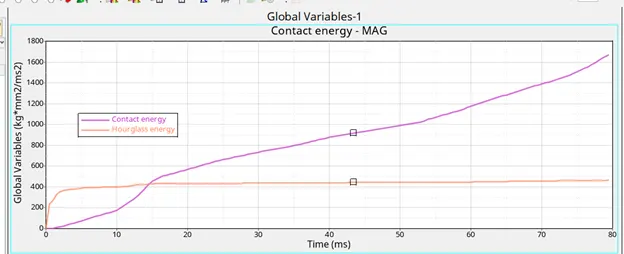
- Contact energy is the energy applied by the system to avoid penetration of elements.
- After deformation occurs,the system will need to gradually apply more and more energy to avoid penetration of elements.Thus the contact energy increases the entire time.
- Hourglass energy is minimal due to the use of reduced integrated QEPH elements.
- The hourglass energy can be further reduced by reducing the time step of the simulation and by using the recommended element properties.
Sectional Forces
Bumper
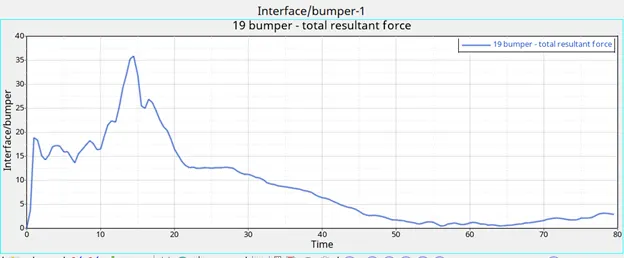
- The force at the bumper is 35.91kN.During the simulation,the bumper is the first component to come into contact with the rigid wall and hence experiences the maximum force.
- It will absorb some of the force and transmit the rest to the rail and other components.
Rail
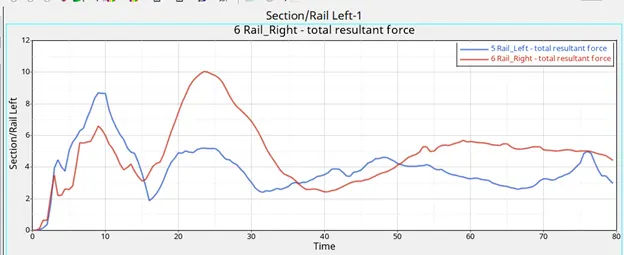
- The force transmitted to the rails by the bumper is not equal as the bumper will absorb some of the energy.
- The maximum force experienced in the right rail is 8.71kN while a force of 10kN is seen in the left rail.
- Thus it can be concluded that the force propagated to the rails is uneven.
- At around 25 ms the force decreases until spikes again, this can be attributed to the large deformation leading to contact with the rigid wall.
Shotgun
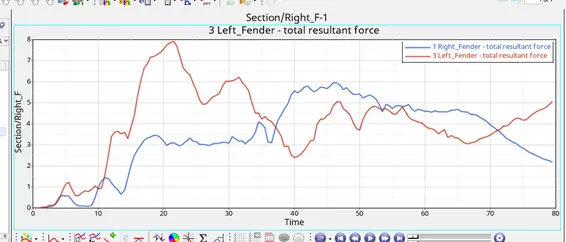
- The maximum cross sectional force in the left fender is 7.9kN whereas in the right fender it is 5.95 kN.
- This indicates non uniform force propagation and deformation of elements.
- When the compressive force reaches the maximum value,it starts to deform rapidly.Therefore the force decreases gradually.
- During the crash,the shotgun comes in contact with the rigid wall which exerts force,hence it increases initially.
Pillar Forces
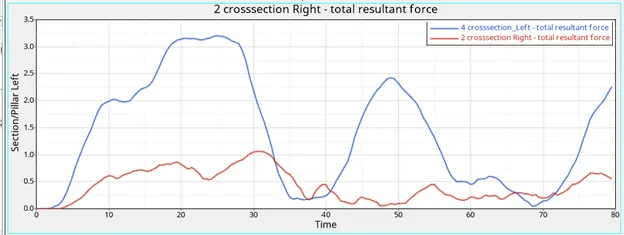
- The force from the rails is transmitted to the pillar.Hence they will be less when compared to the rails,shotgun and bumper.
- The force peaks at 3.2kN in the left pillar and at 1.05kN in the right pillar.
- As the rail and shotgun deform and come into contact with the wall the experience forces from the wall.
- This force is then transmitted to the pillars leading to spikes seen in the graph.
It can be observed that the forces favour the left side of the model over the right.
This is due to the fact that the center of gravity of the model is slightly in favour of the left side.This results in the uneven force distribution observed.
Intrusion Springs
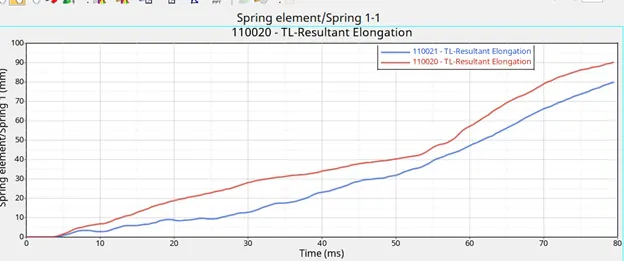
- The maximum elongation observed in the spring connected to node 66695 is 90mm and the spring connected to node 66244 is 79.94 mm.
- Practically this elongation is the extent to which the passengers legs or foot pedal will move during a crash.
- From the animation it can be observed that the deformation in this region is relatively low and the elongation is also low.
- This indicates that during this crash,the passengers/driver will experience fewer injuries.
Accelerometer
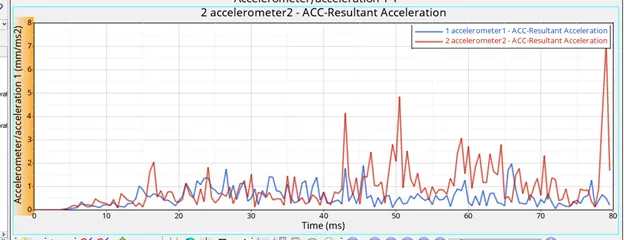
- The maximum acceleration observed in the right pillar is 1.96mm/ms2
- The maximum acceleration observed in the left pillar is 7.127 mm/ms2
- Before the car hits the rigid wall, acceleration is 0, after collision the acceleration is not constant.
- The front of the car decelerates at a higher rate compared to the back.
- The sudden spikes in acceleration can be due to the vibration of the elements
- The larger spikes at the end of the simulation can be attributed to the large deformations seen at the end of the animation.
- The difference between the left and right accelerometer is due to the Centre of gravity slightly favouring the left side of the model.
Learning Outcomes
- Setting up a frontal crash simulation
- Allocating mass to adjust the centre of gravity
- Checking for penetrations/intersections
- Setting up sections to view sectional forces
- Setting up springs to view elongations
- Adding accelerometers to the model
- Debugging errors
Conclusion
The given Dodge Neon Model has been set up for frontal crash analysis.
The force distribution from the crash starts from the bumper and ends at the A and B pillar. Intrusion springs were created on the dash wall to detect if the passenger or driver would be seriously injured. The slight difference in the left/right components was determined to be the Centre of Gravity slightly favouring the left side of the model.
It was determined from observing the acceleration and elongation graphs that the passenger/driver will be safe during impact.