Frontal Crash Simulation of Neon Dodge under FMVSS Regulation
Objective: To perform frontal crash analysis on the scaled-down model of neon dodge under FVMSS conditions.
Procedure:
- Import the given 0000.rad file into hypercrash.
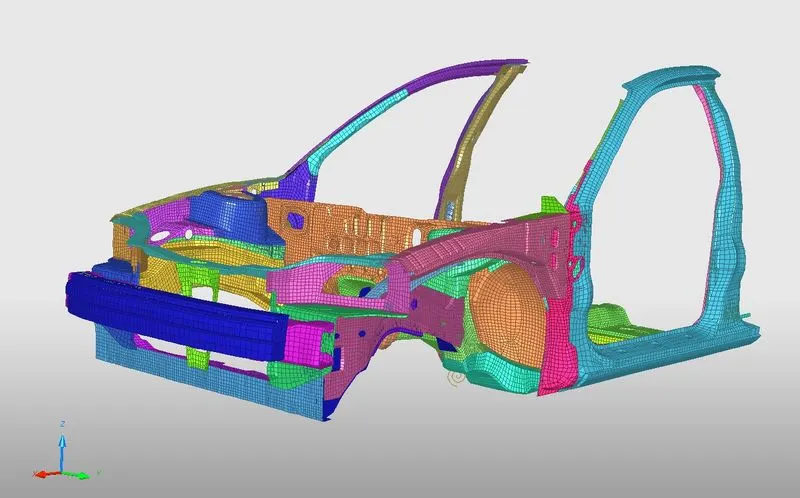
Fig 1: Neon dodge scaled-down BIW model.
- The units are checked in the rad file, and it is Kg mm ms.

Fig 2: Units in the starter file.
- The penetrations are checked in the model from check all solver contact interfaces from the quality menu.
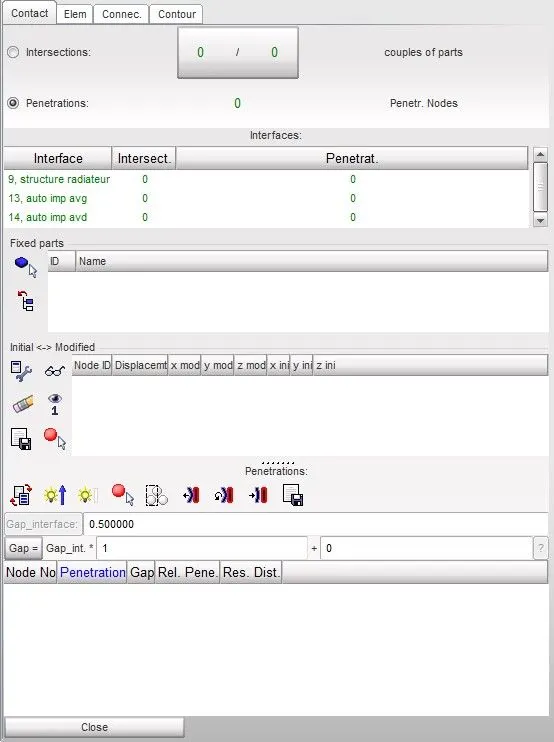
Fig 3: Penetrations and intersections check in the model.
- From the check, we can see that there are no penetrations and intersections in the model, and we can move on to further pre-processing steps.
- Mass of the whole model is checked using the balancing option in the mass tab. The computed mass of the BIW comes out to be 188 kgs which should be increased to 700 kgs to incorporate the real-world crash scenario.
- The model's center of gravity is located above the gear lever, which should be lying beneath the driver seat.
- To bring the center of gravity to the exact location, additional mass is added to the nodes to get the computed mass to 700 kgs and obtain the precise location of the CG.
- CG plays a significant role in the crash scenario, which decides the pitching and yawing motion of the vehicle after the impact occurs.
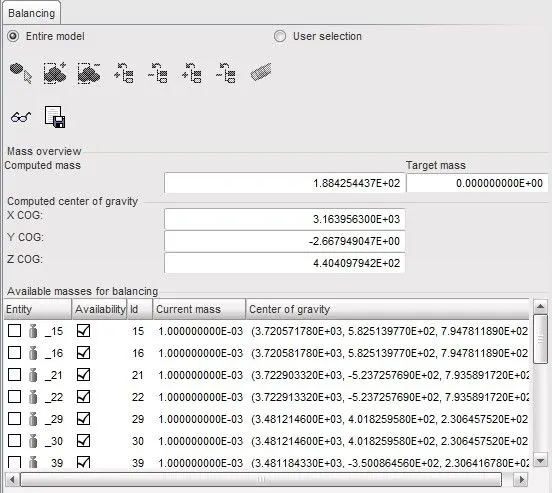
Fig 4: Mass of the BIW model and the coordinates of the center of gravity.
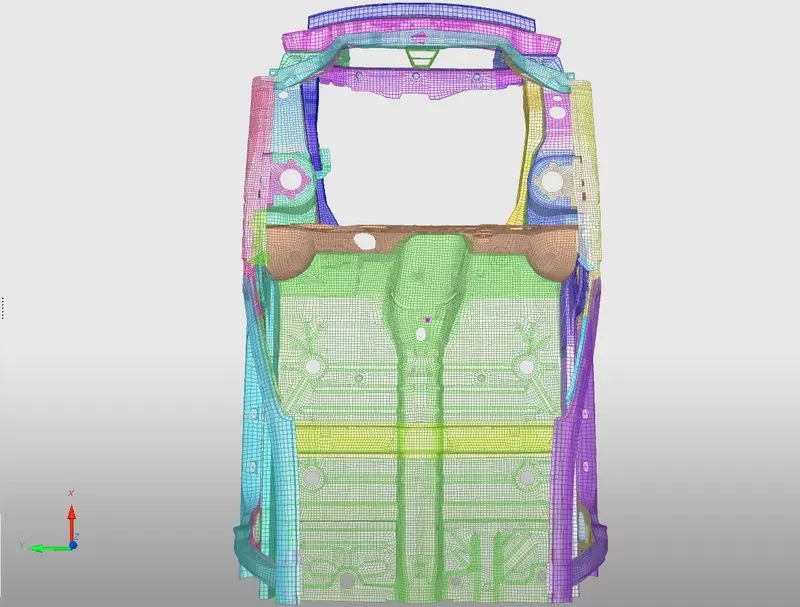
Fig 5: Center of gravity of the BIW is represented by a pink dot at the mod of the model.
- From the loadcase menu added mass option is available. While creating a new mass, keep the type0:Mass is added to each node of the node group.
- A few nodes are selected from the model, and the mass is distributed so that the COG is lying towards the driver side.
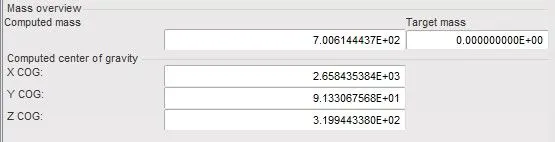
Fig 6: The computed mass is brought to 700kgs.
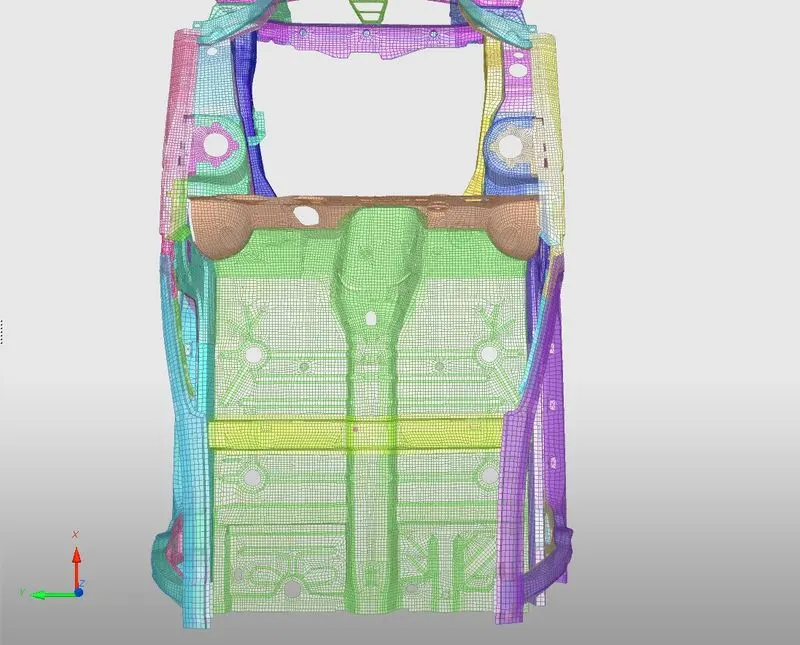
Fig 7: The COG of the model is located on the cross beam lying towards the driver side.
- We are exporting the file from the hypercrash to hypermesh to create a rigid wall.
- In the model browser, a new rigid wall is created with the following inputs.
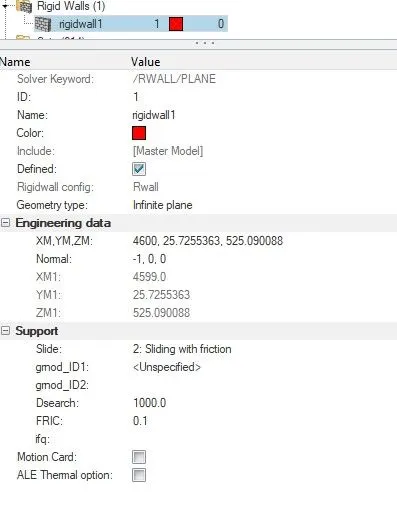
Fig 8: Rigid wall is created with the following data.
- The friction is set to 0.1.
- The search distance for the slave nodes is entered as 1000mm.
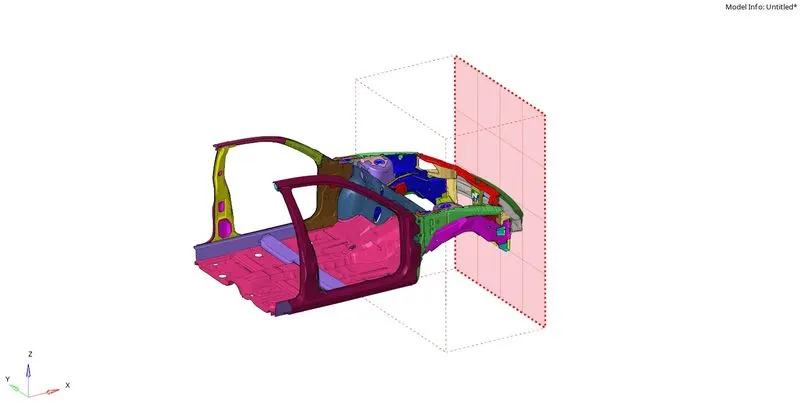
Fig 9: Rigid wall is created in front of the bumper with a small gap.
- Delete the existing contact groups and create two new groups with a type 7 interface.
The recommended properties for creating a type 7 interface are:
Istf=4:Stfac is a stiffness scale factor, and the interface stiffness is computed from both master and slave characteristics.
Igap=2:Variable gap + gap scale correction of the computed gap.
Idel=2:When an element is deleted, the corresponding segment is removed from the master side of the interface.
Stmin=1:Minimum stiffness in contact to avoid too soft contact.
Gapmin>=0.5:Minimum thickness.
Inacti=6:Gap is variable with time, but initial penetration is computed.
Iform=2:Stiffness (incremental) formulation.
- A friction of 0.2 is entered.
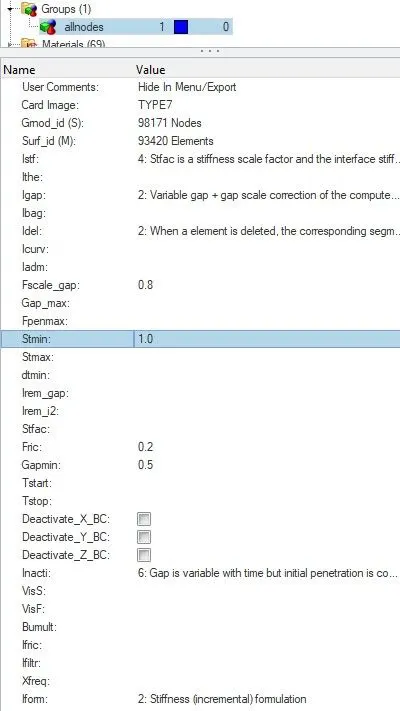
Fig 10: Type 7 contact is created between all the nodes in the model with the required contact parameters.
- One more contact group is created between the BUMPER-FT and the HEADLIGHT-BRACKET-B.
- The master nodes are present on the HEADLIGHT-BRACKET and the slave nodes on the BUMPER-FT.
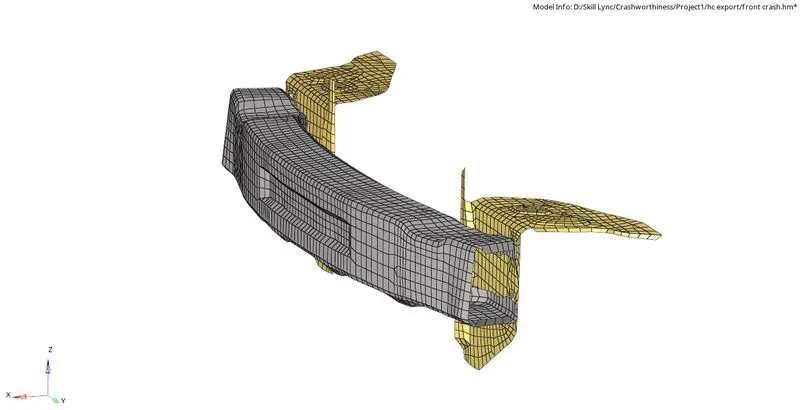
Fig 11: BUMPER-FT and the HEADLIGHT-BRACKET-B.
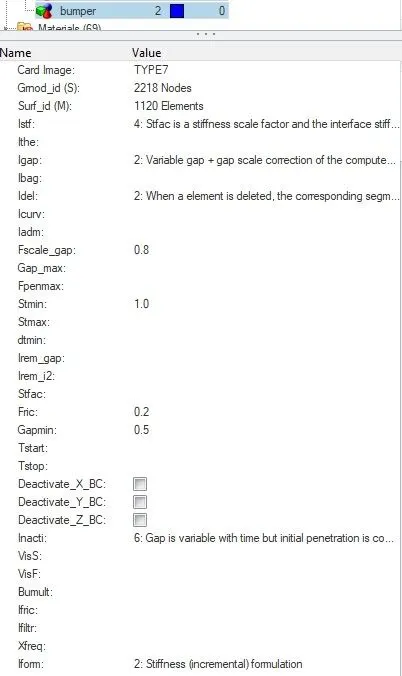
Fig 12: Type 7 contact with recommended parameters are created for the bumper and bracket contact.
- Initial velocity is applied to all the nodes with 35mph.
- In the loadcase menu, the initial velocity option is provided.
- All the nodes from the graphics are selected, and a value of 15.6464 is entered in the X velocity column.
- 1mph= 0.447 mm/ms
- The type is set to translational.
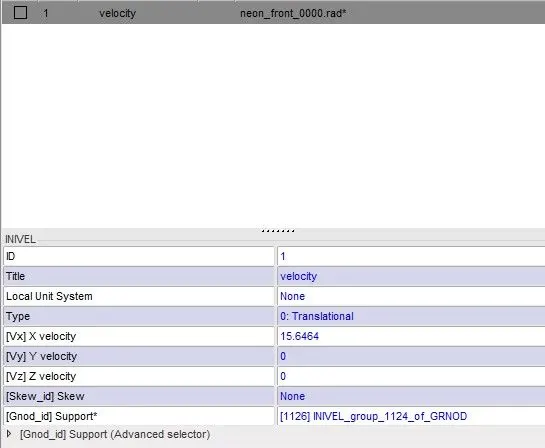
Fig 13: Initial velocity is applied to all nodes of the BIW.
- To check the intrusions or deformations near the driver's leg area, springs are connected from the dash wall with a node id of 66695 and 66244 connected to the cross beam.
- The final results measure the spring deformation or compression to find the intrusions near the dash wall.

Fig 14: Options for creating springs using two nodes from the 1D tab.
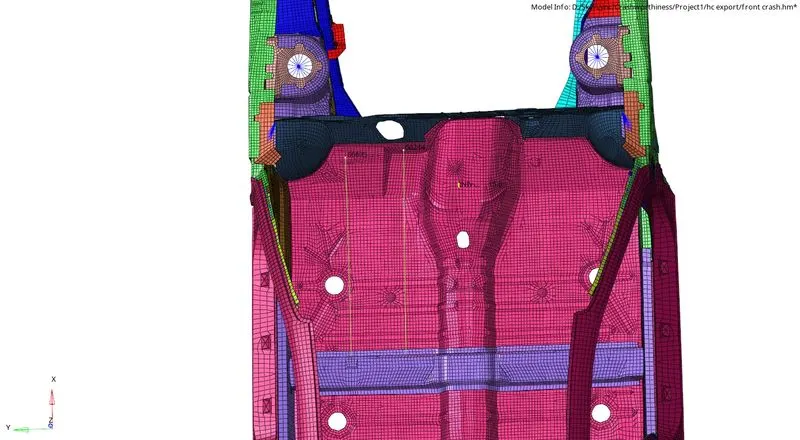
Fig 15: 1D spring element connecting the two nodes with the cross beam.
- A new property is created for these springs with a card image of P4_SPRING. Mass and stiffness values are 0.001.
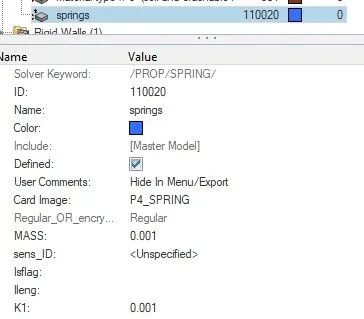
Fig 16: Property for the springs.
- Accelerometers are places at the base of the B pillars.
- An Accelerometer converts mechanical motion into an electrical signal. It is an electromechanical device that measures acceleration forces, whether caused by gravity or motion.
- Accelerometers are created from the model browser. Two nodes at the base of each B pillar are selected.
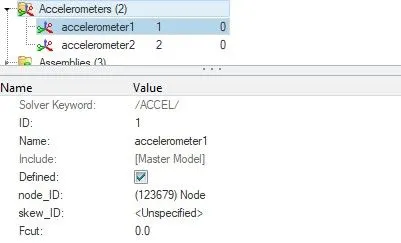
Fig 17: Two accelerometers are created.
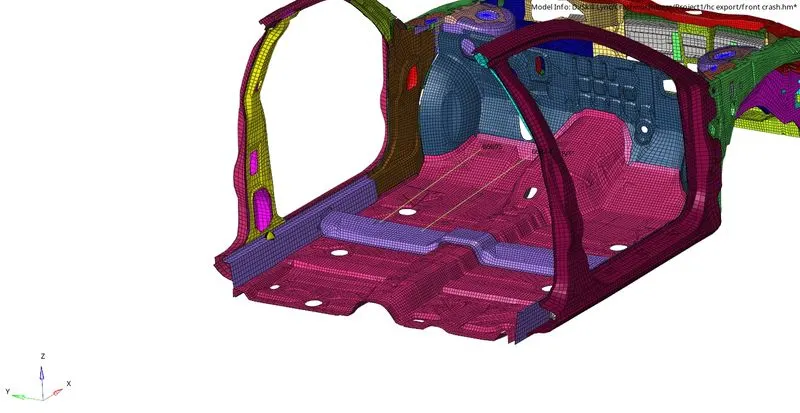
Fig 18: Accelerometer representation at the base of the B pillar.
- Moving frames are created in these components to obtain forces transmitted to the bracket, rail, fender, and A-pillar.
- MOV Frames can be created from the solver browser.
- Three nodes must be selected at the desired locations, and these three nodes have a specific meaning for the definition of the frame.

Fig 19: Options for creating a MOV frame with three nodes.
- Eight MOV frames are created at the given node locations on both sides, i.e., left and right.
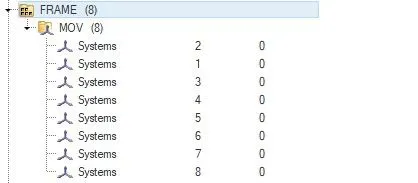
Fig 20: Eight moving frames are created at the desired location.
- After the creation of these moving frames, cross-sections are created based on these frame ids.
- Cross-sections in the model can be created from the SECT option in the solver browser.
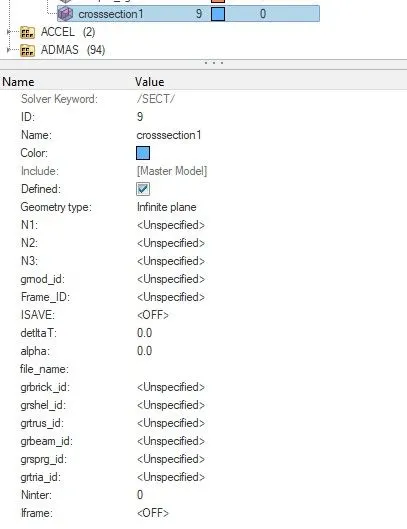
Fig 21: Options for creating cross-sections.
- Geometry type is set to an infinite plane; N1, N2, and N3 values are defined the same as the frame nodes.
- Fame_ID is selected, and a set of elements around the axis is selected, where the forces are monitored.
- deltaT value is set to 0.1.
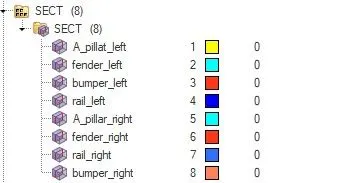
Fig 22: Cross-sections are created in the area of interests.
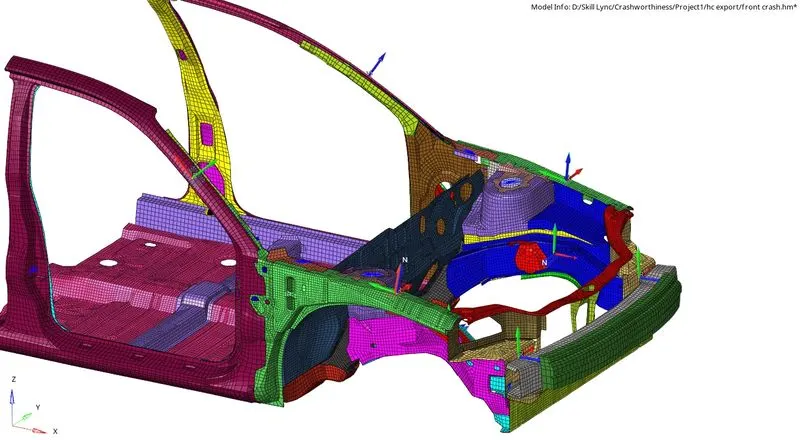
Fig 23: Cross-sections represented on the model.
- For all the defined cross-sections, accelerometers, and springs outputs, requests must be created to determine the required data quantities.
- To create these outputs, there is already a TH folder in the solver browser, and few default outputs requests are defined.
- New output requests are created by selecting the appropriate entity.
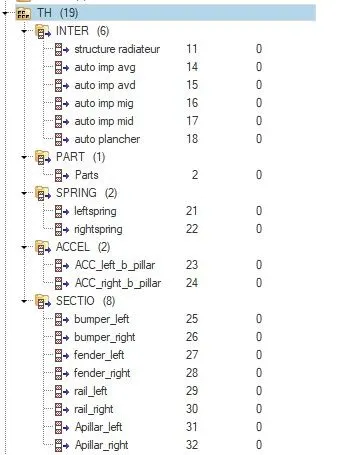
Fig 24: TH is defined for every entity separately.
- Once everything is set up correctly, the model checker is run in the hypermesh and hypercrash.
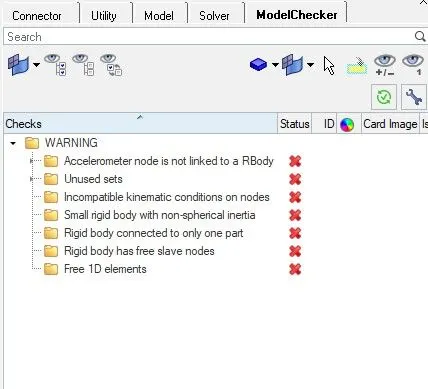
Fig 25: Model checker result in hypermesh.
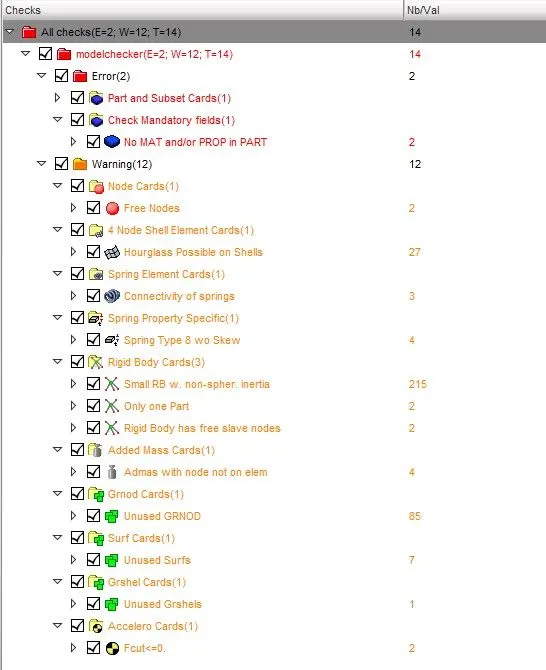
Fig 26: Model checker result in hypercrash.
- From the check, there are only warnings popped and no warnings.
- Warnings can be ignored; any errors must be rectified to run the simulation without any problem.
- Now we can proceed to run our simulation. Navigate to the analysis tab and choose the radioss option.
- Input file option will be available to save the starter and engine file in the desired location.
- In the options bar, "-nt 6" is entered, which denotes parallel processing for the simulation.

Fig 27: Saving the file with an appropriate name.
- Once all the options are selected correctly, click on the radioss button to run the simulation.
- A separate window pops up and shows the calculation going on, and it might take up to few seconds to minutes based on the complexity of the solution.
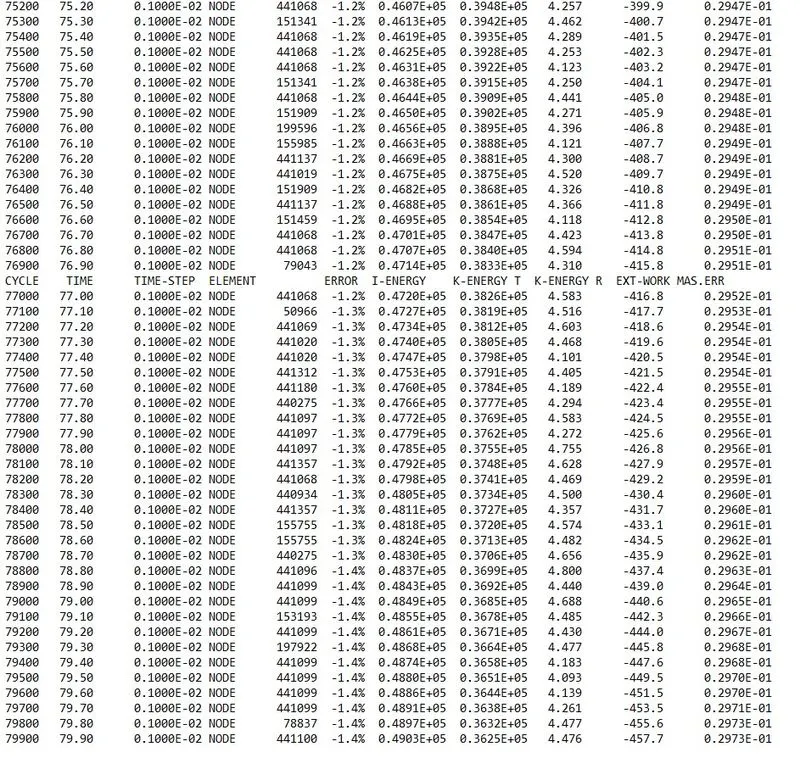
Fig 28: 0001.out files contains the solution information.
- We can check for the energy and mass error from the engine output file whether it lies within the permissible limit or not.
- The energy error starts from 0.0 to -1.4%, and the mass error is 0.2973E-01. Both are in the acceptable range, and we can proceed with the post-processing of our results.
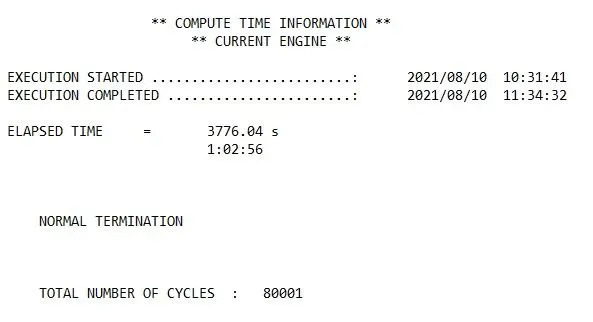
Fig 29: Compute time information.
- ELAPSED TIME = 3776.04 s
- TOTAL NUMBER OF CYCLES: 80001
Results and discussions:
- For post-processing, the results Hyperview and hypergraph are used.
- When hyperview is open, we need to load the model and results file of our simulation.

Fig 30: Options for loading the animation file.
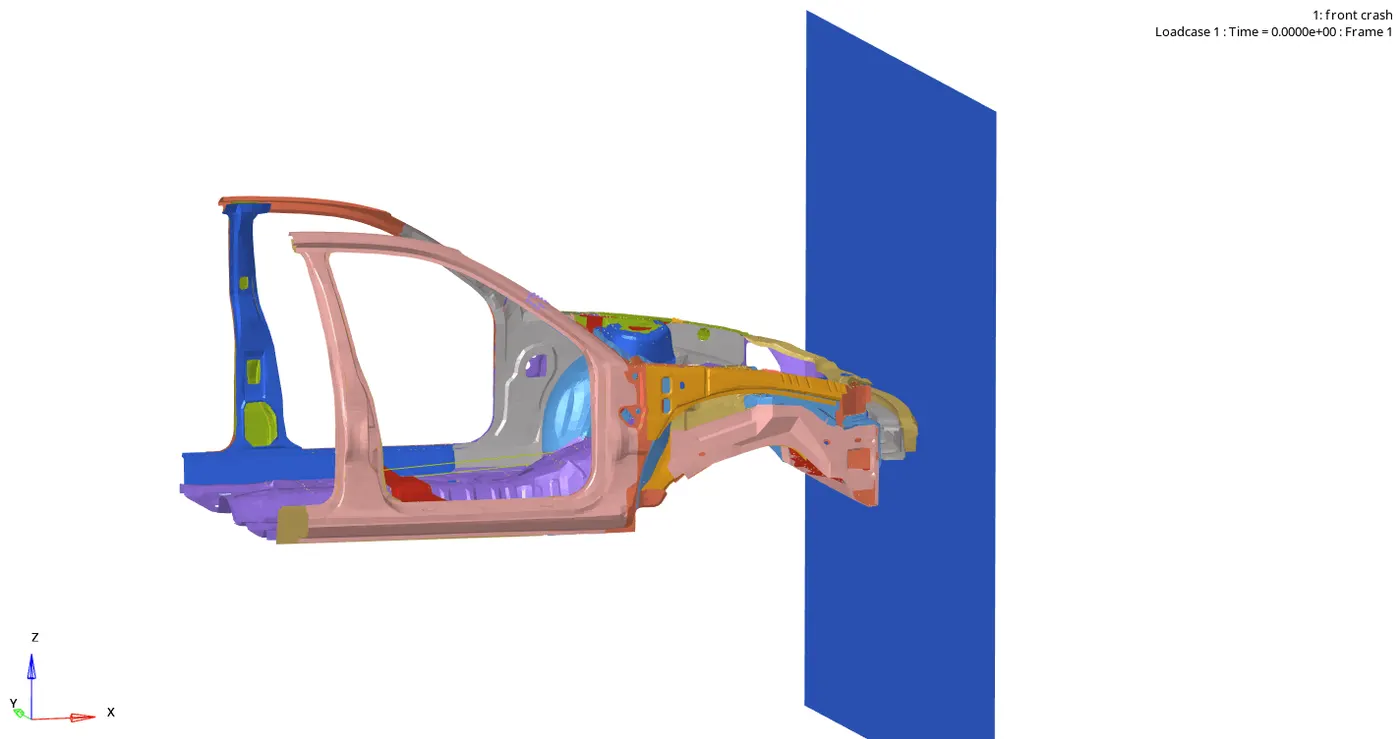
- The above animation represents the vehicle crashed into the rigid wall.
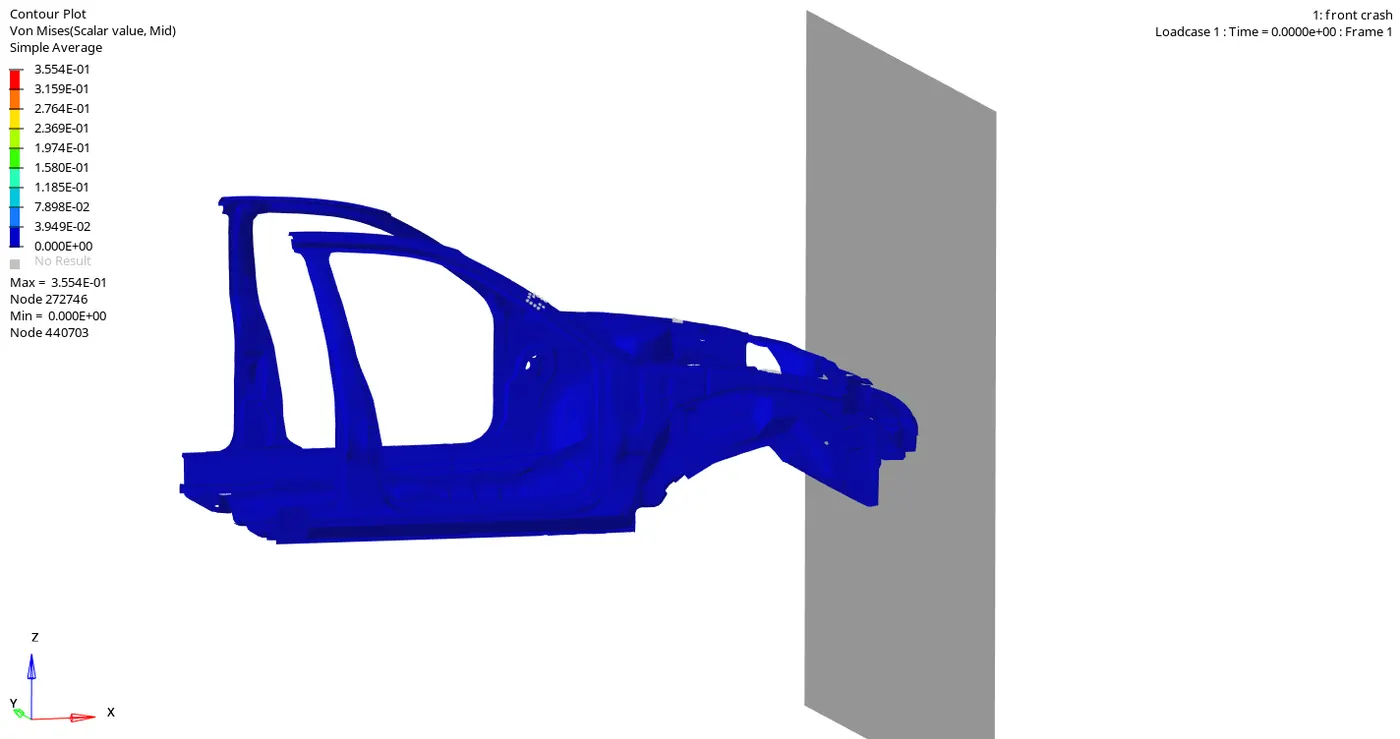
- The above animation represents the von mises stresses generated in the BIW, and the maximum value is 3.554E-01.
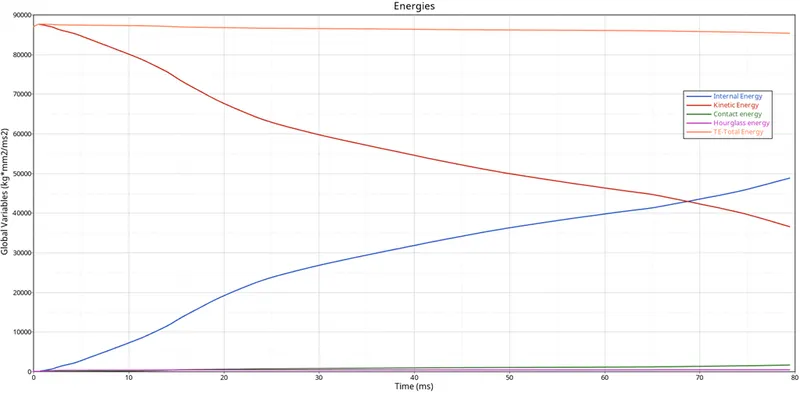
- The above plot shows the Total energy, Kinetic energy, Internal energy, hourglass energy, and contact energy.
- The total energy is the summation of an internal, kinetic, hourglass, and contact energy.
- Internal energy is the sum of kinetic and potential energy in a system.
- The hourglass energy is controlled because of the element formulation.
- The vehicle is given an initial velocity of 35 mph; when it moves with such speed, the system builds kinetic energy. At 0 milliseconds, we can observe the system has the highest kinetic energy and zero internal energy. As the vehicle hits the rigid wall, all the kinetic energy is exhibited on the body, internal energy starts to increase, and the kinetic energy in the system decreases.
- Contact Energy is the opposite force generated from the System to Avoid Penetrations. The gap min value is set to 0.5. When the car moves with a velocity of 35mph and hits the rigid wall, it starts deformation from the bumper section. Hence, penetration of the elements happens; an external force acts on these elements to avoid penetrations. Therefore the contact energy increases gradually.
Bumper Forces:
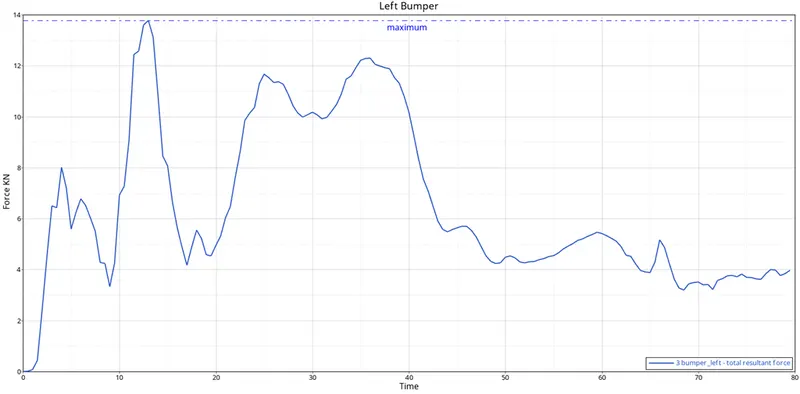
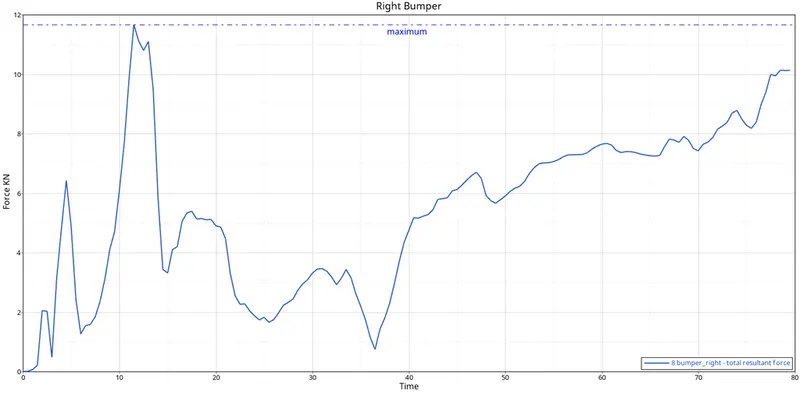
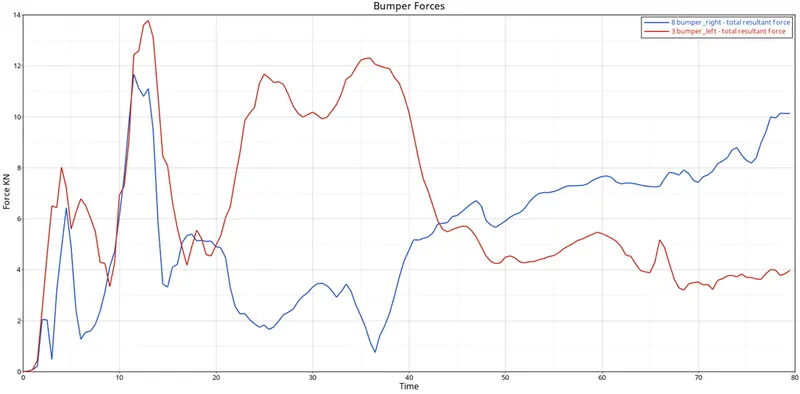
From the graphs, it can be inferred that the left side of the bumper took the maximum force of 13.8KN, and on the right side of the bumper, it is slightly less at 11.8KN. The bumper is the first part that comes in contact with the rigid wall in a frontal crash scenario. As the crash continues, the BIW is being pushed into the rigid wall, and we can see forces are being developed in the bumper. For the whole run time, the bumper is continuously pressed, and we can observe the forces in the bumper are increasing through time. From 40milliseconds, we can observe that the left bumper forces are being decreased and the right bumper forces are being raised.
The left bumper has failed after reaching the maximum force value and transmitted the force to the remaining components. The bumper is designed to be entirely crushed during the crash, and we can observe that here.
Rail Forces:
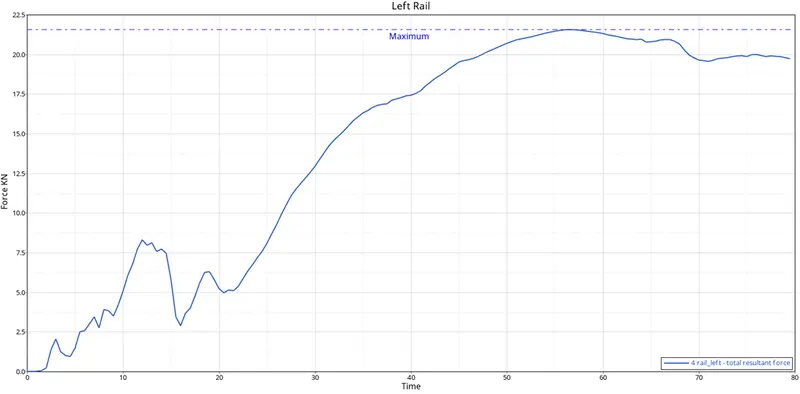
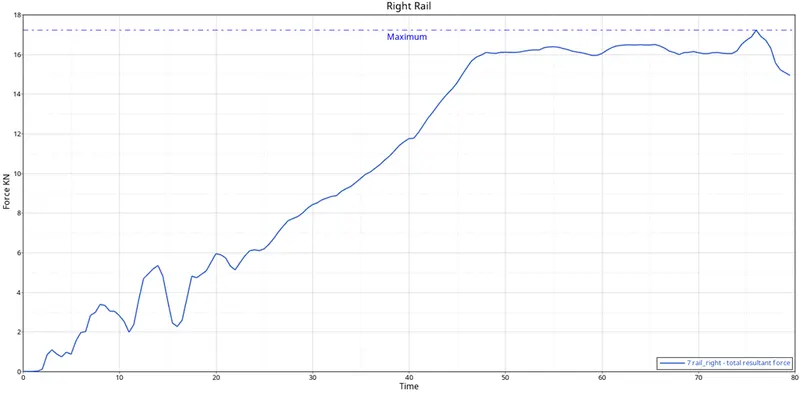
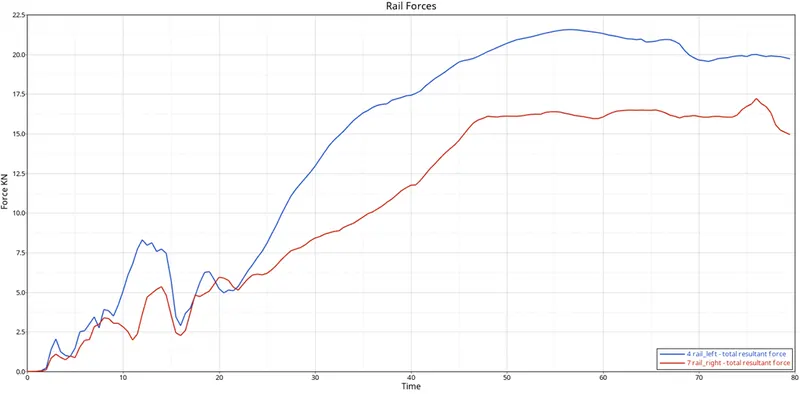
Rails are components with large cross-sections, and after the bumper is crushed, the forces are transferred to the rails. Coming from the bumper graphs, we can observe that the left rail has experienced more significant force values (22.3KN) than the right rail (17.2KN). As we have stated previously, the left bumper has failed at 40 milliseconds, we those forces in the left rail. The right rail has experienced fewer forces because the right bumper absorbs the forces, and hence a lower force is transmitted to the right rail.
Fender Forces:
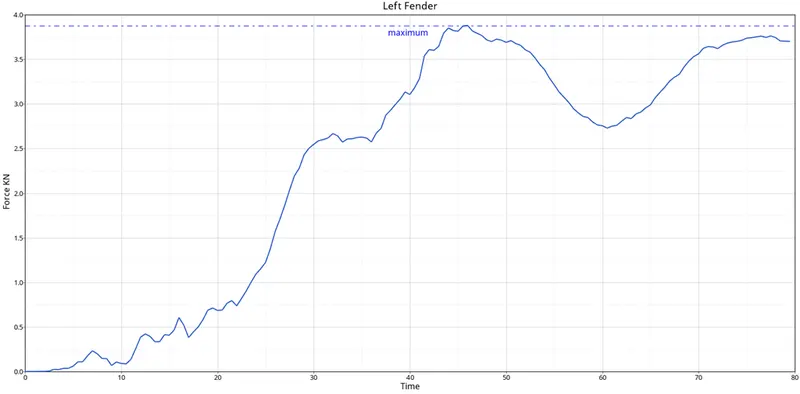
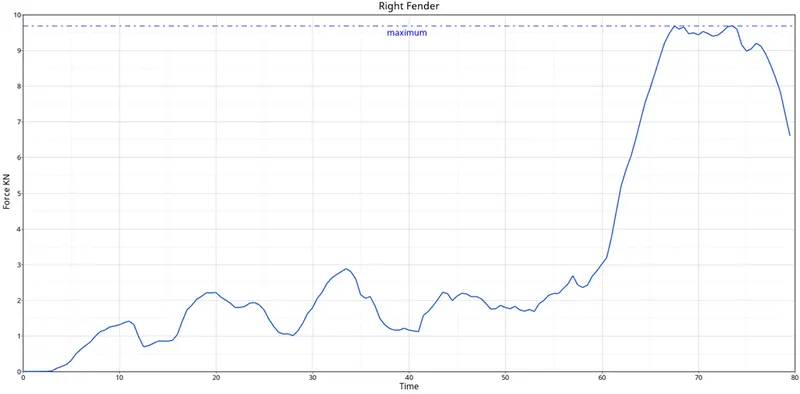
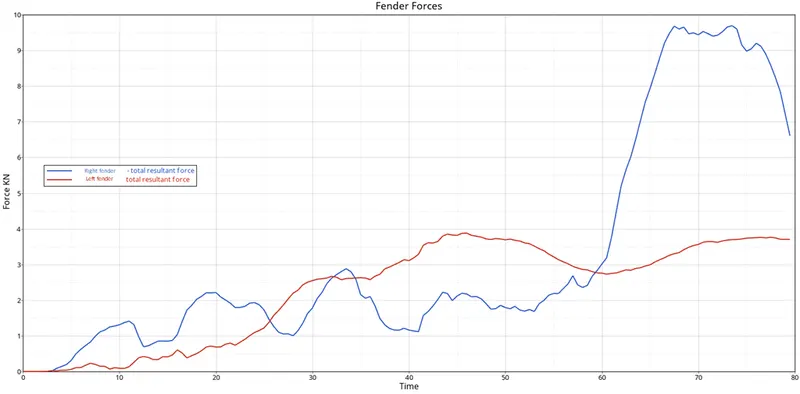
Looking at the forces transmitted through the fenders concludes why lesser forces are produced in the right rail. The right fender has taken major impact forces in this particular case, and hence lower energy has been transmitted through the rail. The left fender has a lower force value because the rail has taken up a higher amount of energy.
A-Pillar forces:
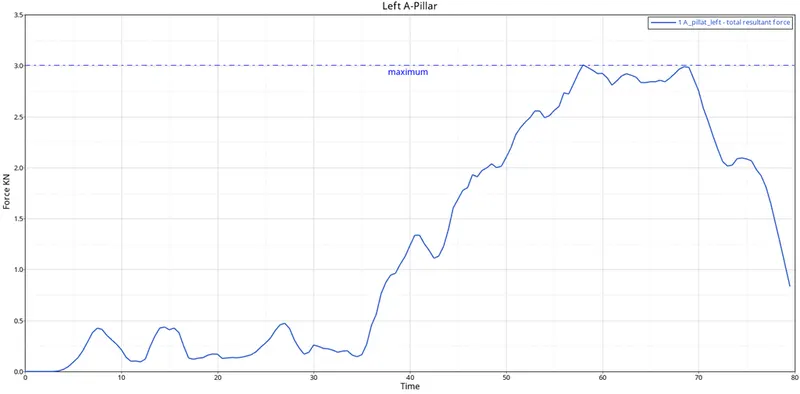
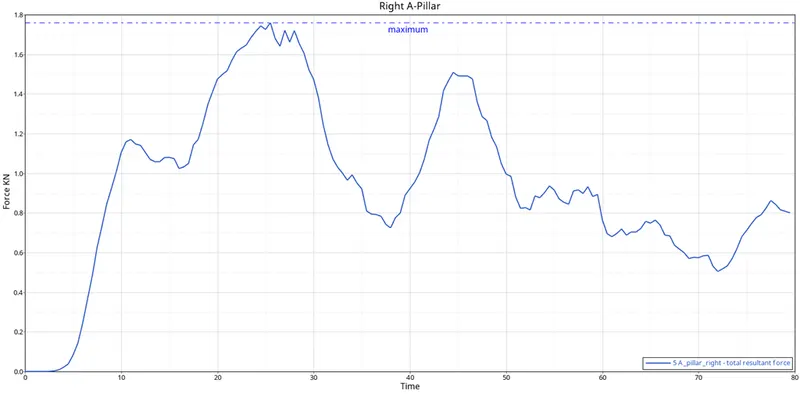
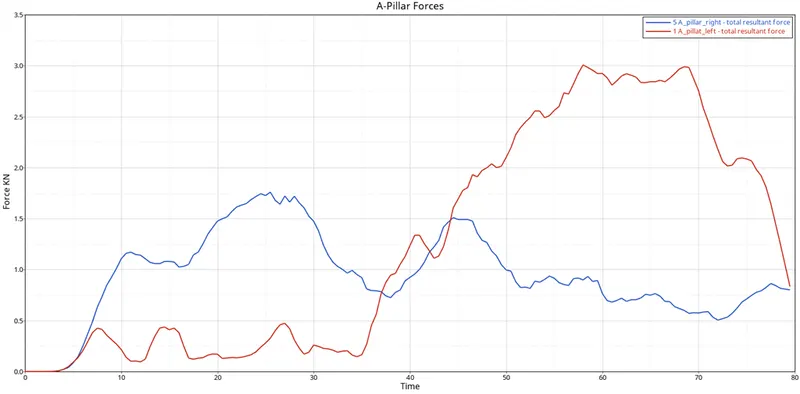
The left A-pillar's maximum force comes out to be 3KN, and the right A-pillar's force is 1.77KN. Since the right fender has taken up a considerable force, less force has been transferred to the right A-pillar. This force distribution also depends on the mode of deformation each component undergoes and how these components crush and fail.
Intrusions near the foot area:
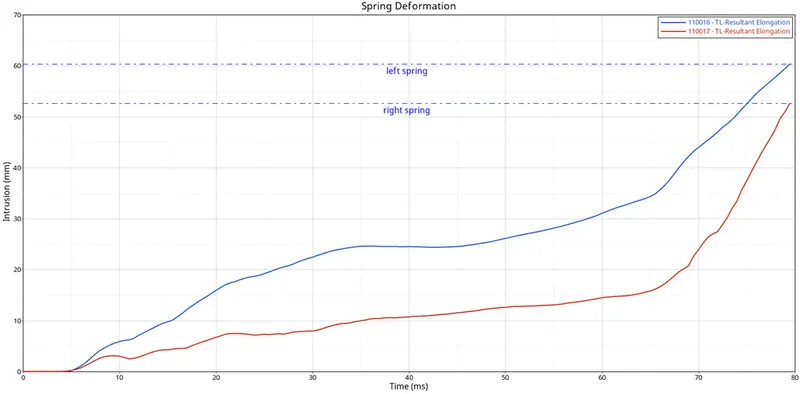
We have created springs to check the intrusions at the dash wall. The intrusion at this particular location is monitored to investigate whether the crash will result in the driver's safety due to the deformation at the front portion of the vehicle. The highest intrusion occurred in the left spring while the crash was 61 mm, and the maximum intrusion in the right spring was 52.5 mm. Realistically, this elongation is related to how the foot pedal or the passenger's legs will move in a crash scenario. We discern from the animation that not much deformation occurred at this location, and the elongation is also low. Therefore, we can assume that there are fewer injuries that happen to the Passenger.
Acceleration near the rocker of B-pillars:
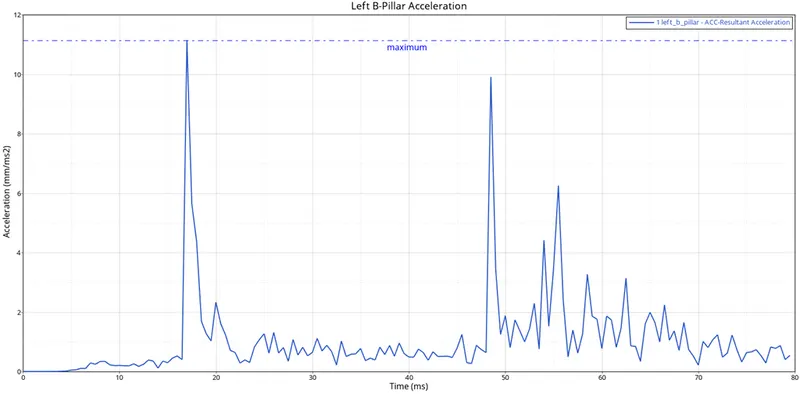
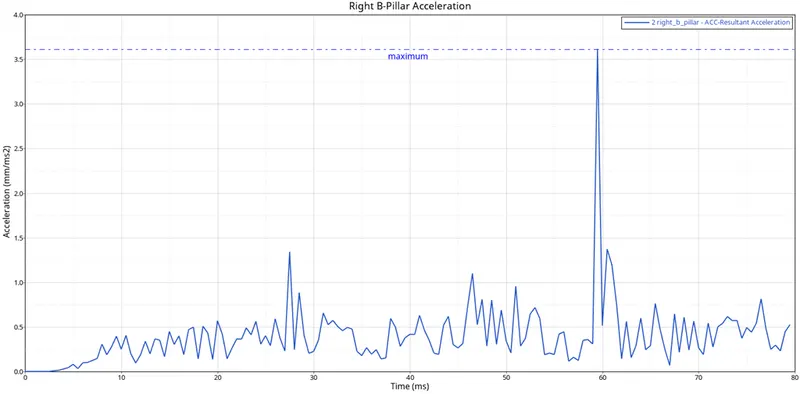
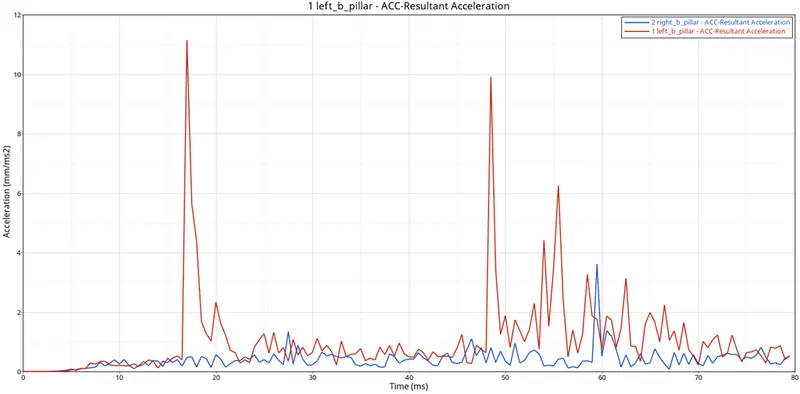
Acceleration is defined as the rate of change of velocity. The acceleration is zero initially, indicating there is no contact with the rigid wall. At around 5 ms, it can be observed acceleration is being generated in the BIW structure, and a zig-zag reading in the acceleration is detected. The sudden peaks in the reading indicate an enormous vibration in the BIW structure.
Conclusion:
A frontal crash simulation was conducted on the scaled-down model of neon doge under FVMSS regulation. The results show that the design is safe and passes the front crash test, as lower deformations were observed in the cabin and at the foot region. The front is crushed completely(very desirable as long as it is absorbing maximum forces) absorbing the forces from the impact and transmitting less to the passengers.