Assignment 6-Frontal Crash Simulation Challenge
Report on Project-1 Frontal Crash Simulation Challenge
Inputs:-
- Unit System-kg/mm/ms
- create appropriate interface i.e Type-7(goto solver>create>Inter>Type-7), friction=0.2, use recommended parameter
- Make sure there should be nopenetration and no intersection (goto tools>penetration check)
- check for rigid bodies i.e connection of each part should be proper
- Create Rwall with friction=0.1 goto>solver>right click>create>Rwall>plane >select xyz coordinate on the node , assign normal direction on the frontal part
- Target mass should be 7kg goto tools>mass detaiols>mass,COG & inertia and check, COG should be at the moddle of the floor
- Set initial velocity to 35mph or 15.6m/s goto solver>right click>create>boundary condition>Inivel, asign velocity in x- direction towards the RWall
- Use model checker to ensure no error and good quality
- Set Time-step to 0.5micro sec
- Run Time to 80ms
Output Request
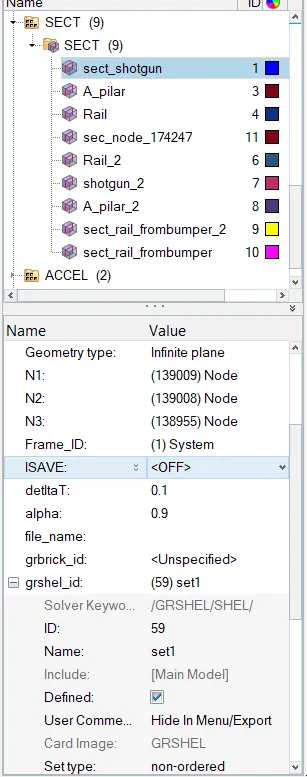
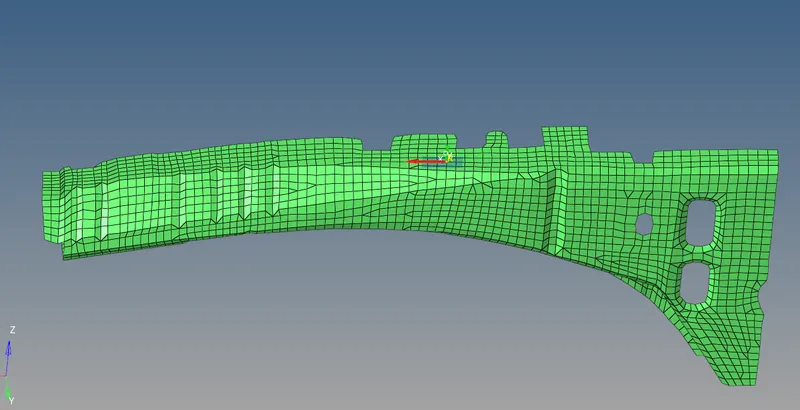
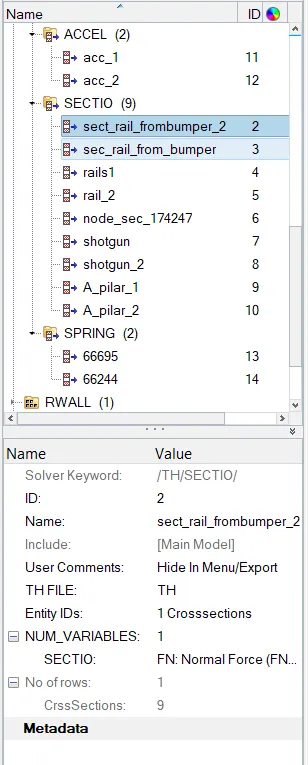
1) Create sectional forces at a given location as mentioned, so for that first we have to create moving frame (goto solver>right click>create>frame>mov frame) in a appropriate direction of motion, Now create section (goto solver>right click>create>sect>sect) asign frame id, Grshell>right click>create>select three row of elements around the frame , put DeltaT=0.1 sec, alpha=0.9, select N1,N2,N3 in the same direction of the frame, now this process is same for creating any section any where is same.
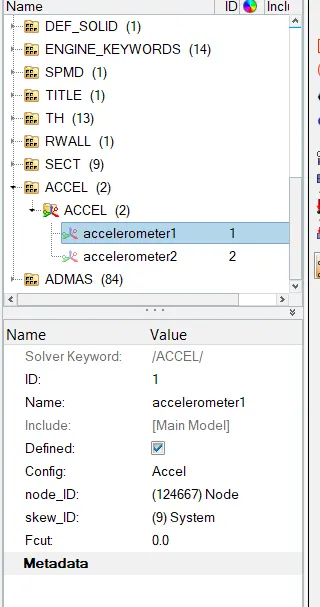
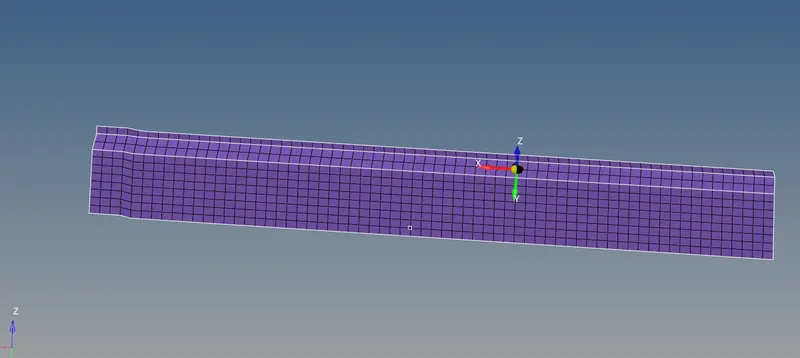
2) Now to calculate the acceleration , create accelerometer on the Base of B-pillar i.e B-pillar rocker goto solver>create>accel, click on node on B-pillar, create a mov skew , and select mov skew in the accel> skew id
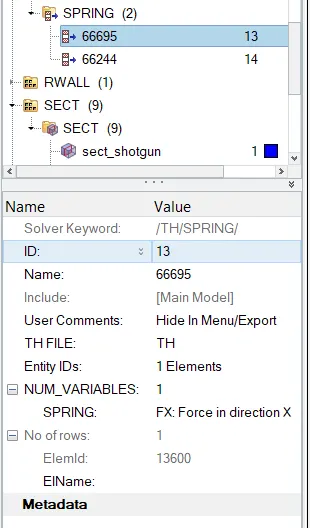
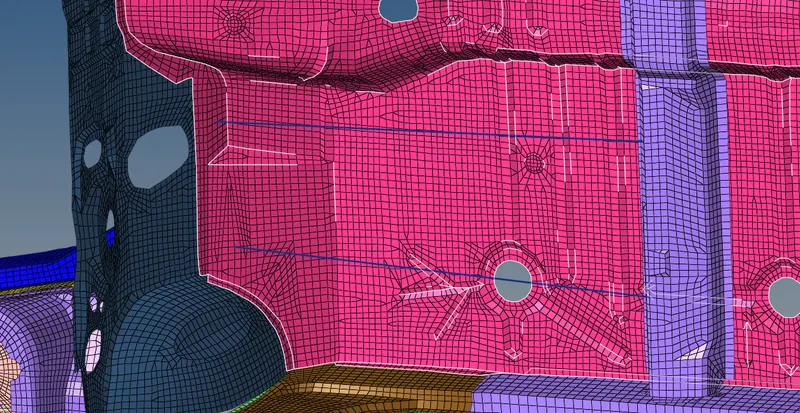
3) For intrussion (node id- 66695,66244) goto tool>number>nodes>by id>enter 66695,66244>display>on, connect these node with spring elements to measure the forces in the paddle area , spring should be of lower stiffnes
4) Create Time History for all the output request as mentioned above in the question
Now we plot all the forces and energy
we poted forces and acceleration on the both side of the car, hence we have two plots for each cases
| Cases | Plots | Remarks and Conclusions |
|
  |
|
|
  |
|
|
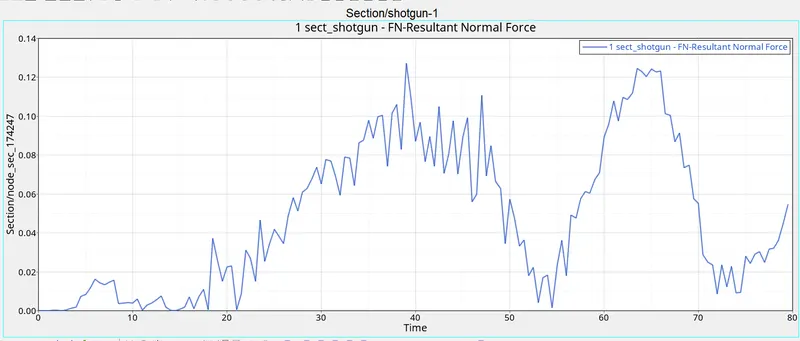 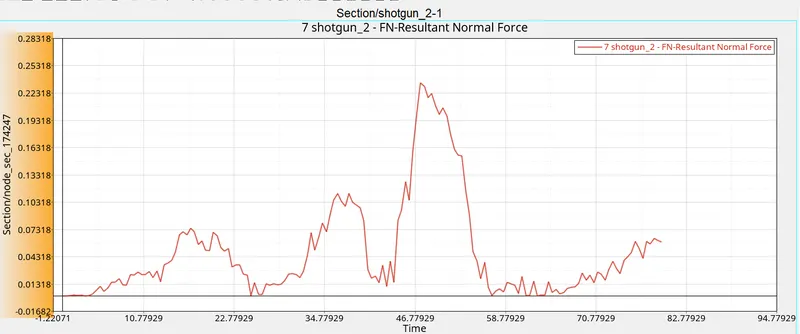 |
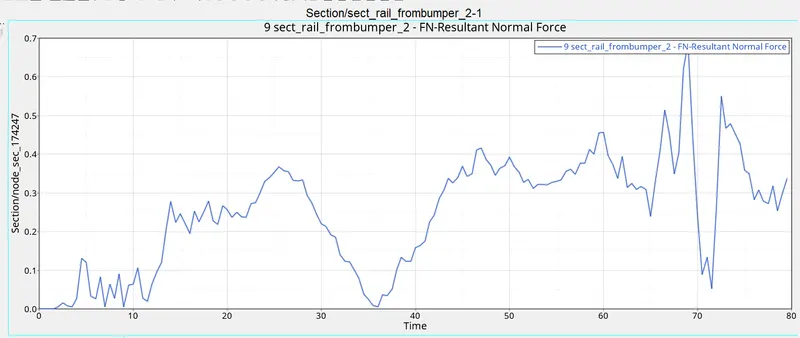
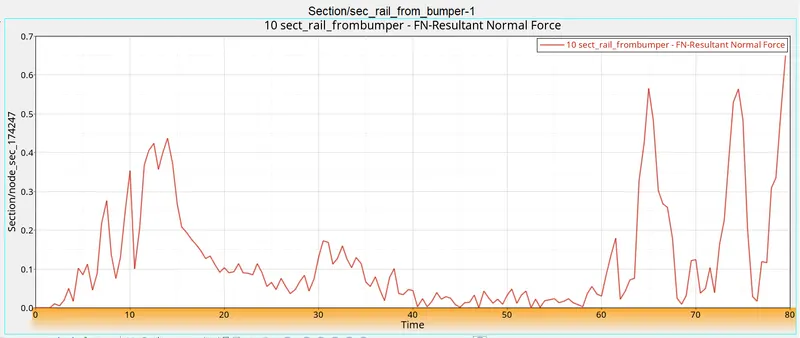
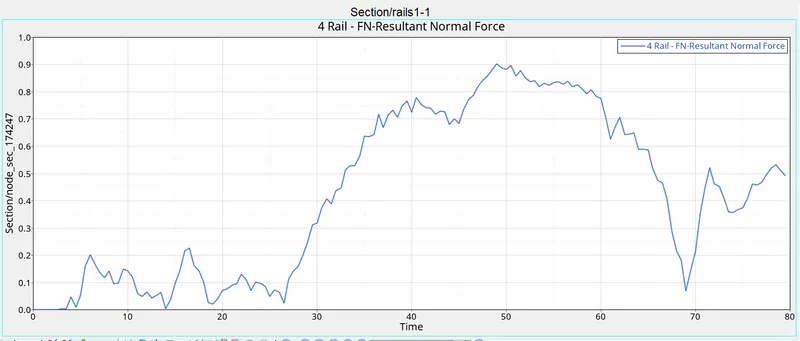
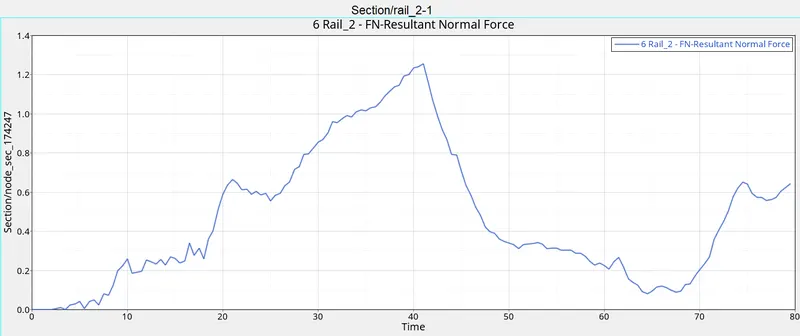
Shotgun has not uniform cross-section , we can see that variations are more as compared to second case |
|
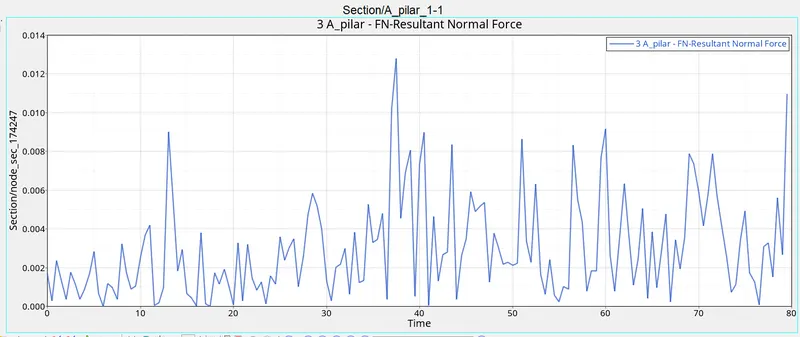 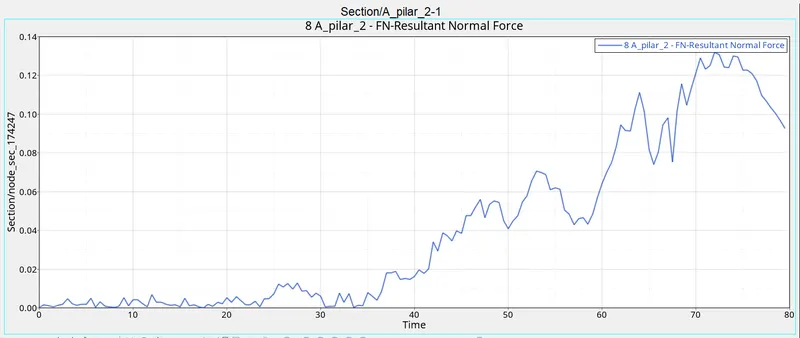 |
In A- pilar in 1st graph variation are more than 2nd graph it means 1st graph's A- pillar recieve more normal forces than 2nd graph |
|
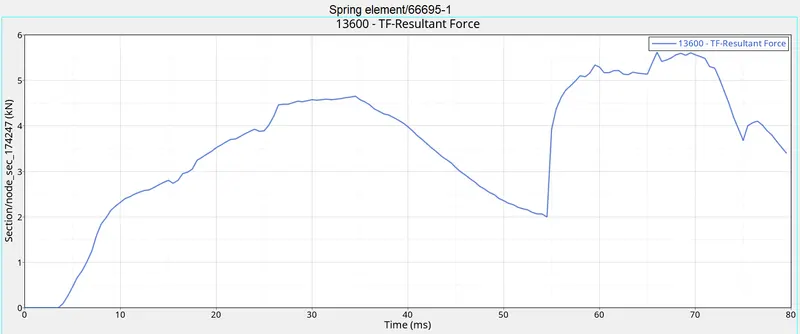 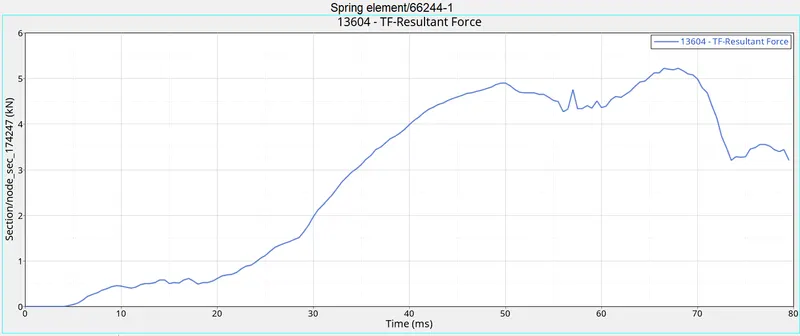 |
In this case Intrusions on the dash wall 66695,66244 have very less variation as compared to all , here we are measuring the Forces by connecting springs with lower stiffness |
|
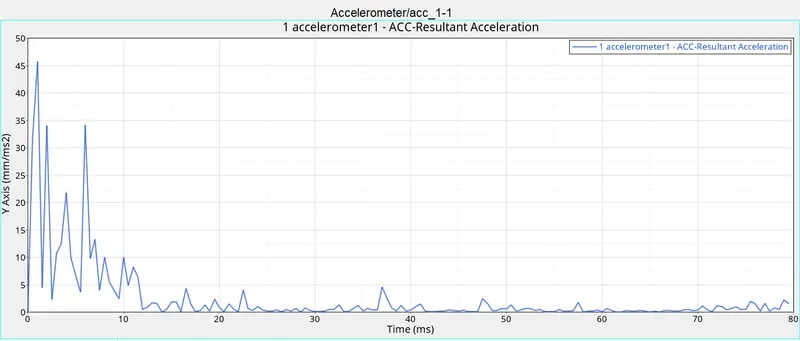 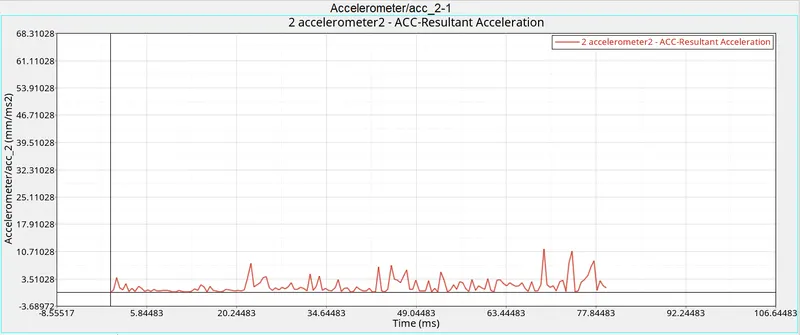 |
Acceleration curve received on the accelerometer at base of B pillar (on B pillar rocker). we can observed in 1st graph after impact it de-accelerate after 10 sec where as in second plot acceleration very low |
Energy variation Plots
| Energy | Plots | Remarks and conclusions |
| Internal Energy | 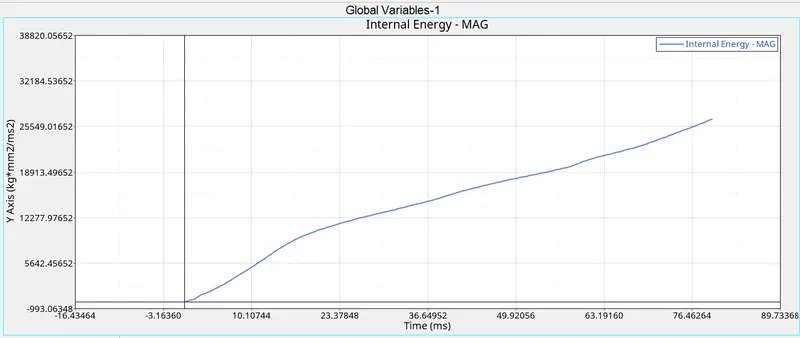 |
Here we can see that Internal energy increases after the impact |
| Kinetic Energy | 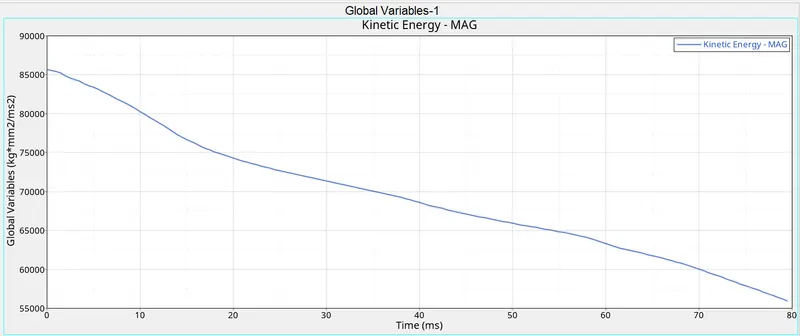 |
Here we can observed that Kinetic energy decreases after the impact It means that after the impact KE is coverted into Contact,Internal and other type of energy |
| Contact Energy | 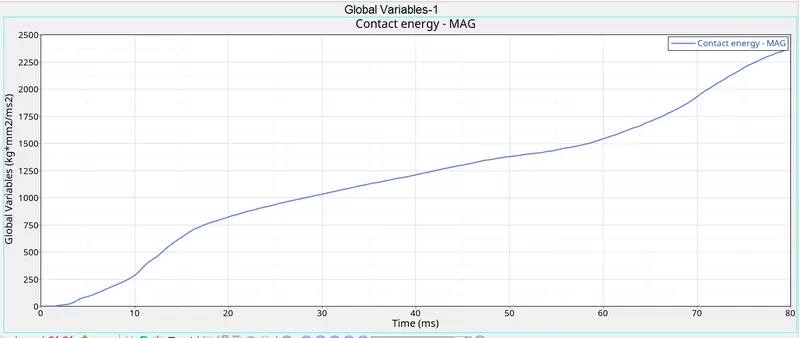 |
Here we can see that Contact energy increases after the impact |
| Total Energy | 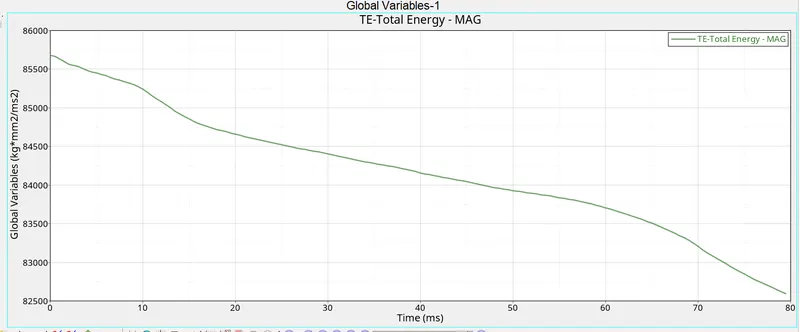 |
Here the total energy is decreases , it means the tranfer of after the impact is proper , lower energy higher will stability, |