Assignment 6-Frontal Crash Simulation Challenge
FRONTAL CRASH ANALYSIS
Aim & Objective:
The main aim is to perform frontal crash analysis in the neon model with the recommended parametres and output requests.
- Check unit system and either follow[Mg mm s] or [Kg mm ms].
- Create appropriate interface ,friction 0.2 and recommended parameters.
- Make sure of no penetrations and intersection.
- Correct rigid bodies if any issues.
- Create rigid wall with friction 0.1.
- Compare the model weight with the full scale 300k nodes model and use added masses to reach target weight 700kg while getting CG about the required range.
- Initial velocity 35 mph.
- Use model checker to ensure good quality.
- Time-step :0.5 to 0.1 microseconds.
- Run 80 ms.
PROCEDURE:
Generally the procedure for crash involves
1) Pre-Processing.
2) Processor.
3) Post-Processing.
PRE-PROCESSING:
The unit system is confirmed from the starter file and throughout this analysis the carried out unit convention is kg mm ms.
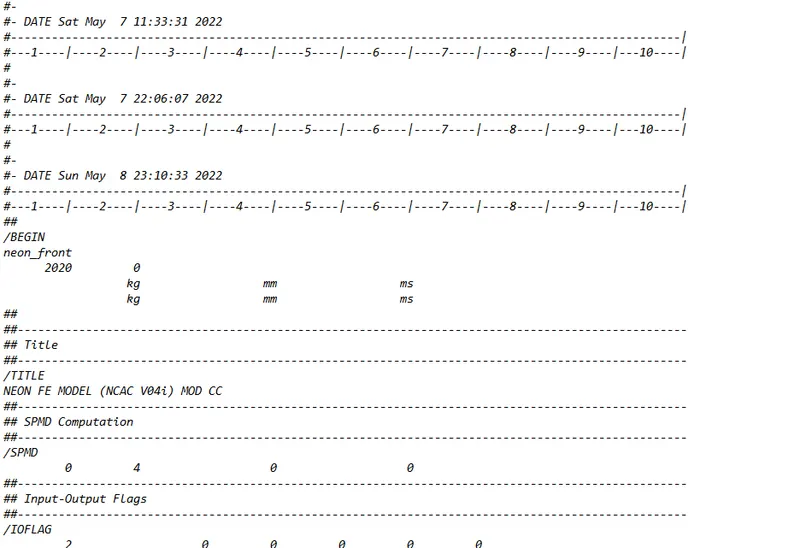
FIG 1. UNIT SYSTEM CONFIRMATION
INTERSECTION & PENETRATION CHECK.
The intersection and penetration check is made to get rid of results get affected. Open Contact interface in Hypercrash > Select check penetration check option.
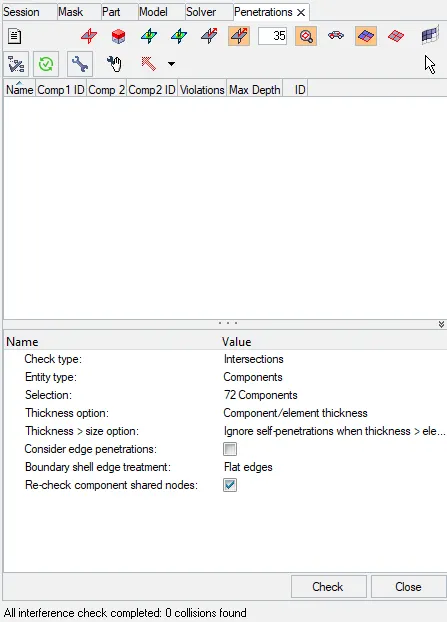
FIG 2. INTERSECTION CHECK
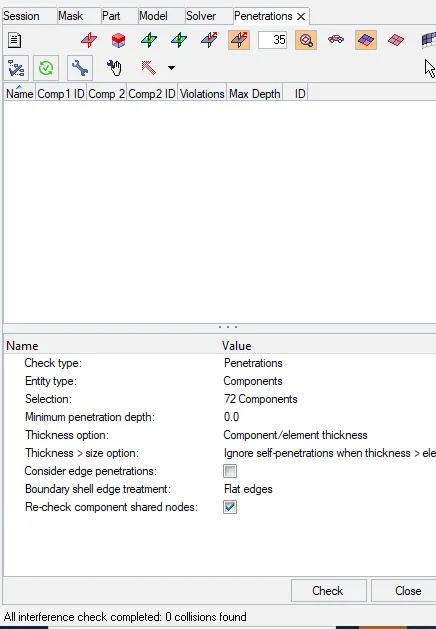
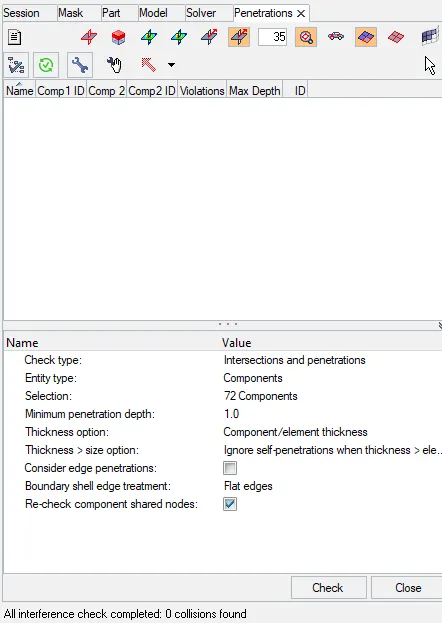 FIG 3. PENETRATION CHECK Intersection and Penetration.
INITIAL VELOCITY:
For this model an initial velocity of 15.6464 mm/ms (35mph) is applied to the car model to initiate the crash sceneraio. Right click on the Tool bar inside solver deck and select Intial velocity option under Boundary condition. It is applied in Vx direction perpendicular to rigid wall.
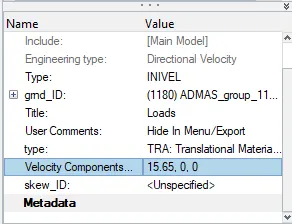
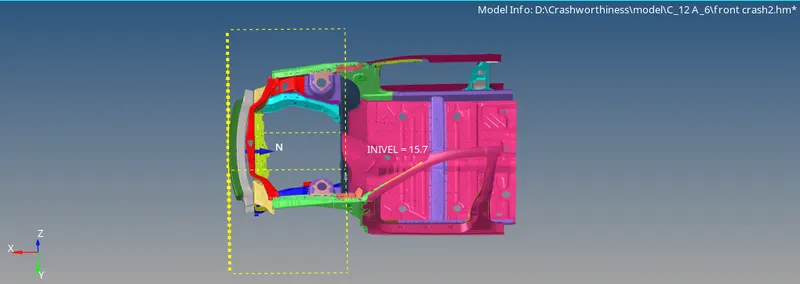
FIG 4. INITIAL VELOCITY
CONTACT INTERFACE:
Make connection with type7 to represent Self contact with recommended parameters by deleting the already created 6 contacts. Friction for this contact is taken as 0.2 mm.
RIGHT CLICK-CREATE-INTER-TYPE7.
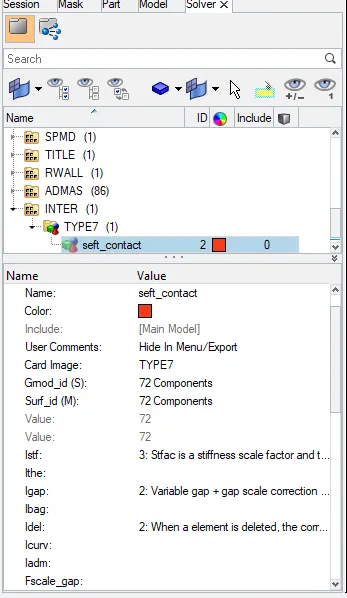
FIG 5. CONTACT INTERFACE
RIGID WALL:
The rigid wall is created at the bumper section for representing the wall properties for the crash. Here Dsearch value is taken as 1000 mm with friction 0.1 mm to search for slave nodes.
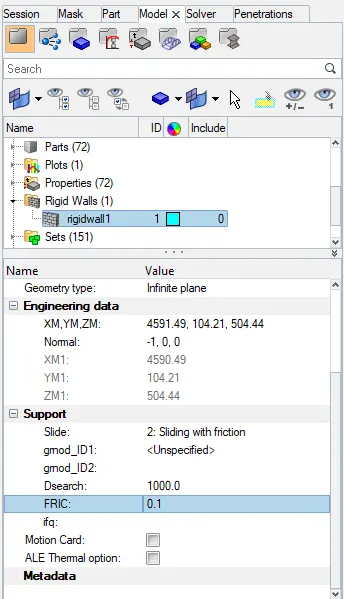
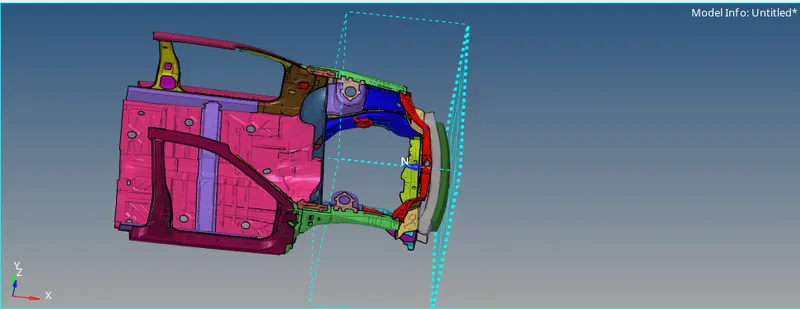
FIG 6. RIGID WALL
MASS BALANCING:
Initially the mass of the model is 118 kg, in order to represent the scaled model into full car model, the mass is converted to 700 kg. Right click on the Solver deck and craete ADmas card to add mass to the model.
Additional mass of 581.48 Kg is added to node as highlighted, so that full car model is represented and we have COG located exactly near the driver Seat as recommended.
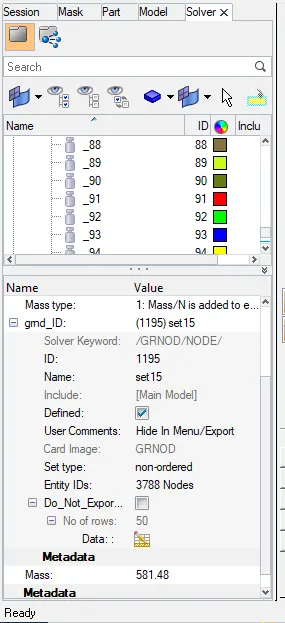
FIG 7. MASS BALANCING
The below image shows the full scale model i.e 700 Kg. Use Tools > Mass Details > Mass, cog only to check the imputed mass.
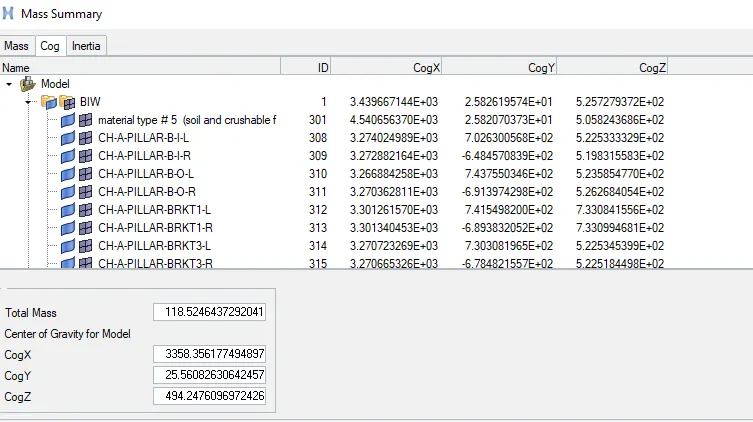
add mass 581.48 kg by using Right click on the Solver deck and craete ADmas card to add mass to the model.
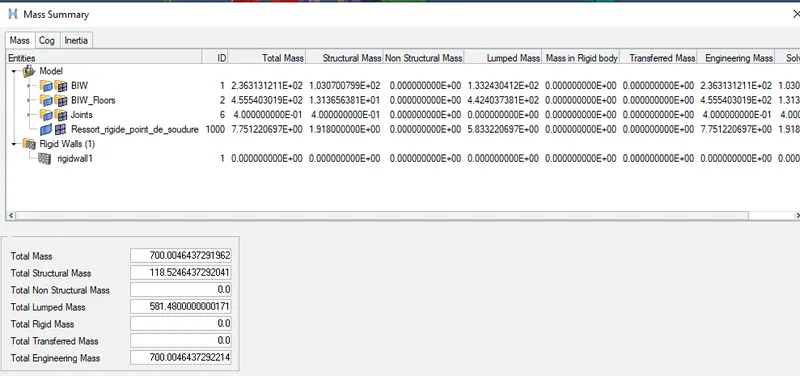
FIG 8. TOTAL MASS
Before starting to run the simulation, it is necessary to check for error in the model. For this use Tools > Model Checker > Radioss Elements.
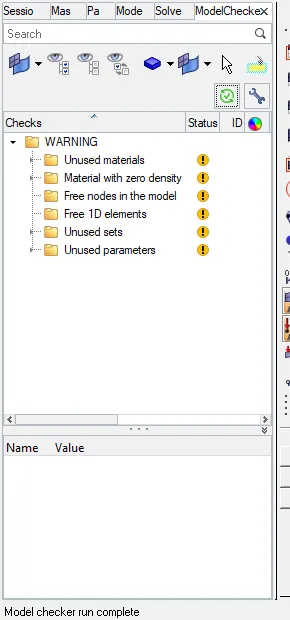
FIG 9. MODEL CHECKER
PROCESSOR:
The simulation ran for 80000 cycles. Energy error is -1.4 % which is acceptable. Mass error is 3.54 % which is also less then 5 % and is under control as per the simulation.
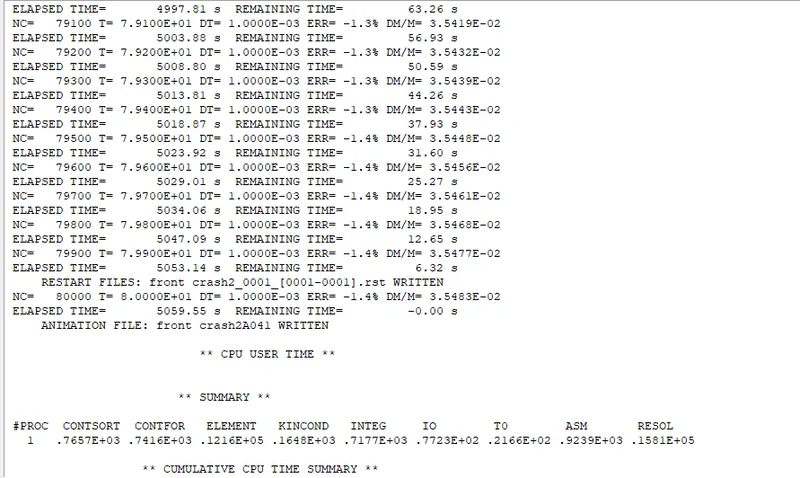
FIG 10. neon_front_0001.OUT FILE
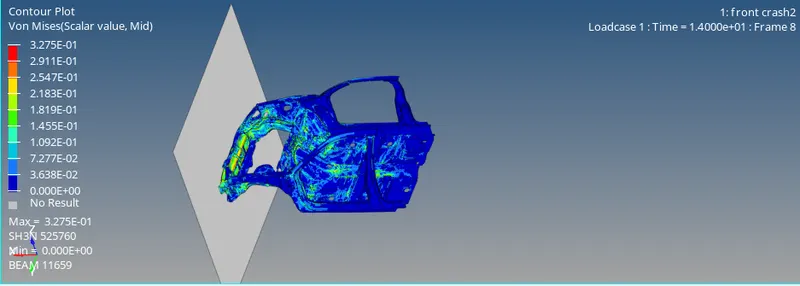
FIG 10.1 ANALYSIS REPRESENTATION
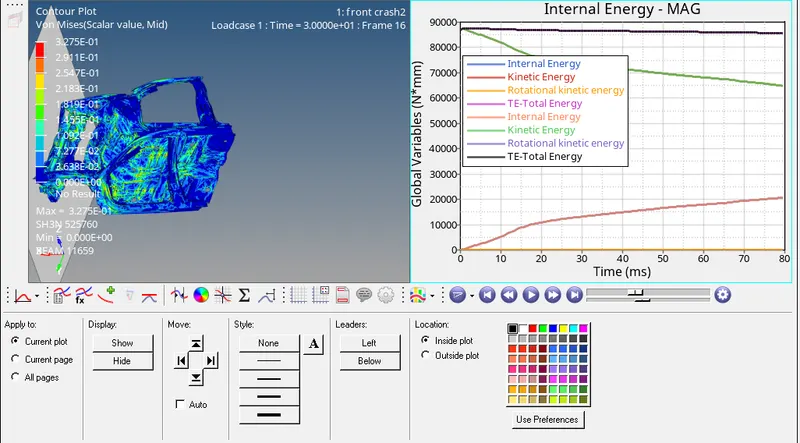
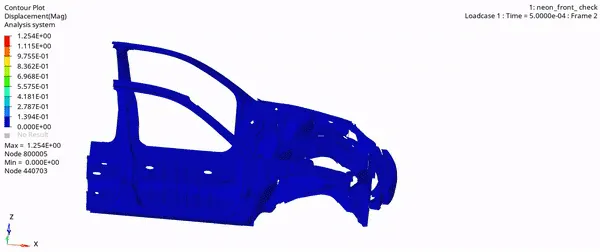
FIG 10.2 DISPLACEMENT REPRESENTATION
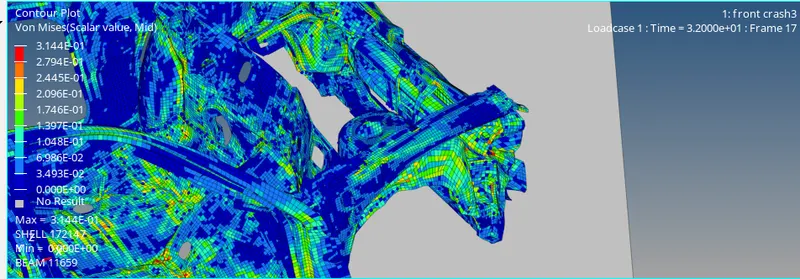
FIG 10.2 VON MISES REPRESENTATION
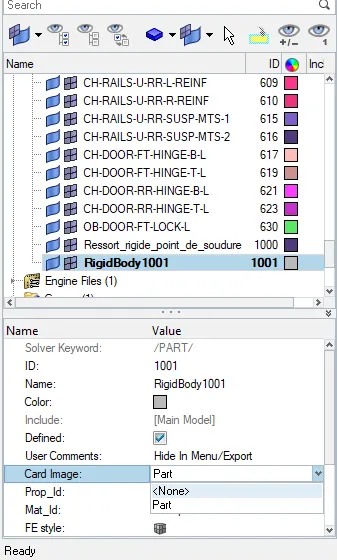
ERROR 1
Error occurs to rigid body 1001 for propert and material.
rigit body has the infinite stiffness so we doesnt have assign any material and property.
we should have card image :None.
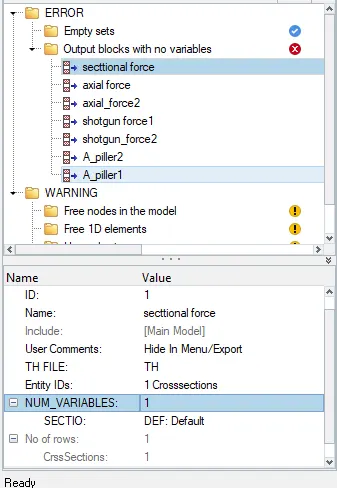
ERROR 2.
error occurs for num_variable was not assign to sectional forces in Output Block.
num_variable 1.
POST PROCESSING:
Post Processing involves plotting the results and analyzing them after the simulation has terminatted.
1) Create Cross section in
- Rail
- Shot Gun
- Fender
- A-Pillar
2) Create Accelerometer at the base of B-Pillar.
3) Create Intrusion near the dash wall to study the effects of force in the dash wall.
SECTIONAL FORCE:
Create a frame which is movable at Rail, Shot gun, Fender & A-Pillar to study the effects of force on them respectively.
Select N1 (Origin node), N2 (Axis Direction), N3 (Plane at frame should be created).
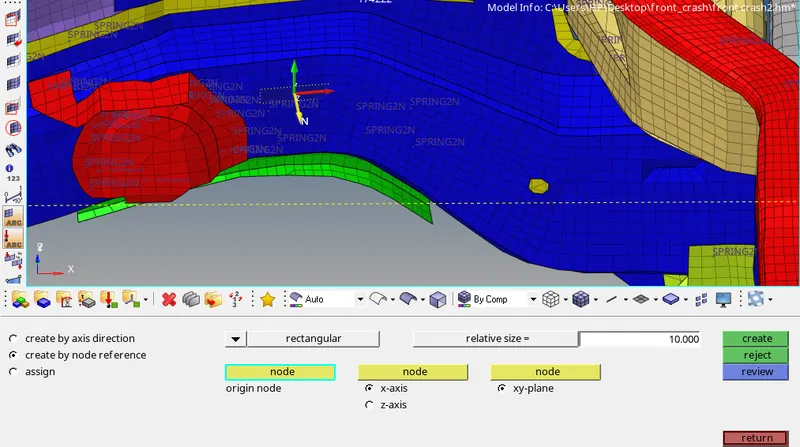
FIG 12. FRAME CREATION
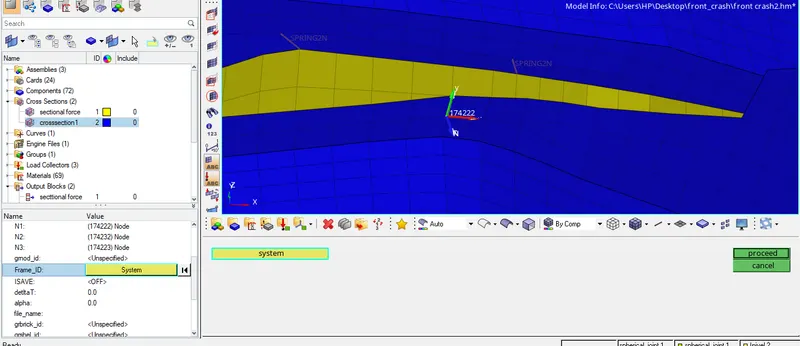
Select the highlighted system for frame as created earlier select and proceed button.
FIG 13. CROSS SECTION CREATION
Select the frame created in the Frame ID for cross section. Use Delta as 0.1mm and alpha as 1.64mm. Hence the necessary cross section is created to analyse the effect of forces.
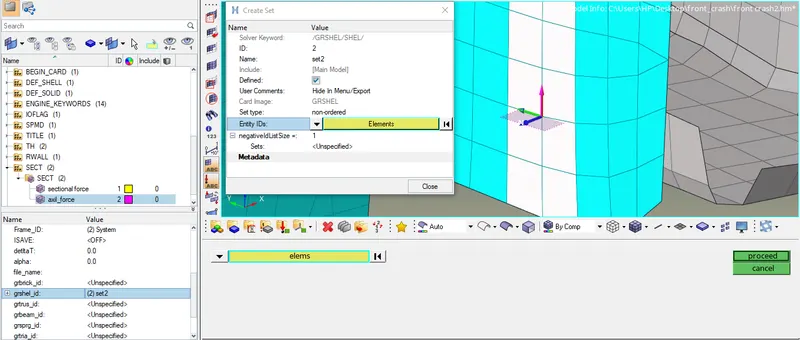
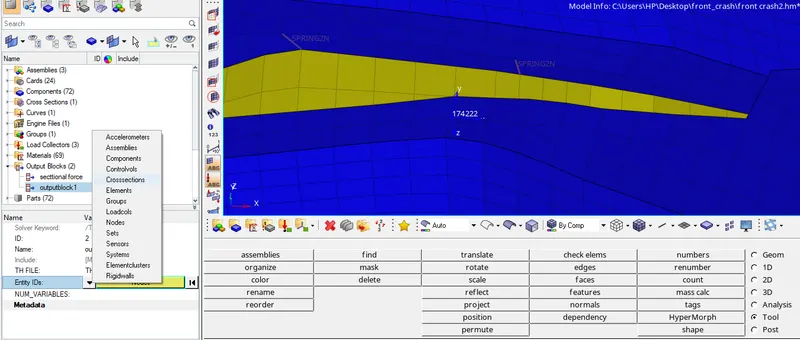
FIG 14. CROSS SECTION CREATION
select crossection element group near of highlited node and proceed.
SHOTGUN:
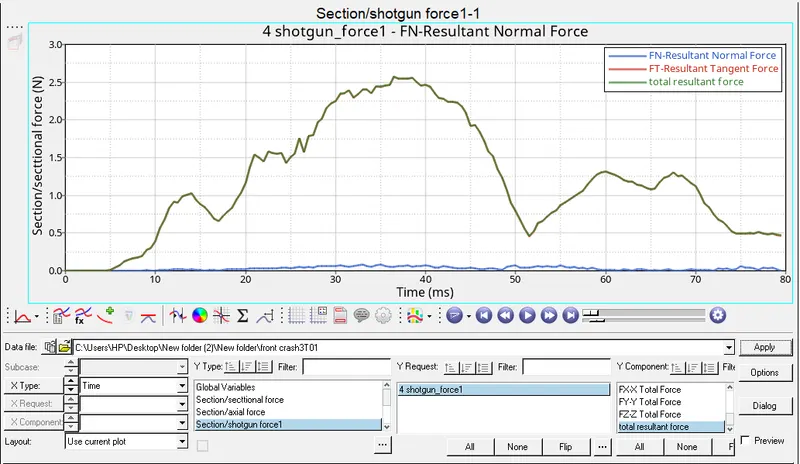
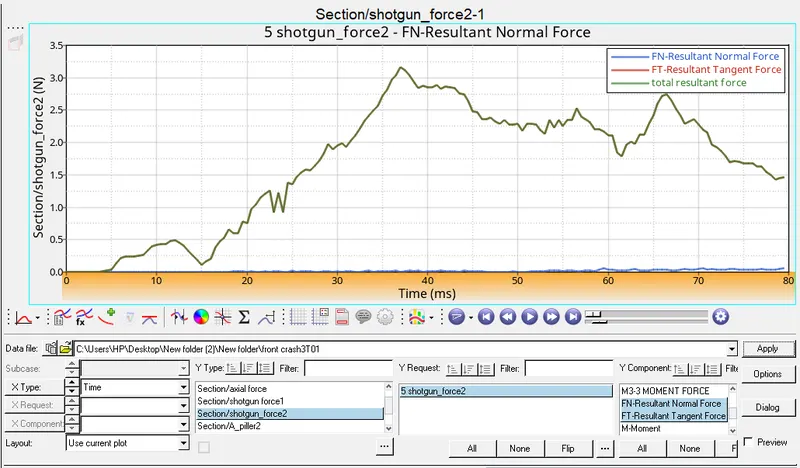
FIG 15. SHOT GUN PLOT
As soon as the Car hits the rigid wall, its the shot gun which gets damaged heavily compare to other parts. As per the plot, Shot Gun left and Shot Gun Right absorbs 2.6 N at 37 ms and 3.2 N at 38 ms of force respectively and decreases.
FENDER:
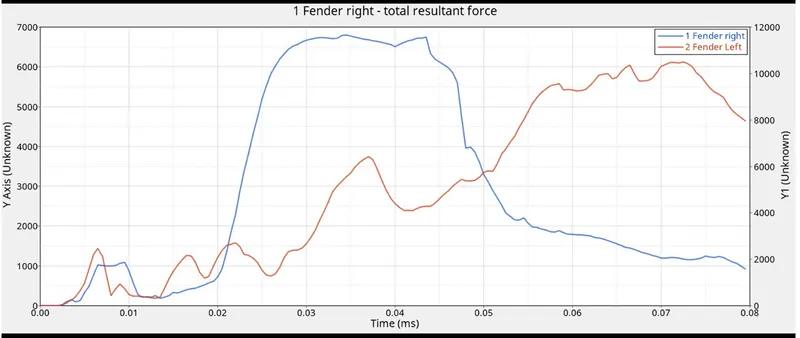
FIG 16. FENDER PLOT
From the fender plots, we can infer that right fender absorbs maximum force compared to the left one.
Right Fender - 6.8 KN at 0.043 ms
Left Fender - 3.7 KN at 0.037 ms
RAIL:
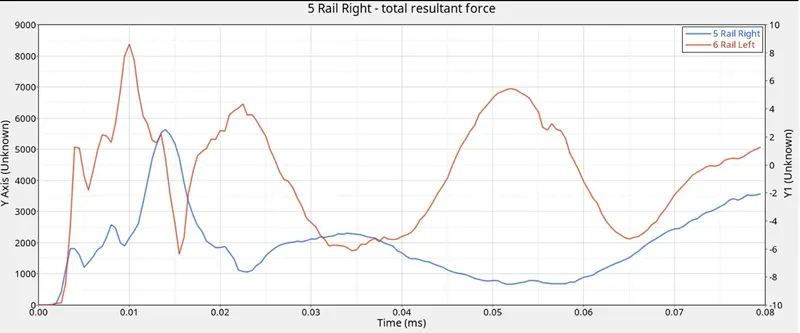
FIG 17. RAIL COMPONENT PLOT
After Shot gun, according to simulation, rail component is the next which absorbs more energy.
Left Rail - 8.3 KN at 0.01 ms
Right Rail - 5.6 KN at 0.014 ms
Initially the force remains zero at both the rails, and as soon as the car hits the barrier the energy absorbing capacity increases in both left and right Rails. Left rail absorbs more energy as pert the simulation. It plays important role, since the force is transfered to the pillars through the rail component.
PILLAR:
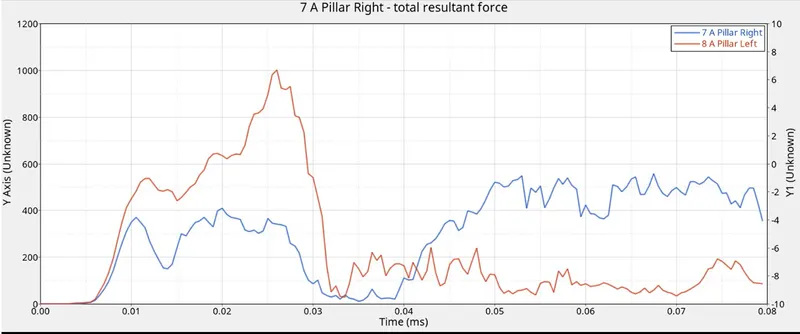
FIG 18. A-PILLAR PLOT
Left A Pillar experiences 1 KN at .026 ms and is the highest force compared to Right A pillar which experiences 0.58 KN at 0.053 ms.
Left A Pillar experiences more forces initially and then the forces decreases at 0.033 ms, & it increases upto 0.2 KN.
At 0.033 ms in Right A Pillar, the force absorbing capacity increases upto 0.57 KN.
INTRUSION:
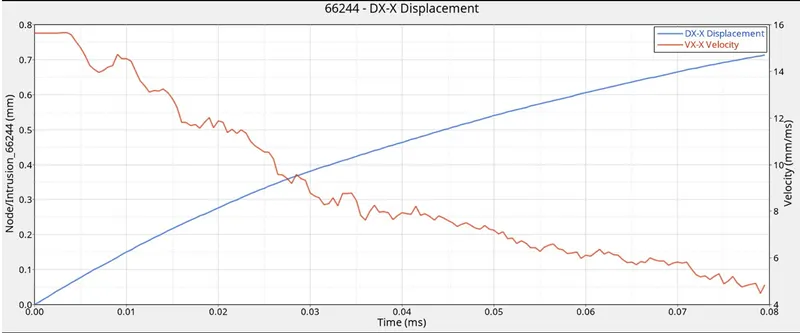
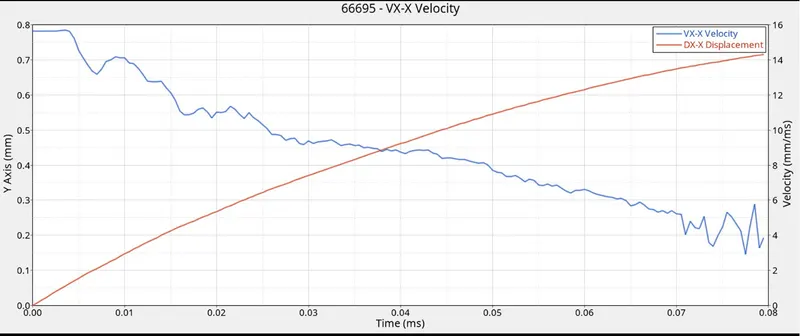
FIG 19. INTUSION at 66244 NODE FIG 20. INTUSION at 66695 NODE
At 66244 & 66695 node location, the intruded force is at its peak due to the absence of components of a car. If the components are present, they will absorb the force and the rest will be impacted on the dash wall.
ACCELEROMETER:
The acceleromter is placed at the bottom of both sides of the B-Pillar to record the acceleration at the bottom of B-Pillar.
by right click and create acceleromete at bottom of B PILLER and create Output Block and entity id as Accelerometers and num of variable should be 1
and ACCEL made by defoult.
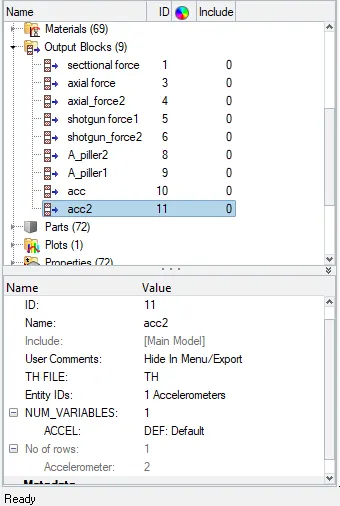
FIG 21. ACCELEROMETER
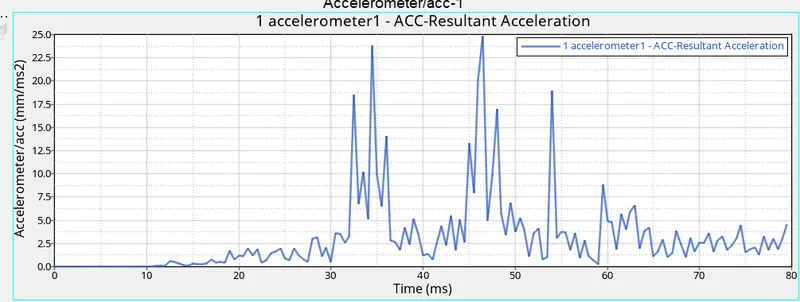
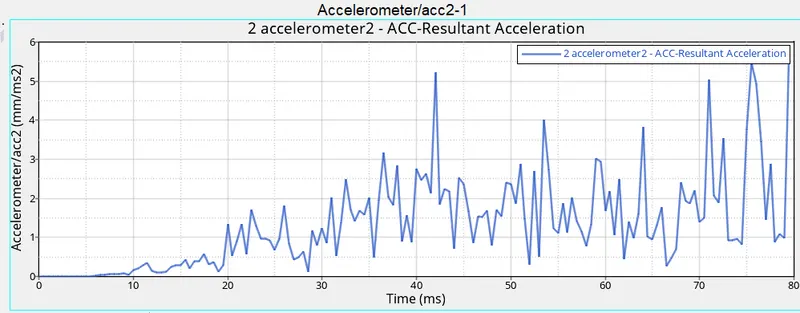
FIG 22. ACCELEROMETER PLOT
The accelerometer at the right side (graph1) has high acceleration value (25 mm/ms^2 at 47 ms) and decreases.
For left accelerometer, maximum accekeration value comes at 76ms for a vlaue of 5.5 mm/ms^2 and then decreases and increases.
The left accelerometer placed at the left side has high acceleration compared to right side.
CONCLUSION:
Thus frontal crash has been analyzed on the neon model and the observation are analyzed and recorded. On stduying the results, the forces absorbed are high in the order from Shotgun, Rail, Fender and A-Pillar respectively. These results are not most accurate eventhough the mass is balanced & COG is located at its exact position. If we want more accurte results, it is adviced to use full scale neon model for the simulation.