Assignment 6-Frontal Crash Simulation Challenge
AIM;
To analyse the given BIW body model by using the hyperworks(radioss) and hypercrash.
INTRODUCTION;
BIW refers to the body shell design of an automotive product such as cars. It is just a sheet metal welded structure. BIW will not have doors, engines, chassis or any other moving parts.
BIW Types: There are mainly two types
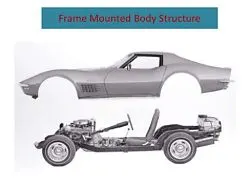
Frame Mounted Body Structure
Monocoqe Body Structure
- Frame Mounted Body Structure ;Its also called as Body on Frame construction.In this type Body is mounted on the Chassis/Frame. Powertrains and suspension are mounted on chassis. Used in utility vehicles, trucks, buses.
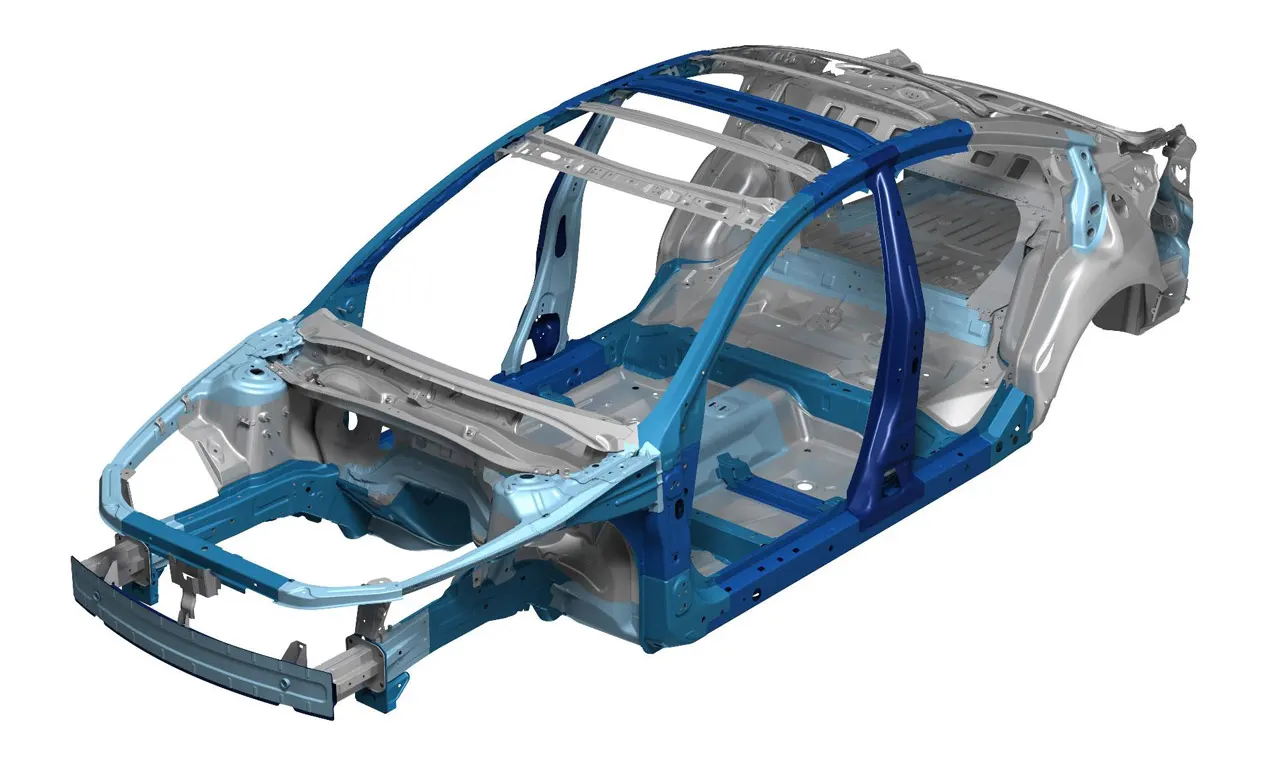
- Monocoqe Body Structure ;It also called as Chassis in built in Body. Chassis/Frame is inbuilt with BIW itself and there is no separate chassis. Powertrains and suspension are directly mounted to BIW.
Monocoque also called structural skin, is a structural system in which loads are supported by an object's external skin, similar to an egg shell
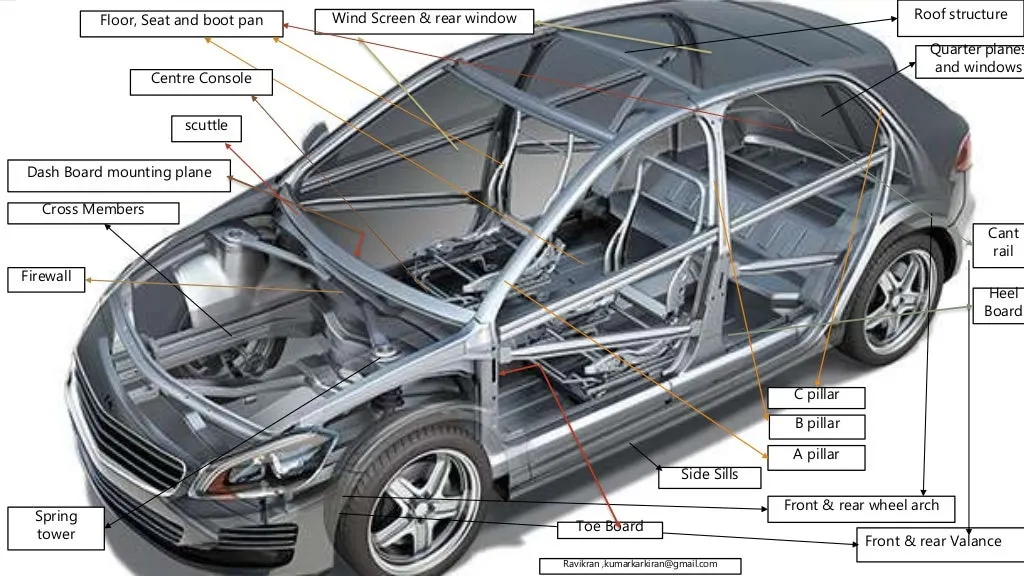
BIW Components:
A pillars is the front most support of the roof.
B pillars is the second support of the roof.
C/D are last support of the roof.
Dashboard mounting panel ; A dashboard (also called dash, instrument panel (IP), or fascia) is a control panel located directly ahead of a vehicle's driver, displaying instrumentation and controls for the vehicle's operation.
Windscreen & Rear Window rail ;Windshields protect the vehicle's occupants from wind and flying debris such as dust, insects, and rocks, and provide an aerodynamically formed window towards the front.
Cant rail
Roof structure
Side Sill
Quarter panel or window
cross member
Front & rear Valance
Scuttle
Firewall
Floor, seat & Boot pan
Front & rear Spring tower
Central Console
Front & Rear Wheel arch
Toe Board
Heel Board
HOW CRASH TESTING WORKS;
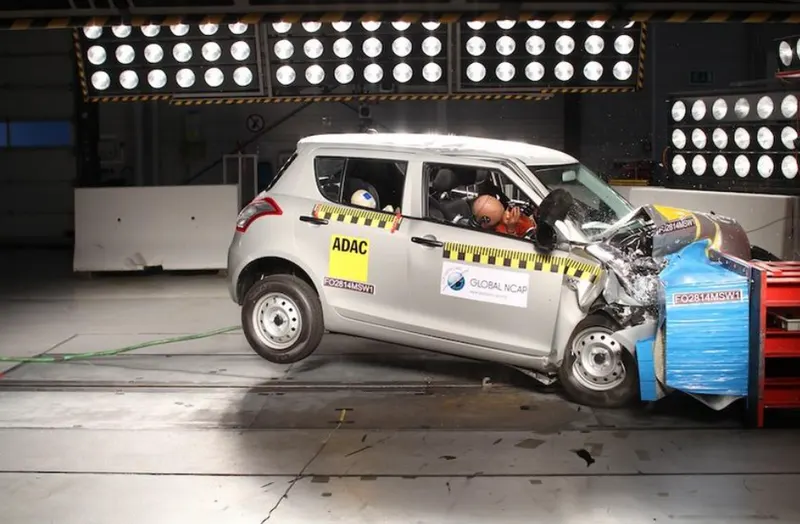
A crash test is a form of Destructive testing usually performed in order to ensure safe design standards in crashworthines and crash compatability for various modes of transportation related systems and components.
Crash test dummies have been the subject of public service announcements, cartoons, parodies, even the name of a band. Real crash test dummies, however, are true life-savers as an integral part of automotive crash tests. Even though cars get a little safer each year, and fatality rates are declining, car crashes are still one of the leading causes of death and injury in the United States.
One of the reasons cars have been getting safer is because of a well-established testing program.
The dummies contain three types of instrumentation:
- Accelerometers
- Load sensors
- Motion sensors
Accelerometers
These devices measure the acceleration in a particular direction. This data can be used to determine the probability of injury. Acceleration is the rate at which speed changes. For example, if you bang your head into a brick wall, the speed of your head changes very quickly (which can hurt). But, if you bang your head into a pillow, the speed of your head changes more slowly as the pillow crushes (and it doesn't hurt).
The crash-test dummy has accelerometers all over it. Inside the dummy's head, there is an accelerometer that measures the acceleration in all three directions (fore-aft, up-down, left-right). There are also accelerometers in the chest, pelvis, legs, feet and other parts of the body.
Load Sensors
Inside the dummy are load sensors that measure the amount of force on different body parts during a crash.
Movement Sensors
These sensors are used in the dummy's chest. They measure how much the chest deflects during a crash.
-
Crashworthiness Requirements
The vehicle structure should be sufficiently stiff in bending and torsion for proper
ride and handling. It should minimize high frequency fore-aft vibrations that give
rise to harshness. In addition, the structure should yield a deceleration pulse that
satisfies the following requirements for a range of occupant sizes, ages, and
crash speeds for both genders:
Deformable, yet stiff, front structure with crumple zones to absorb the crash
kinetic energy resulting from frontal collisions by plastic deformation and
prevent intrusion into the occupant compartment, especially in case of offset
crashes and collisions with narrow objects such as trees.
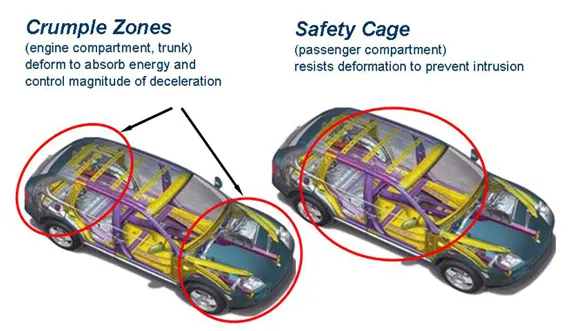
- Short vehicle front ends, driven by styling considerations, present a challenging task to the crash-worthiness engineer.
- Deformable rear structure to maintain integrity of the rear passenger compart-
ment and protect the fuel tank. - Properly designed side structures and doors to minimize intrusion in side
impact and prevent doors from opening due to crash loads. - Strong roof structure for rollover protection.
- Properly designed restraint systems that work in harmony with the vehicle
structure to provide the occupant with optimal ride down and protection in
different interior spaces and trims. - Accommodate various chassis designs for different power train locations and
drive configurations.
STEPS TO FOLLOW THE PROCEDURE;
- Check unit system and either follow[Mg mm s] or [Kg mm ms].
- Create appropriate interface ,friction 0.2 and recommended parameters.
- Make sure of no penetrations and intersection.
- Correct rigid bodies if any issues.
- Create rigid wall with friction 0.1.
- Compare the model weight with the full scale 300k nodes model and use added masses to reach target weight 700kg while getting CG about the required range.
- Initial velocity 35 mph.
- Use model checker to ensure good quality.
- Time-step :0.5 to 0.1 microseconds.
- Run 80 ms.
Required Output requests:
- Sectional force in the rails at location of indicated node 174247.
- Axial force received on the rails from bumper.
- Shotgun cross sectional forces.
- A pillar cross section.
- Acceleration curve received on the accelerometer at base of B pillar (on B pillar rocker).
- Intrusions on the dash wall 66695,66244.
GIVEN MODEL;
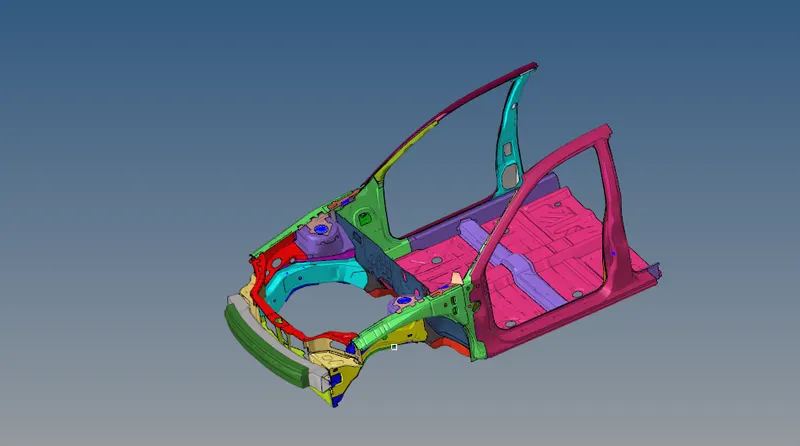
Check unit system and either follow[Mg mm s] or [Kg mm ms].

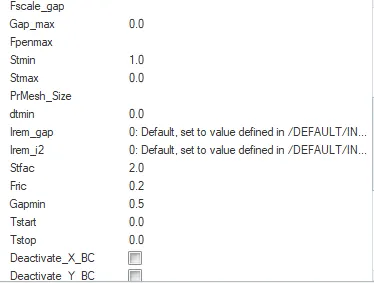
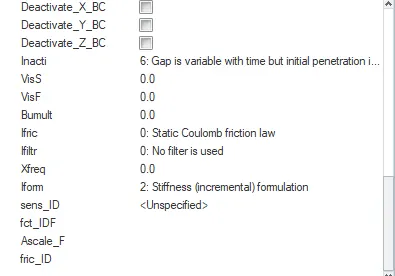
Create appropriate interface ,friction 0.2 and recommended parameters.
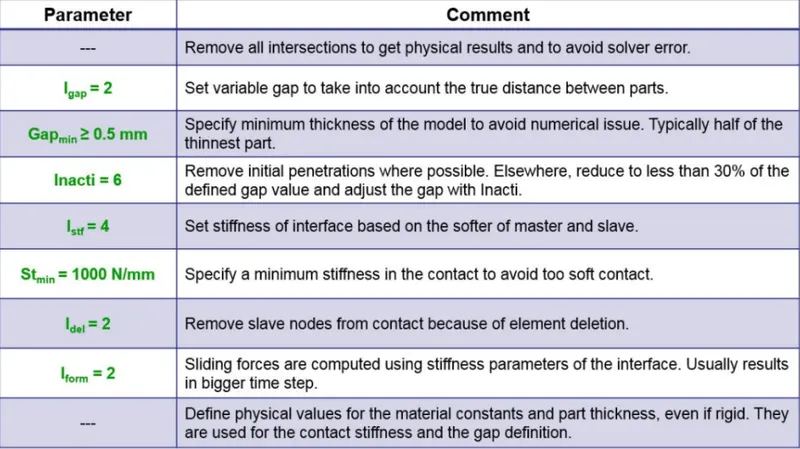
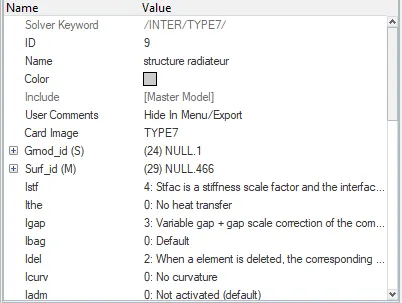
For creating an apporiate inetrface or contact we go to the model >groups >delete the unwanted interfaces which are not use and create the new interface and change the card image as type as type 7 and friction 0.2 ,fix the those with an recommended parameters.
Igap;Determines how the size of the gap is calculated
Gapmin ;Minimum gap for activation of interface
Inacti; Action to take if initial penetrations exist
Istf; Affects how the stiffness of the interface is calculated
Iform ;Friction formulation
Stmin ;Minimum stiffness to use in the interface
Idel; Update For Deleted Elements Due To Failure
And for our model, we need to give Friction = 0.2.
HYPERCRASH;
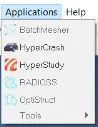
In order to open the hypercrash, go to the hyperworks >click the applications >hyper crash > it will opens a seperate window of the hypercrash and we can set the unit system according to the given unit system mention in the startor file and run the hyper works.

The contact interfaces which are available are not really useful for this particular simulation purpose , So the current contact interfaces were deleted and a new self contact interface was created with TYPE7, friction 0.2, and recommended parameters.
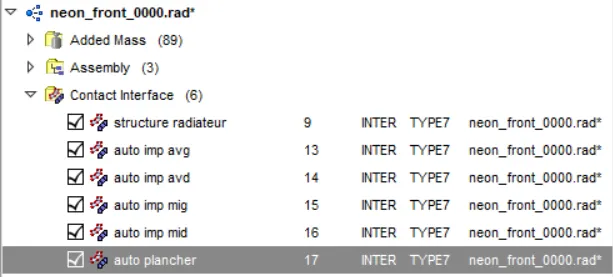
For creating a new self contact we go to the load case,there we select the contact interface and set the recommended parameters.
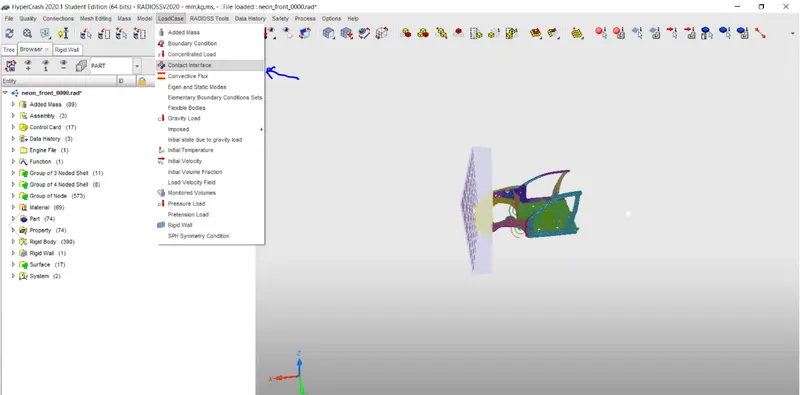
defined master and slave for the self impact.
set the recommended parameters and for our model, we need to give Friction = 0.2.
finally defines the master and slave as an self impact.
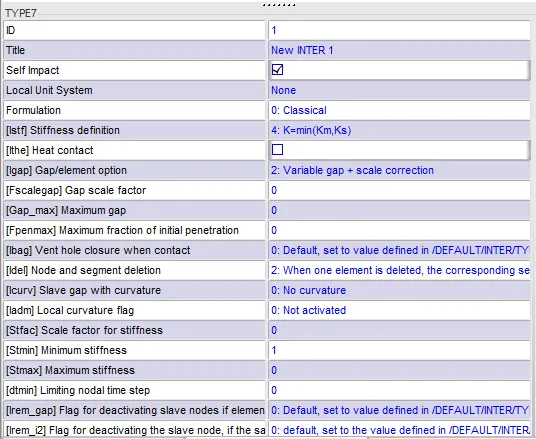
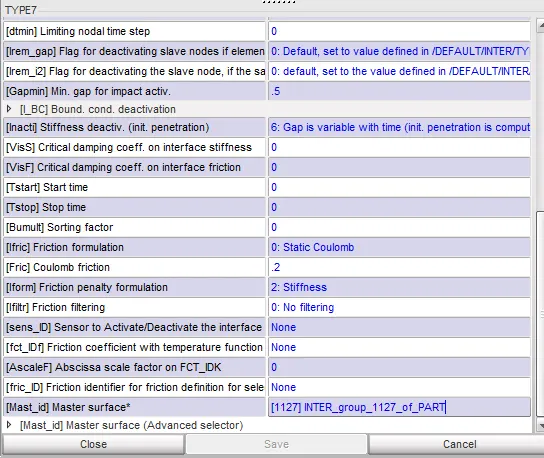
- Make sure of no penetrations and intersections.
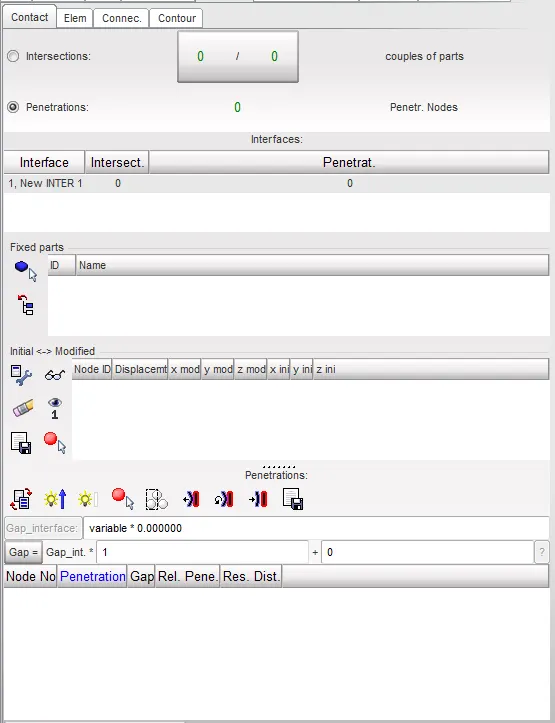
Now after setting the interface card we need to check for penetrations and intersections if any. This can be done by opening HyperCrash under Applications. In HyperCrash we need to go for quality > select the check intersections of Tree selection and click this for penetrations and intersections check
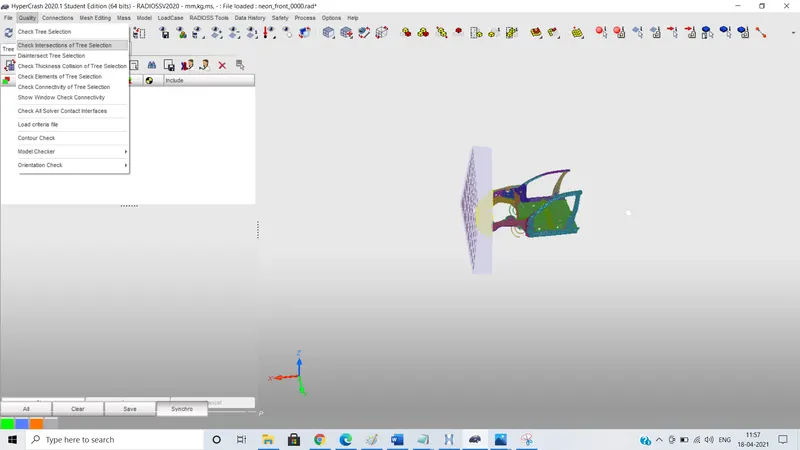
- Correct rigid bodies if any issues.
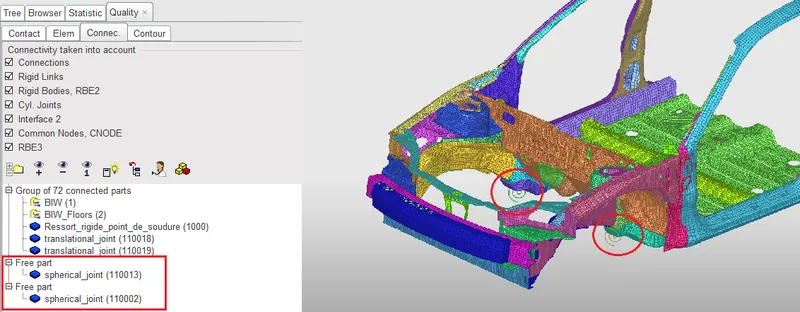
for correcting the rigid body issues go to the quality panel > click the show window connectivity check.
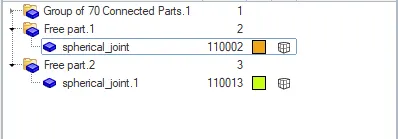
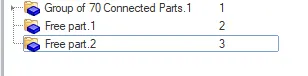
The connectivity issues showing the two parts which are not connected to the any other joints and it is free in the space.
- Create a rigid wall with friction 0.1.
Rigid Walls allows the user an easy way to define an interface between a rigid
surface and nodes of a deformable body. A rigid wall is a non-yielding retaining wall
which is defined by the user Master Node and a group of Slave Nodes.
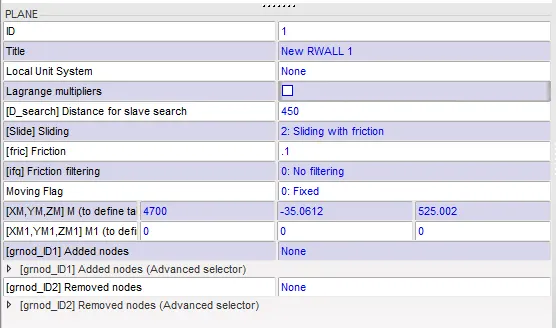
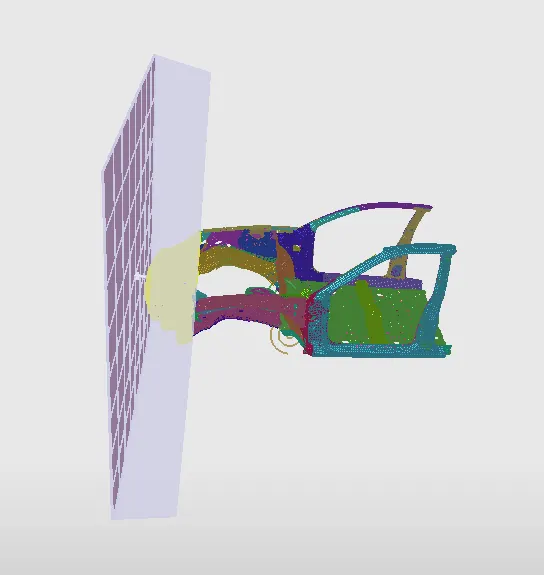
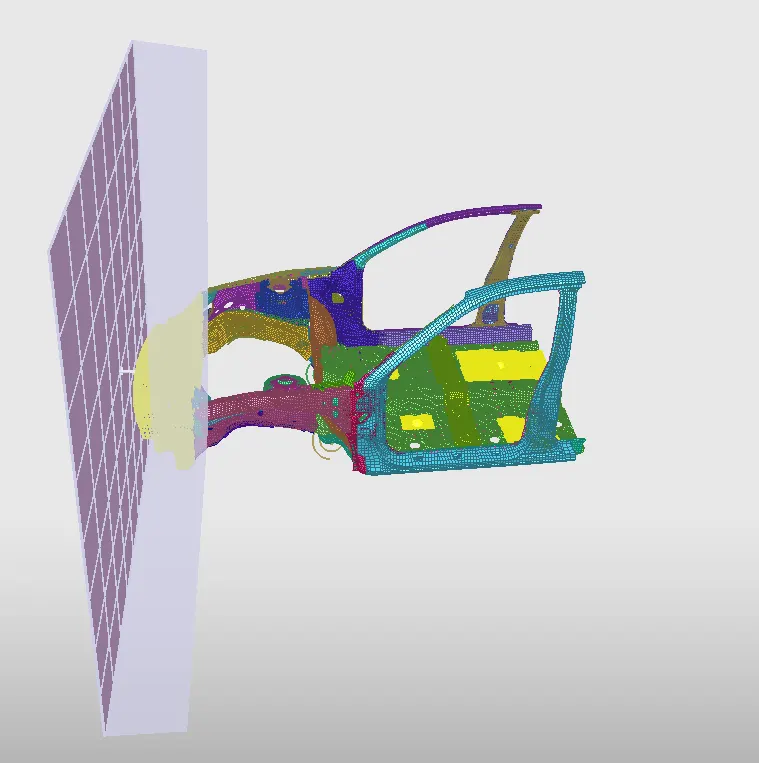
Now we will be creating a rigid wall with friction 0.1. This can be done by load case and click a Rwall of the required type(plane).
For this frontal crash scenario, we are using a plane-type RWall.
set the parametrs for the Rwall
Search distance;450.
friction;0.1.
xm,ym,zm axis.
Compare the model weight with the full-scale 300k nodes model and use added masses to reach the target weight of 700kg while getting CG about the required range
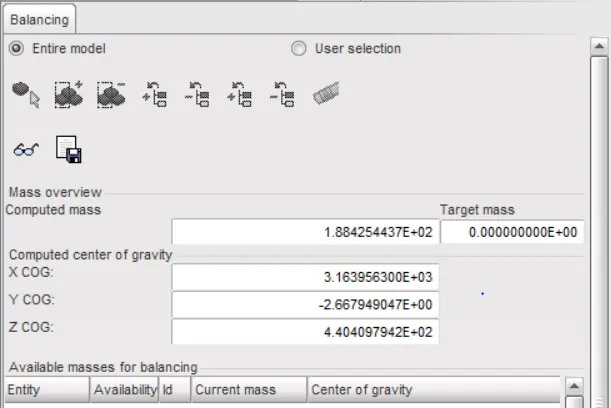
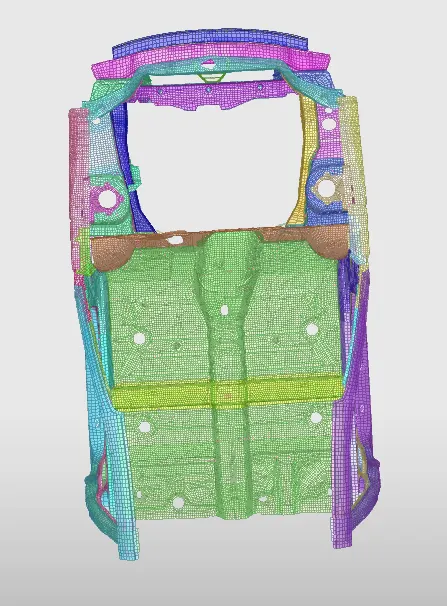
Next, we need to compare the model weight with the full-scale 300k nodes model and use added masses to reach the target weight of 700kg while getting CG about the required range. This can be done in HyperCrash easily. First, we need to check for COG and Computed mass value.
For checking the mass go to >mass>balancing and here we notice that here the mass is( 1.884254437E+02)188Kg instead of 700Kg. So we need to add mass to nodes in the model in such a manner that it reaches 700kG for 300K nodes model and also COG shifts to a position where it should be in a full car model with mass addition.
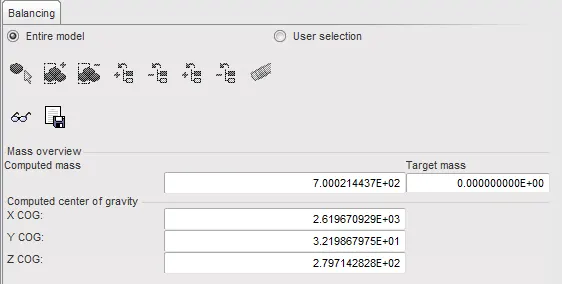
So mass addition is done under loadcase - Added Mass - Create new mass by right-clicking type 1 where mass is distributed to each node of node group.
we added the mass for the floor of the model and balance the centre of gravity.
Show COG Point icon shows the where the exactly location of the centre of gravity locates and sucessfully added the mass to bring the COG for proper location.

- Initial velocity 35 mph.
Now we need to set the initial velocity as 35mph.
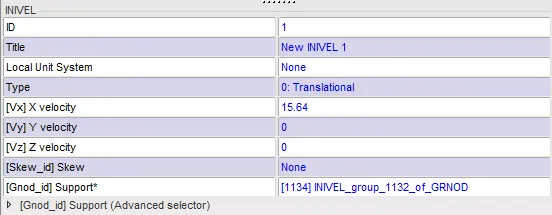
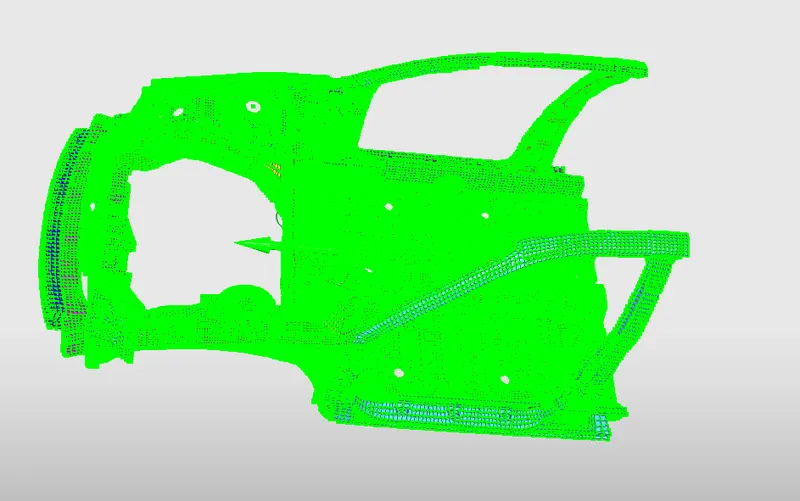
This is done by creating an INVEL card go to the load case and click the invelocity and applying it to our model. As our unit system is in mm Kg ms so we need to convert 35mpH to given unit and it comes out to be 15.64mm/ms
The invel will given in the x direction inorder to move the model in an an X direction and also select the node id support for the model.
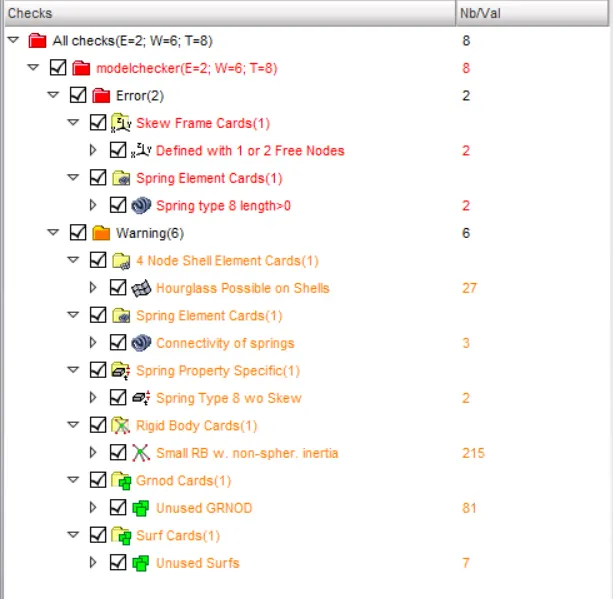
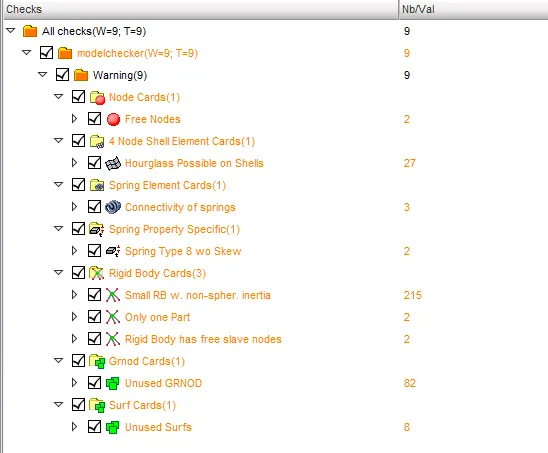
- Use a model checker to ensure good quality.
For an model checker go to the Quality and click model checker >run them.
It will defines the errors and warings , which will be need to corrct them properly and maintain the good quality.
- Time-step :0.5 to 0.1 microseconds.
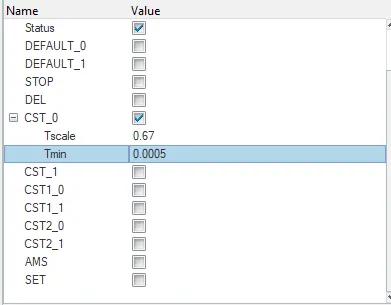
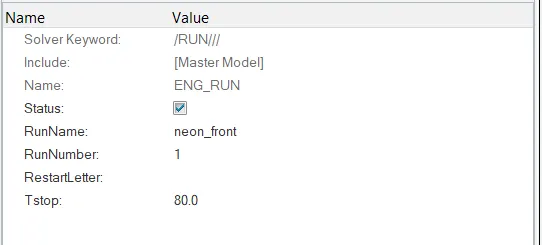
Now we need to change the timestep to 0.5-0.1ms and also Run for 80ms. As both of them are a control file so it will come under Engine Keywords. DT noda for Timestep and Engine Run for simulation time.
- Run 80 ms.
- Sectional force in the rails at the location of indicated node 174247.

The section and the moving frame is created in order to calculate section force at shotgun area, Rail component, A pillar area. So this section is requested to the output block to observe the effect of force at these areas.
A Moving frame is created in the rails at the location of indicated node 174247.
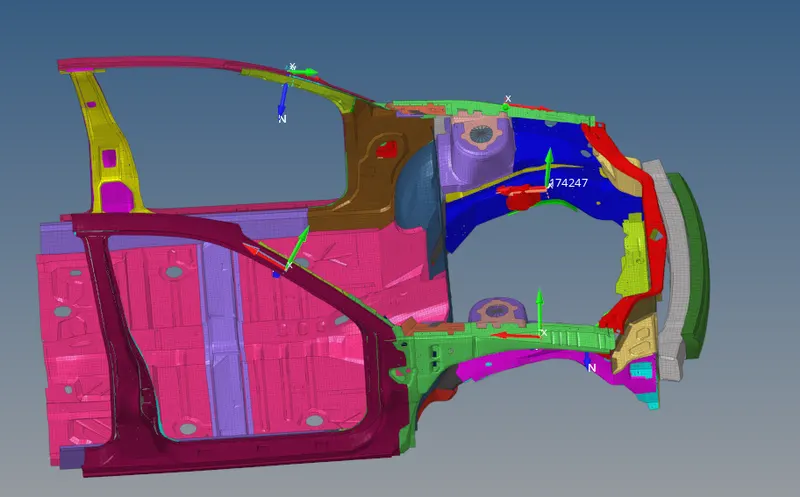
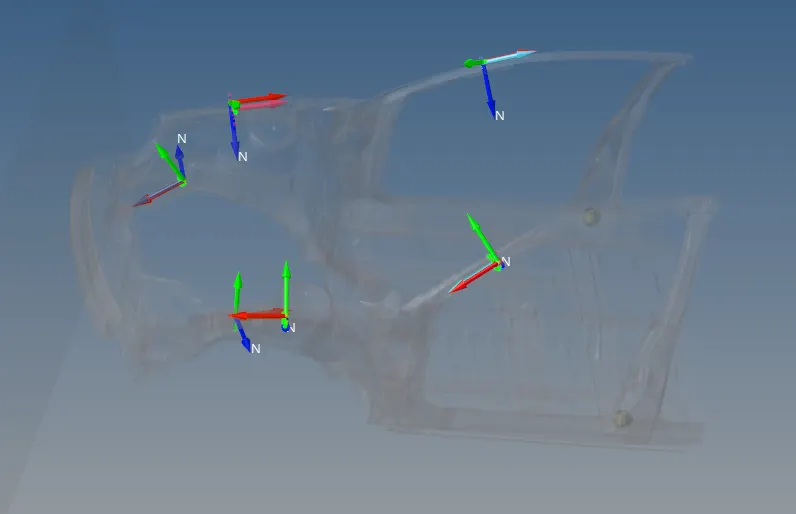
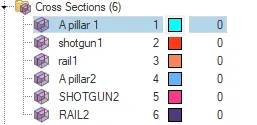
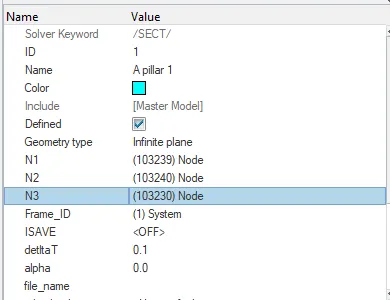
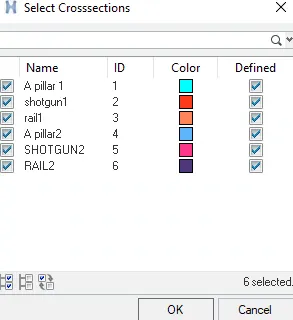
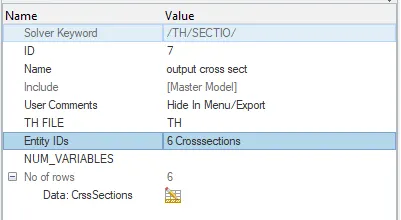
OUTPUT BLOCK FOR CROSS SECTIONS;
Model>output block>create>entityid as cross sections> select all.
- The axial force received on the rails from the bumper.
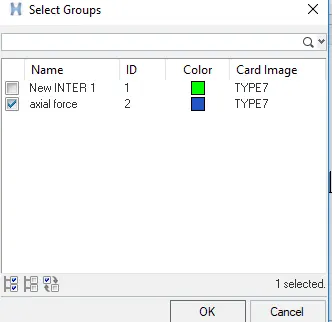
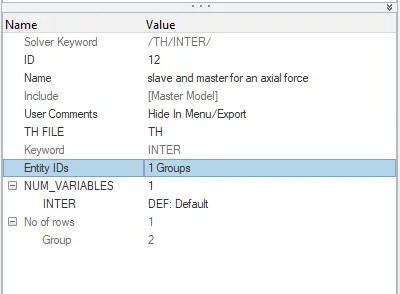
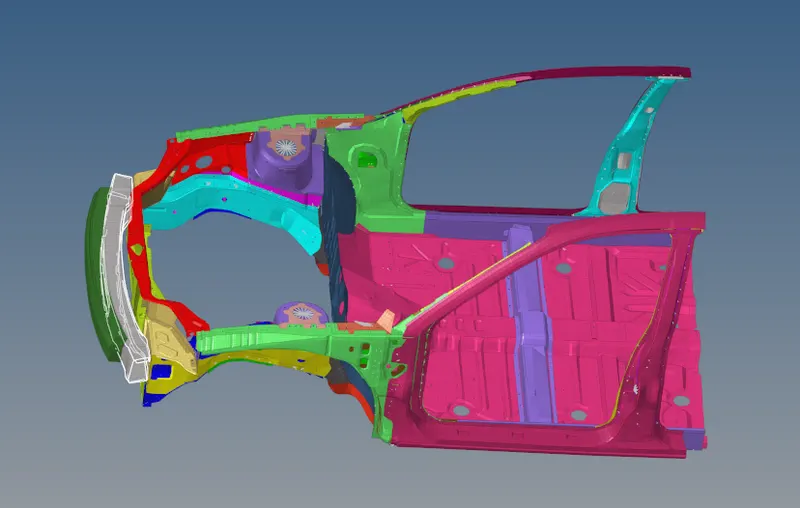
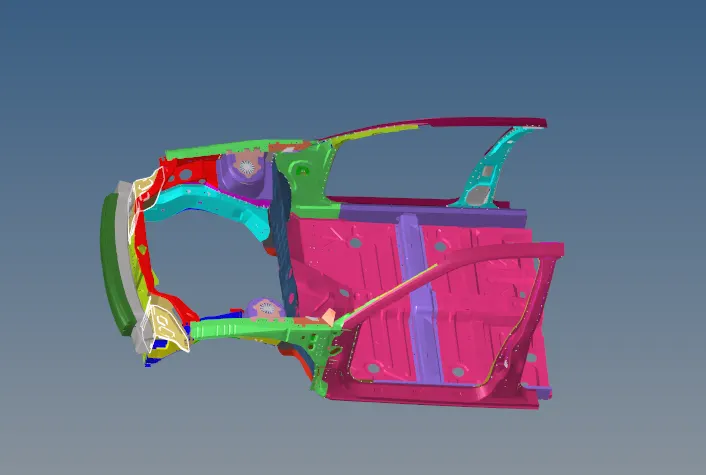
Create the seperate contact interface with the type 7 for an finding the Axial force received on the rails from bumper.
For checking the results we can create an output block for the axial forces.
 f
f
master
slave
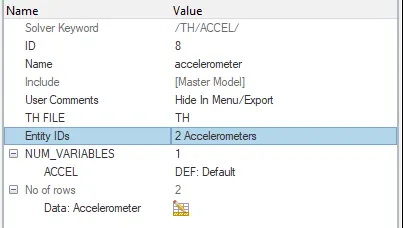
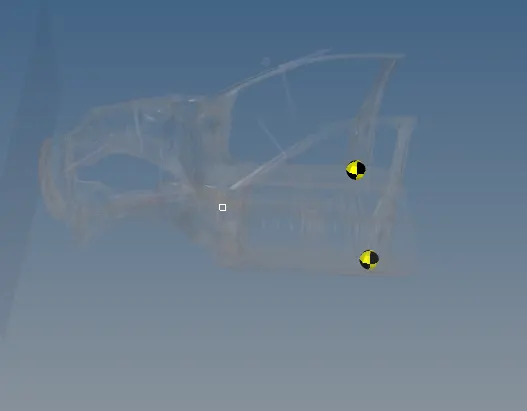
ACCELEROMETER
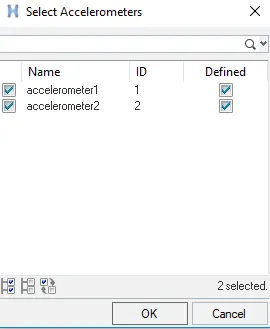
Define the accelerometers at the base of B-pillar and results checked in the output block.

Intrusions
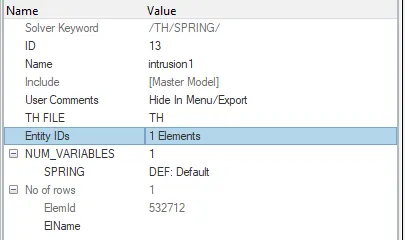
intrusion on the dash wall 66695,66244.
Mesh>create>1d elements>spring at 66695 ,66244.
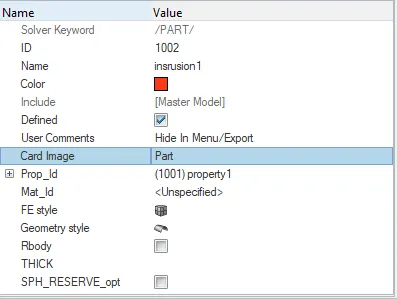
Create a seperate property and set the card image for the spring element component and make the changes on the parameters of mass and stiffness.
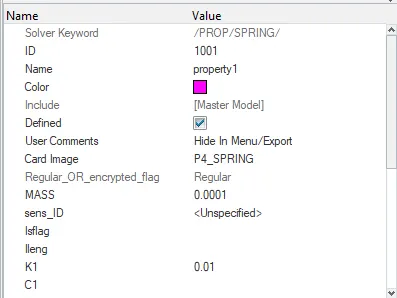
The property id should be set in the particular component.
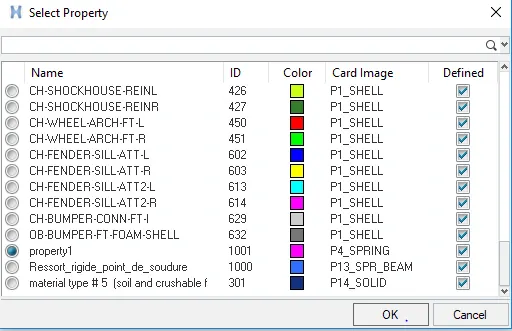
Creating the output block for instrusions.

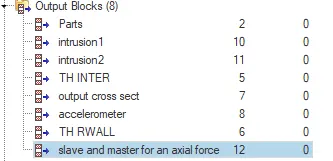
CREATED ALL OUTPUT BLOCKS
After setting all of the required parameters we have to run the model for Result outputs from them.
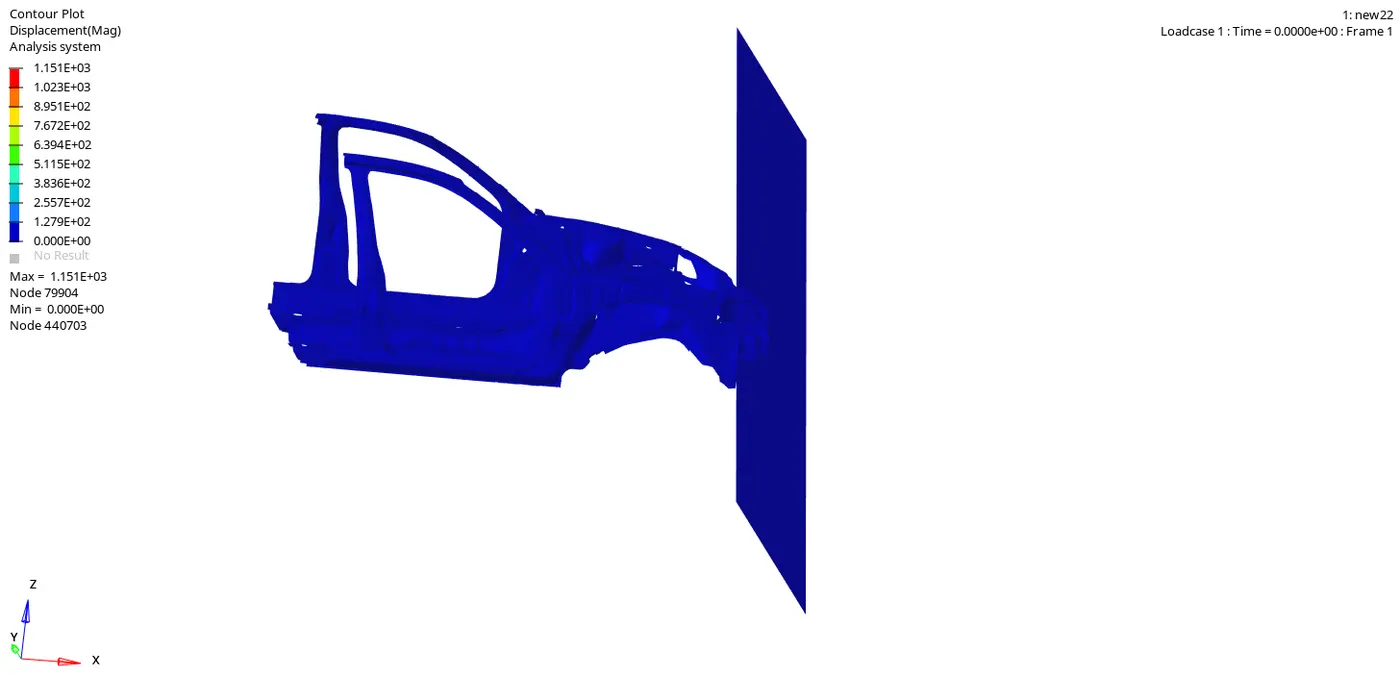
The maximum displacement of the car is 1151mm.
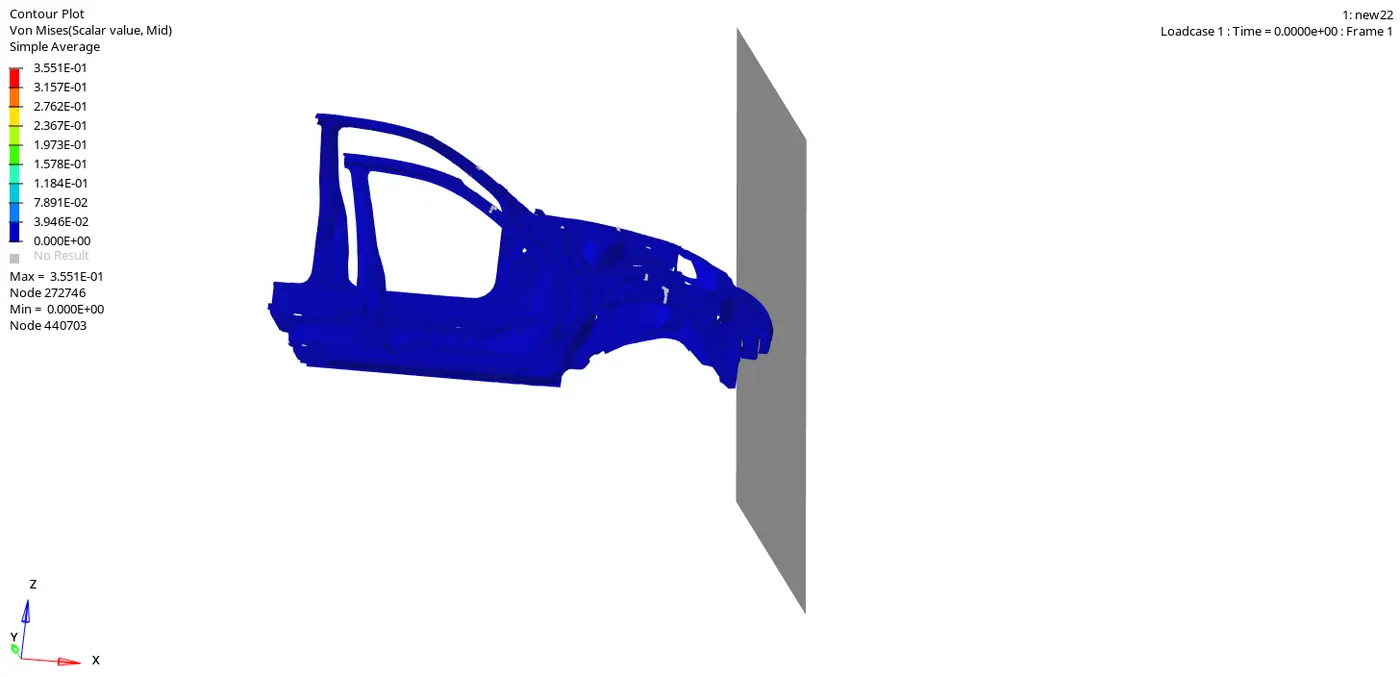
The maximum stresses recorded at 0.35GPA
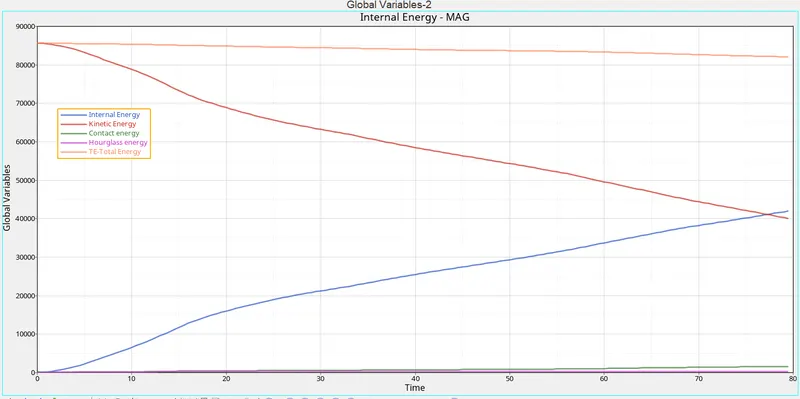
ENERGY PLOTS;
Initially, the kinetic energy is started at peak point and after slowly thereby decreasing the energy, because the velocity will be decreasing comparing to the first start point.
Similarly, the internal energy was increasing their resistive power by absorbing the deformable energy, this absorbing capacity will increases the model is more safer.
The kinetic energy and internal energy is will meet at the 78seconds
The hourglass energy is almost constant at the entire model due to QEPH formulation.
Sectional force in the rails at the location of indicated node 174247.
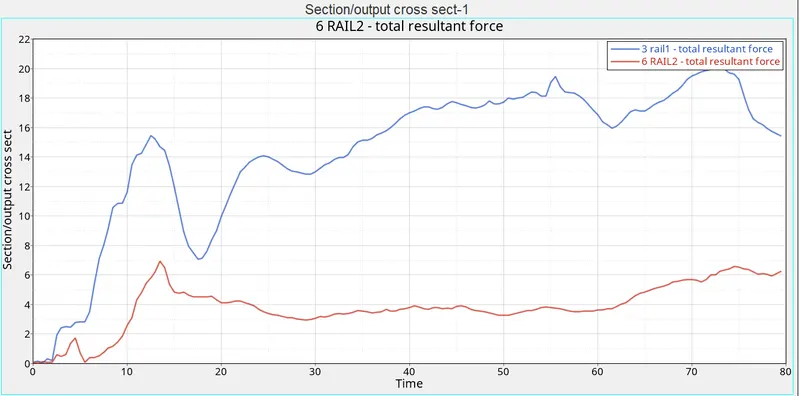
This above graph indicates the both sectional forces of the rails.
The forces acting on left side of the rail will be 20.08kN and time is the 75ms.
The forces acting upon the right of the rail is 7kN and the time is 14ms.
Here we can see the forces acting on the left rails are more high than the right rails.
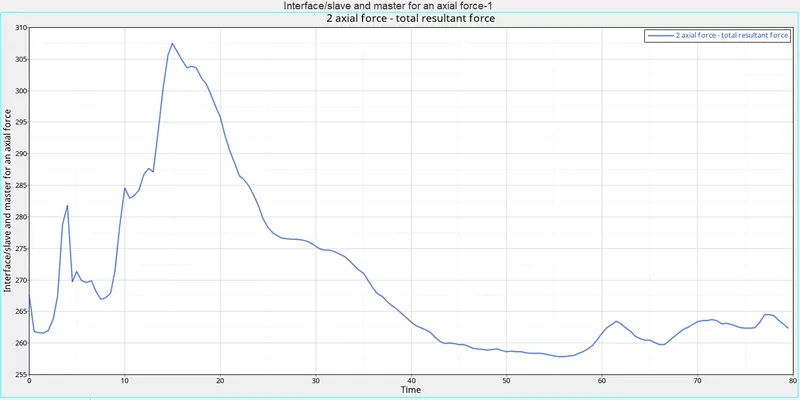
The axial force received on the rails from the bumper.
The below graph shows axial force received on the rails from the bumper .
When the car model hits the rigid wall , the opposing forces are received by the bumper and through rails it will transfer forces to the remaining parts of the model.
First the forces acting on the bumper will be high ,can be seen in the below graph and gradually it will distrubutes the forces to the redmaining parts of the model and becomes small at the end of the model.
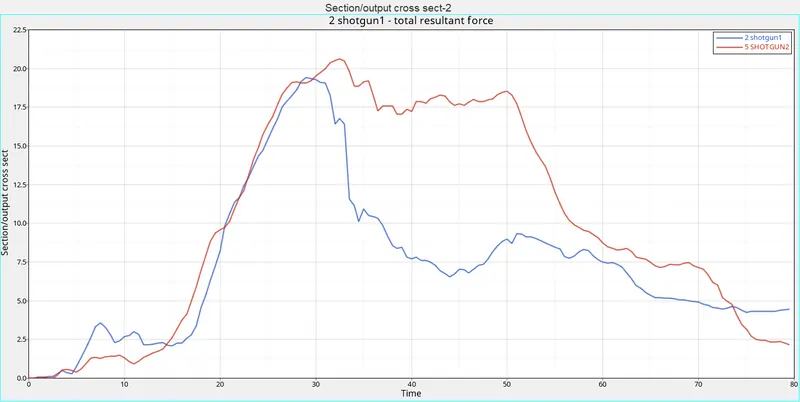
Shotgun cross-sectional forces.
The forces received after bumper and rails the next most effective destrustion will be done in an shotguns of the vehicle body.
sectional forces on the both shotguns are shown in the below curve.
The shotgun at the left side received 18kn forces in the 29ms of the time.
The shotgun at the right side received 22kn forces in the 32ms of the time.
we can absorb that the forces received from the right side is more high compare to the left side shotguns.
The shotgun forces are fluctating at high at certain 19kn at the time of 50ms, and slowly decreases at the end.
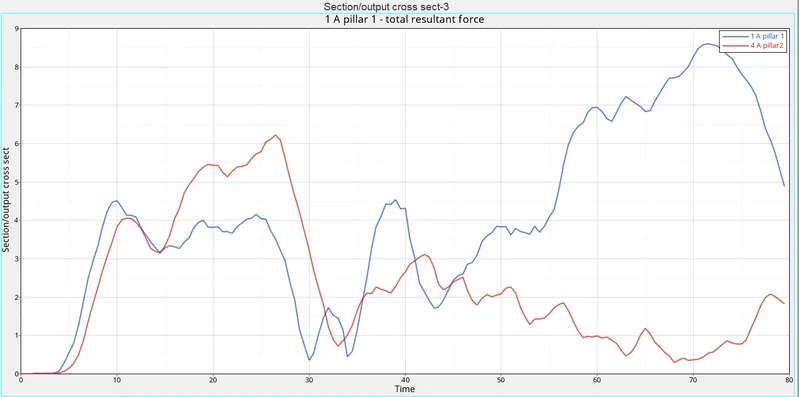
A pillar cross-section.
The graph indicates the forces acting on the both cross sections of the left and right side of the A pillar are mentioned in the below.
The forces on the left side of the Apillar indicates 8.5kn at 72 ms, it will receives the more energy compared to the right side of the pillar.
Sectional forces on the right side of the A pillar is 6.1kN at the 28ms has less impacted forces.
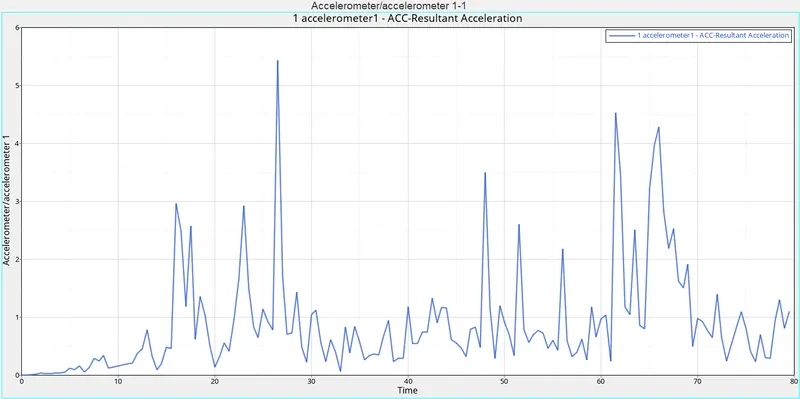
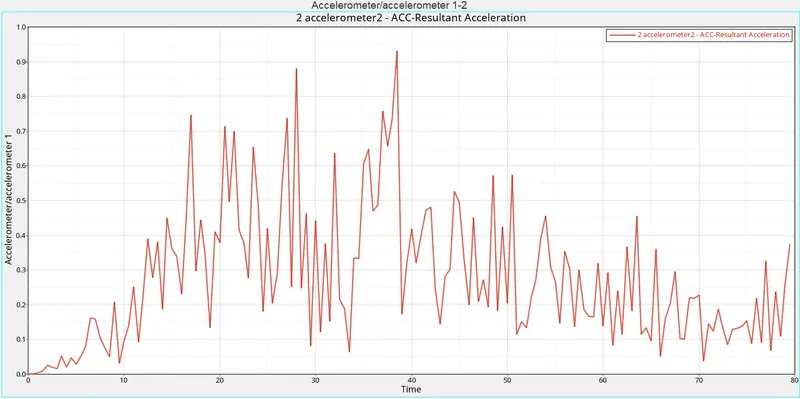
Acceleration curve received on the accelerometer at base of B pillar (on B pillar rocker).
These devices measure the acceleration in a particular direction. This data can be used to determine the probability of injury. Acceleration is the rate at which speed changes. For example, if you bang your head into a brick wall, the speed of your head changes very quickly (which can hurt!). But, if you bang your head into a pillow, the speed of your head changes more slowly as the pillow crushes (and it doesn't hurt!
The acceleration sensors are set at the B pillar curves indicates the change of speed at which the body wil receats during the crash happens.
Intrusions on the dash wall 66695,66244.
Intrusion points at the brakes and aceelerations are connected with the springs and added some mass and stiffness to the 1D spring elements.
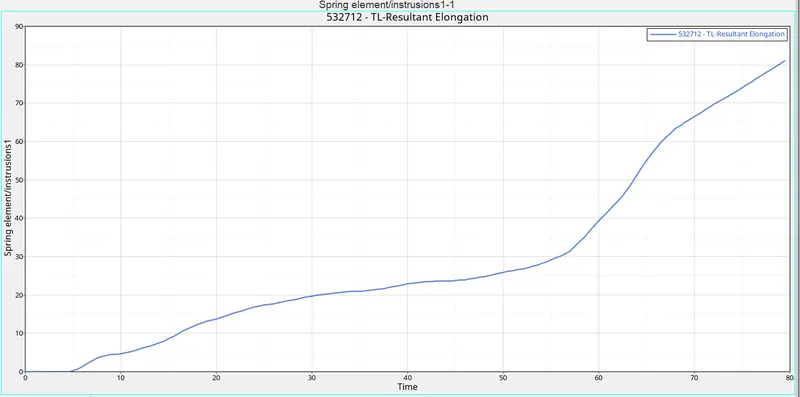
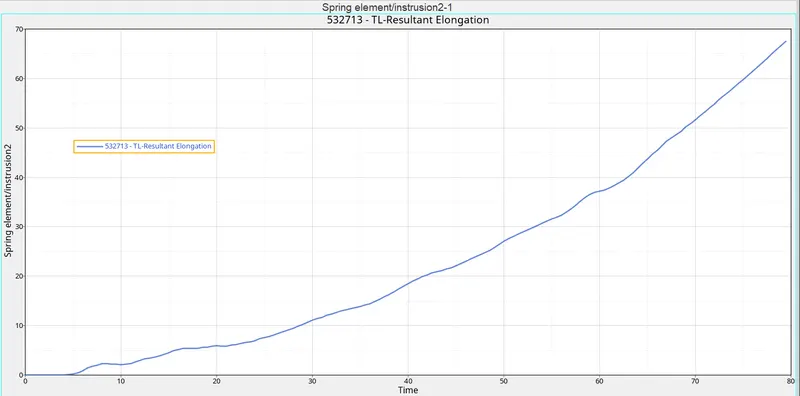
There are two graphs shown in the below figres, first indicates the Intrusion points and second one at the aceelerations node.
The intrusion points are displaces high at the 82mm in the 80ms of the time.
The aceelerations points are displaces high at the 62mm in the 80ms of the time.
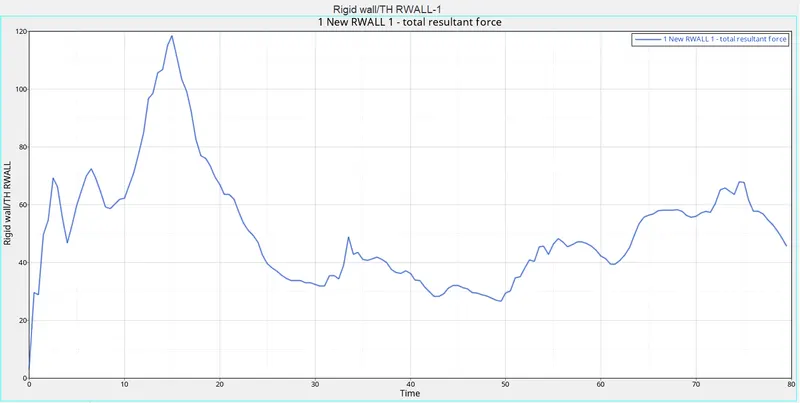
RIGID WALL FORCES
MASS AND ENERGY ERROS;

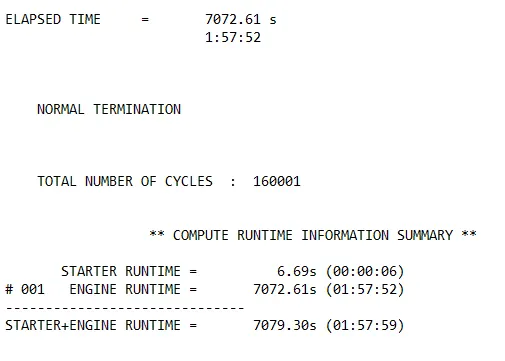
The energy error of the frontal crash simulation shows the -2.0% and mass error are 0.1265E-02.
Number of cycles:160001
Time:7072.61sec(1hr57min52sec).
CONCLUSION;
RAILS
The forces acting on left side of the rail will be 20.08kN and time is the 75ms.
The forces acting upon the right of the rail is 7kN and the time is 14ms.
SHOTGUN
The shotgun at the left side received 18kn forces in the 29ms of the time.
The shotgun at the right side received 22kn forces in the 32ms of the time.
APILLAR
The forces on the left side of the Apillar indicates 8.5kn at 72 ms, it will receives the more energy compared to the right side of the pillar.
Sectional forces on the right side of the A pillar is 6.1kN at the 28ms has less impacted forces.
Now we can state that, the sectional forces right from bumper to A pillar are gradullay decreasing because of the the forces were distrubiting along the cross sections of the components. More absorbing of the forces from the components results for the safesty of an occupant inside the vehicle.
perform all the crash analyses simulations for an out put results.
Analyses these output graphs and get out results from these parameters.
GOOGLE DRIVE LINK:
https://drive.google.com/drive/folders/1cBYwxvJB58_EcibBxjT__gEEgjrvLroj?usp=sharing