Frontal Crash Analysis Using Radioss
AIM:
Frontal crash analysis of a reduced neon car model
OBJECTIVE:
- Check unit system and either follow[Mg mm s] or [Kg mm ms].
- Create appropriate interface ,friction 0.2 and recommended parameters.
- Make sure of no penetrations and intersection.
- Correct rigid bodies if any issues.
- Create rigid wall with friction 0.1.
- Compare the model weight with the full scale 300k nodes model and use added masses to reach target weight 700kg while getting CG about the required range.
- Initial velocity 35 mph.
- Use model checker to ensure good quality.
- Time-step :0.5 to 0.1 microseconds.
- Run 80 ms.
Output requests:
- Sectional force in the rails at location of indicated node 174247.
- Axial force received on the rails from bumper.
- Shotgun cross sectional forces.
- A pillar cross section.
- Acceleration curve received on the accelerometer at base of B pillar (on B pillar rocker).
- Intrusions on the dash wall 66695,66244.
INTRODUCTION
In this project, I have set up the case for frontal crash analysis for a reduced neon car model. Here, I imported the model, then did the initial penetration checks. Then have to add mass to the model so that the CG point is at the desired location and create proper contacts for the model. After that, created a rigid wall for the model and assigned proper boundary conditions for the model. To acquire certain results, cross-sections are created on some of the BiW components, accelerometer sensors are mounted in the base of the B-pillar, and to calculate intrusions - the springs are created between the requested nodes. To obtain all the results output blocks are created for the said conditions and the engine cards are manipulated to our requirements. The output is visualized using Hyperview and plotted using Hyperview.
THEORY:
Crashworthiness is the ability of a structure to protect its occupants during an impact. This is commonly tested during the safety of aircrafts or vehicles. Depending on the nature of impact and the vehicle involved different criteria’s are followed.Crashworthiness can be assessed either by using computer softwares such as Radioss,LS-Dyna,,or through experiments. Several criteria are used to asses crashworthiness prospectively including the deformation pattern of the vehicle structure , the acceleration experienced by the vehicle , the force transfer to various links of BIW etc.Injury criteria is defined using various mechanical parameters like force, acceleration or deformation.
The full frontal fixed barrier crash test represents a vehicle to vehicle full engagement with each part moving with the same velocity. A schematic of the test is shown below.This test is intended to represent most real time crashes which includes both vehicle - vehicle and vehicle- fixed object with a significant frontal engagement in a perpendicular impact direction

Fedral Motor Vehicle Safety Standarads(FMVSS) 208
Federal Motor Vehicle Safety Standard 208 (FMVSS 208) regulates automotive occupant crash protection in the United States. Like all other Federal Motor Vehicle Safety Standards, FMVSS 208 is administered by the United States Department of Transportation's National Highway Traffic Safety Administration.
This standard originally specified the type of occupant restraints (i.e., seat belts) required. It was amended to specify performance requirements for anthropomorphic test dummies seated in the front outboard seats of passenger cars and of certain multi-purpose passenger vehicles, trucks, and buses, including the active and passive restraint systems. The purpose of the standard is to reduce the number of fatalities and the number and severity of injuries to occupants involved in frontal crashes
WORKFLOW

PROCEDURE
I SOLVERDECK SETUP
1. Import the .rad file Kg mm ms KN is taken as the unit system for the file.The file contains the reduced model of a neon car due to node limitation in the students edition. 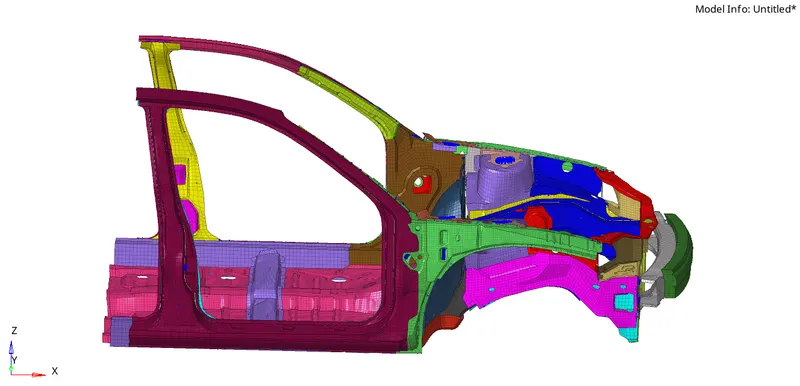 Reduced Neon Car model
2. Now we have to check the unit system and ensure a consistent unit system is followed 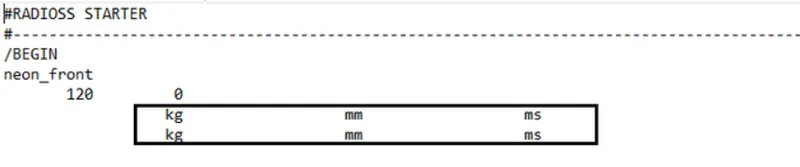 Starter file
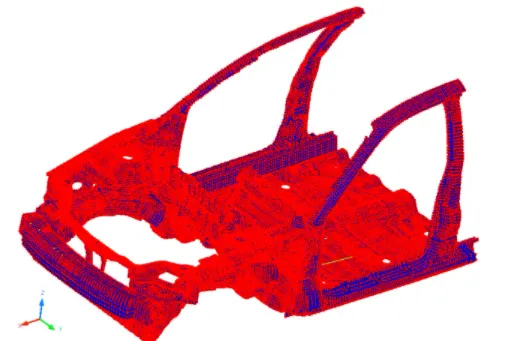
3. We can also open the file in hypercrash and set the interface. Hypercrash too is a similar pre-processor like hypermesh but has a rather more friendly user interface.The deck already has some interfaces defined. We can delete these interfaces and set a single type 7 interface. We have to define the time history for the defined contacts to view the results in the output. Type 7 interface is a general type interface that can simulate impact between nodes and master surface
IMPORTANT INTERFACE PARAMETERS
lgap:-Determines how the size of the gap is calculated
Gap_min-Minimum Gap for activation
Inacti:- Action to take if initial penetration exists
lstf:-Action how the stiffness is calculated
St_min:-Minimum stifnnes used in the iterface
ldel:-What to do if elements and master segment fails
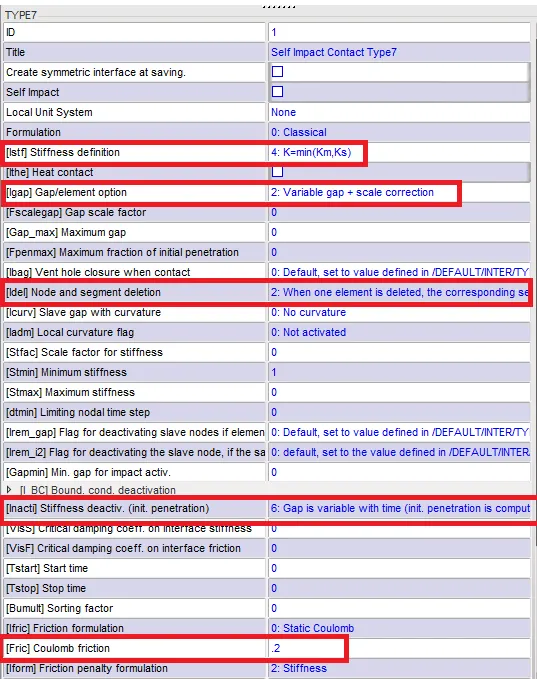
 Interface:Type 7 defined for the whole model with recommended parameters
4. We can export the file back into hypermesh. We check the model for any penetrations.Now we need to apply an initial velocity of 35mph or 15.64ms
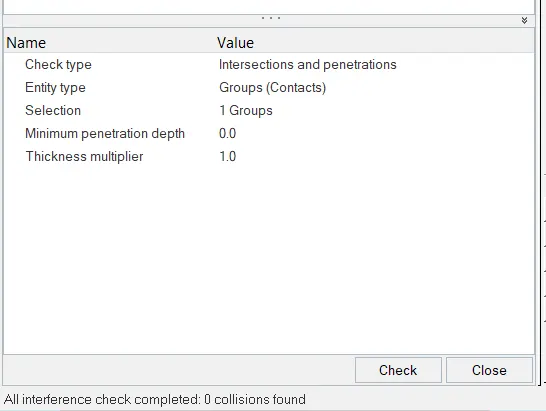
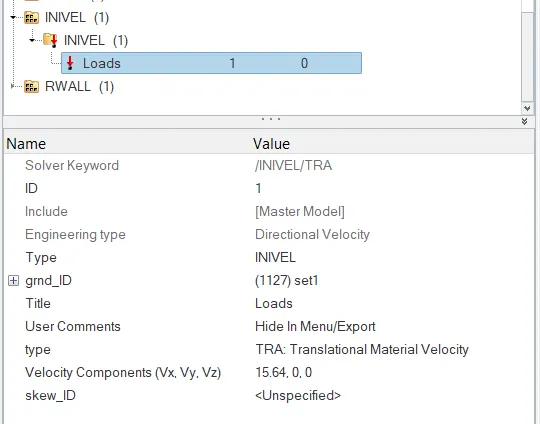
Penetration checker Initial Velocity Definition
5. A rigid wall with a friction coefficient of 0.1 was created perpendicular to the global X direction. Rigid wall can be defined using Model-->Create-->Rigid Wall
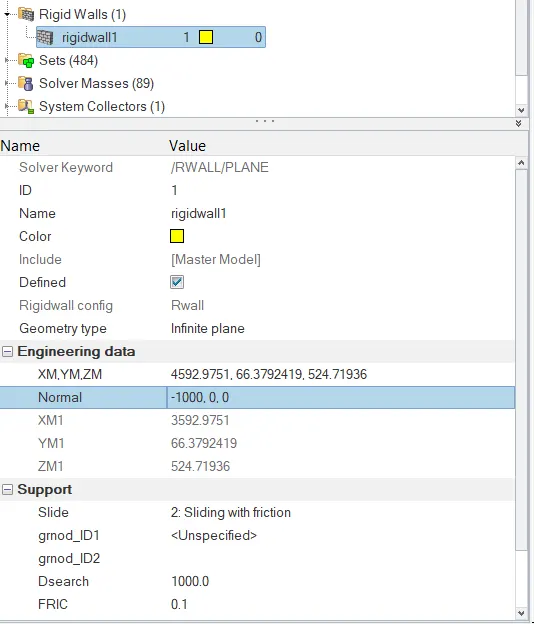
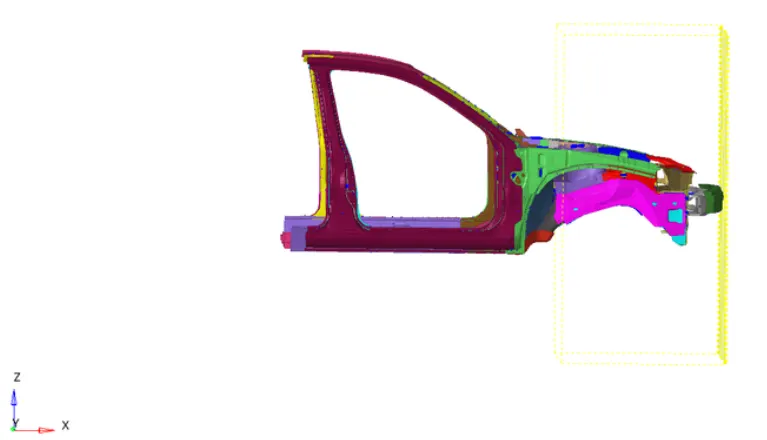
Rigid wall definition Rigid Wall defined
6. As we are only dealing with the frontal part of the BIW total mass of the structure is less compared to the original model.Mass plays a crucial role in the analysis.Hence additional masses were added to the model to bring the COG to a respectable position.To move the COG point increase the mass value. It can be added through Load case-->Added Mass. Here we select Type 1 and add mas and bring the COG to the centre within the mass limit
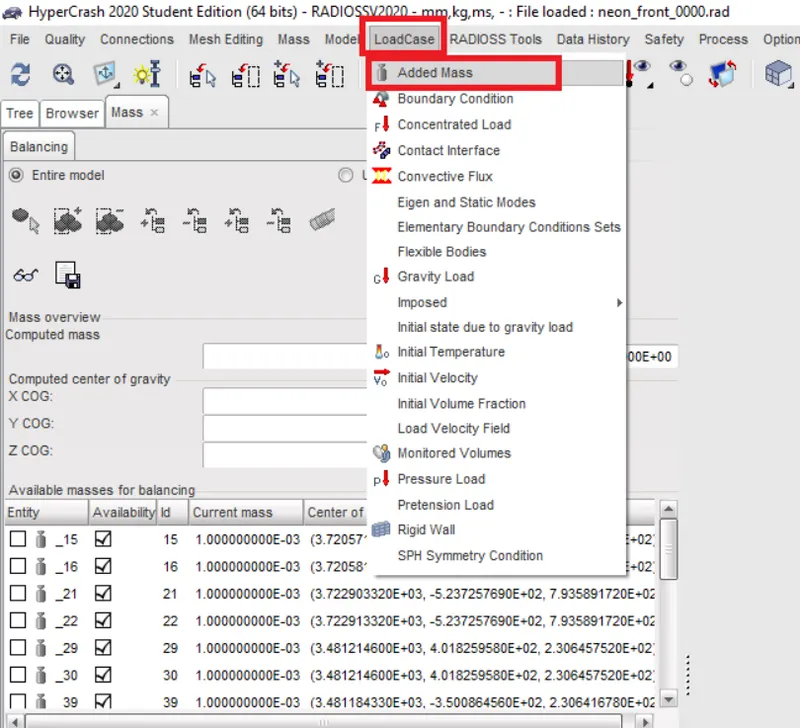
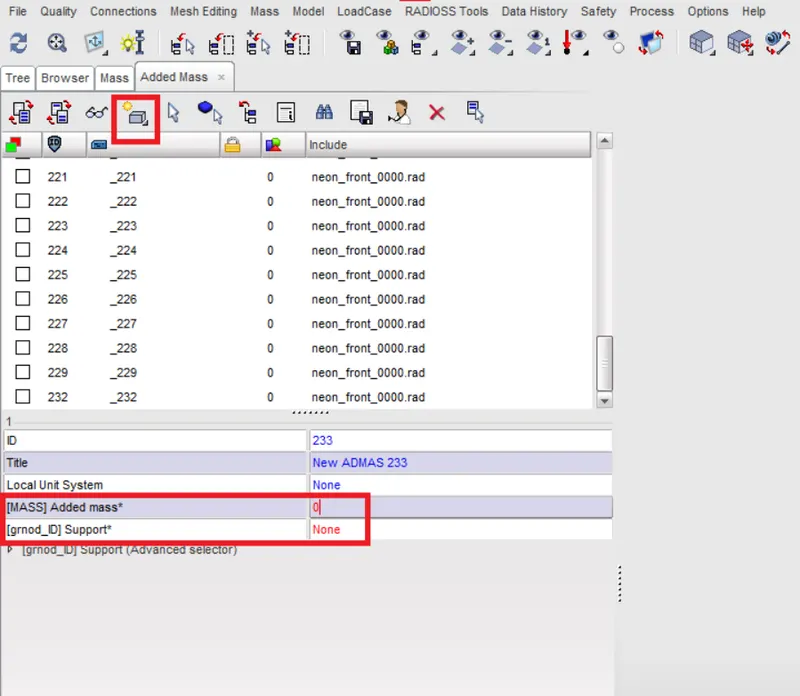
Added Mass GUI Mass Definition in Kg
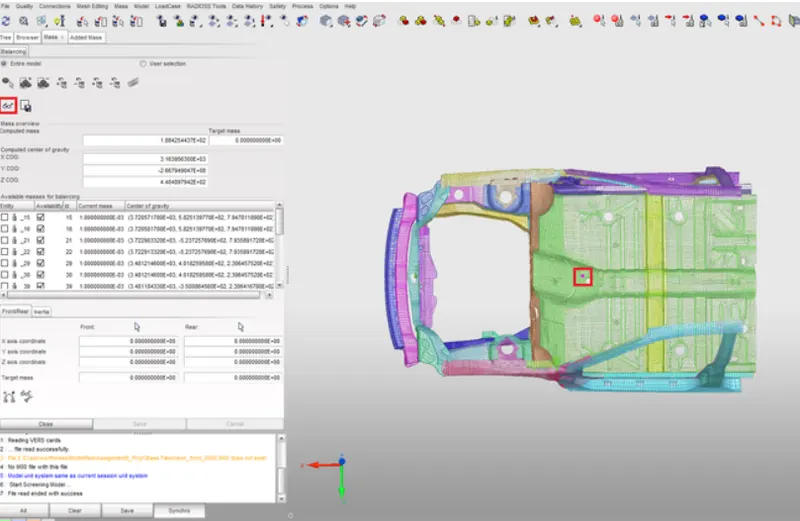
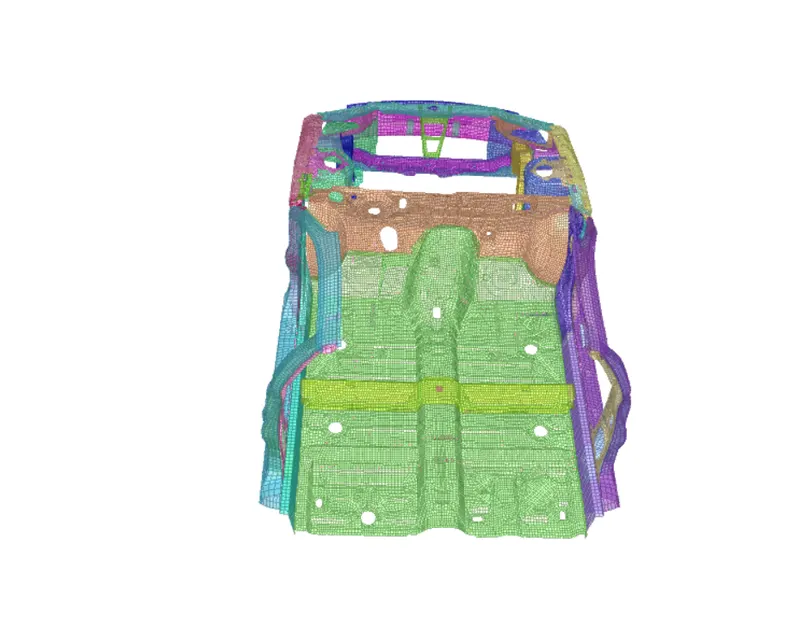
Initial COG point COG point set to the middle
7. Accelerometers were created on rockers on the near part of the B-pillar. To define accelerometers goto Solver-->ACCEL-->Define the nodes of the respective B-pillar
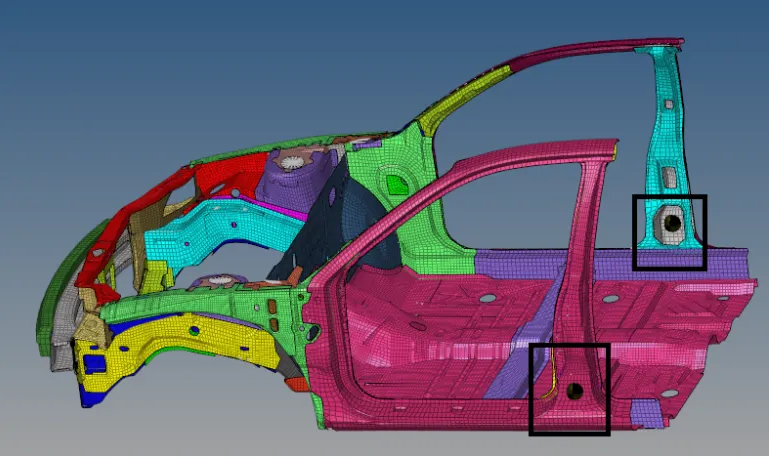
Accelerometers defined on the B-pillars
8. To mention the time step to a value between 0.5 to 0.1 microsecond we goto ENGINE KEYWORDS-->DT-->DT/NODA
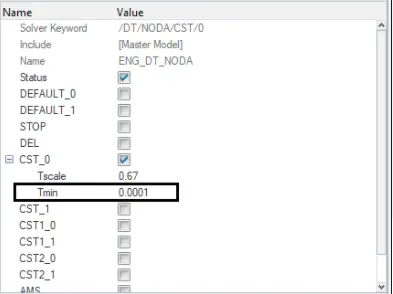
DT/NODA card definition
9. The run time was set to 80ms editing the RUN option under the engine tab
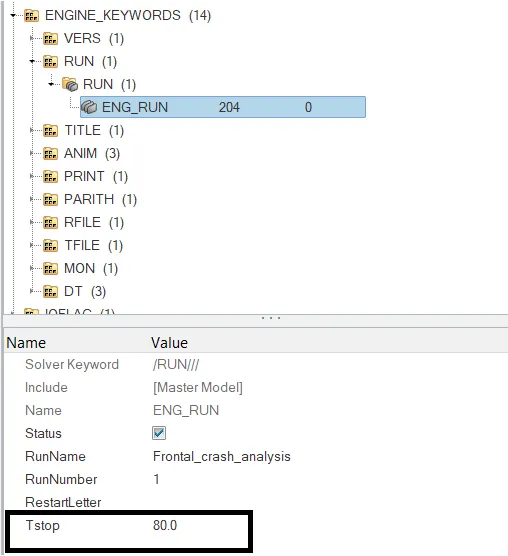
Engine runtime definition
II. OUTPUT REQUESTS
1. To create the Rail sectional forces we create a local frame at that section Solver-->Create-->Frame-->MOV
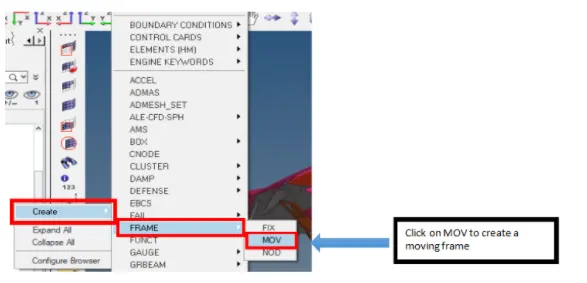
2. Now we have to create the section via Create-->SKEW-->MOV
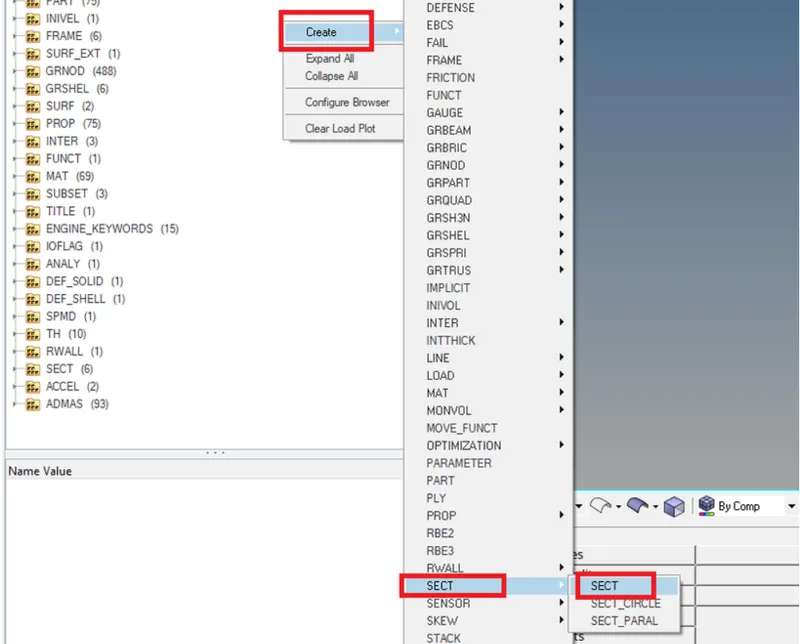
3. We define the section on the corresponding node and select its corresponding frame id and set the respective output block for it
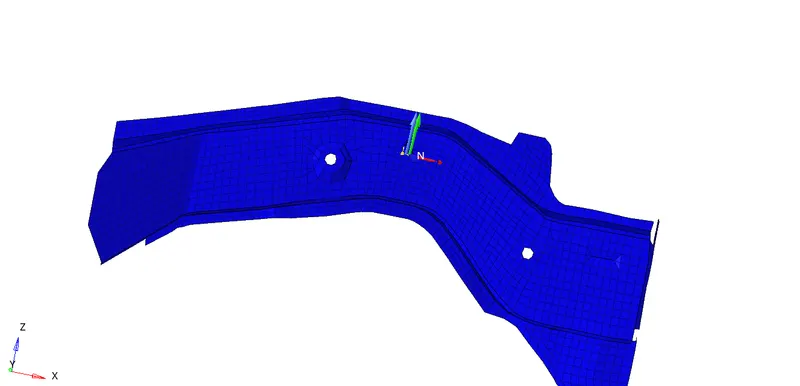
Sectional Forces on rails node 174247
4. For creating sections on A pillar goto Solver-->Create-->Frame-->MOV.Then we create the section for it using create-->Sect-->Sect and select nodes N1,N2,N3 and define its frame_Id as the corresponding frame defined for it
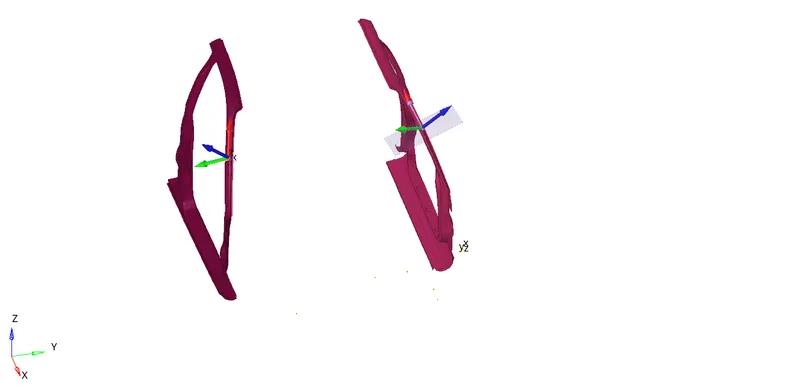
A pillar sections defined
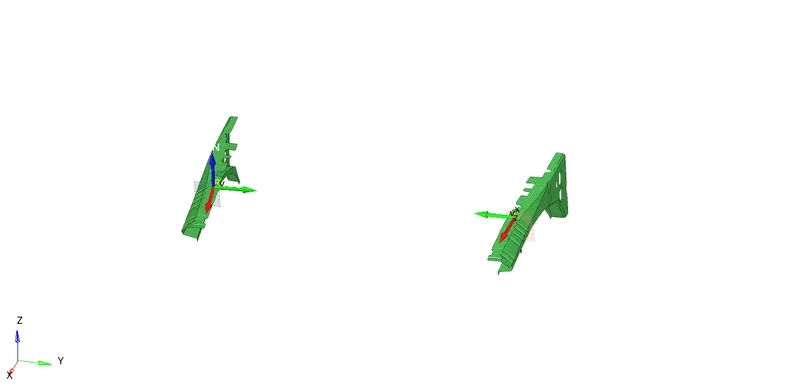
5. Similarly for other sections such as short gun sections were created and respective output blocks were assigned.
6. To measure intrusions springs are set.Then they are assigned respective properties we give a very low stiffness so we can measure the intrusions on the nodes.One end of the spring swill be on the nodes where intrusions are to be measured and the other end will be on a node that is free from any deformation during the crash

1D-->Springs

Springs definition
7. Intersections and penetration checks were carried out. None was detected
8. Now for the results request we goto Time history menu and create the required TH requests. Make sure to include accelerometers, intrusion springs,Rwall, the Interfaces and the sections
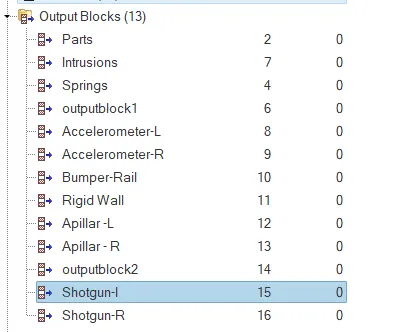
Output blocks definition
III. Model Checker
1. Now that we have setup the solver deck we need to check the model for any error
2. The connectivity of the model was checked to see if there was any free parts
3. We check the model in hypercrash as its detects the errors more carefully than hypermesh.The model checker came up with errors.Some free joints,nodes were detected those were deleted
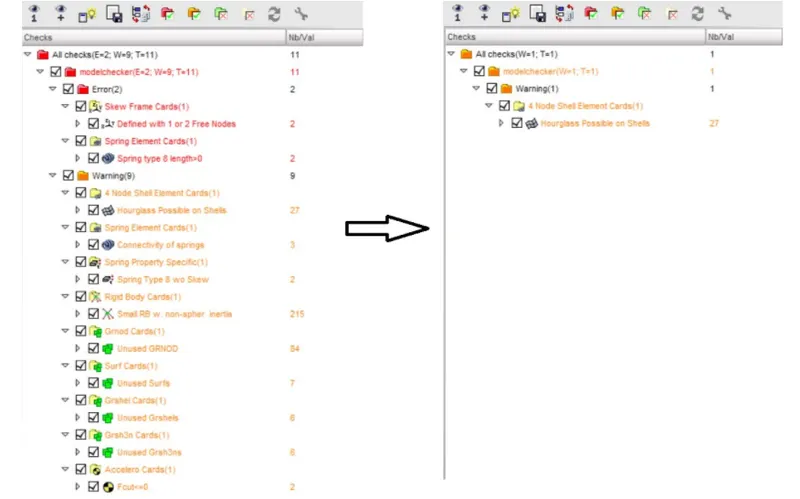
Model checker in hypercrash
4. Then a run was run with all errors removed
5. Now we have to run the analysis using Analysis-->Radioss-->Options-->-nt 4-->Radioss.The run is completed. After successful completion of the run open the radioss engine out file and check for errors. Mass error should lie within (1-3%)and energy error should lie within (5 to -15%).We find that errors are well within the range. Hence here the results are acceptable. As the error is negative, it means that some energy has been dissipated.Now we move forward for post-processing of the results
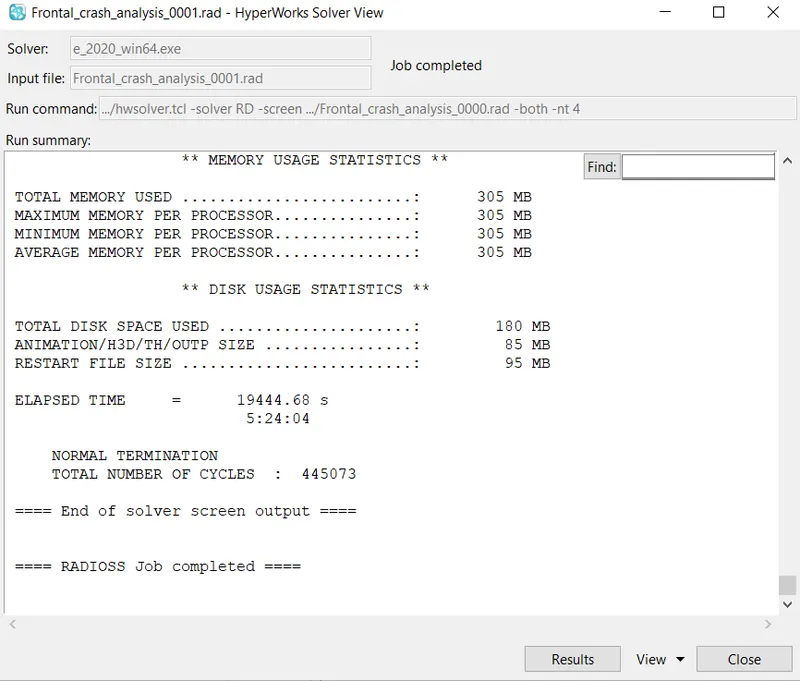
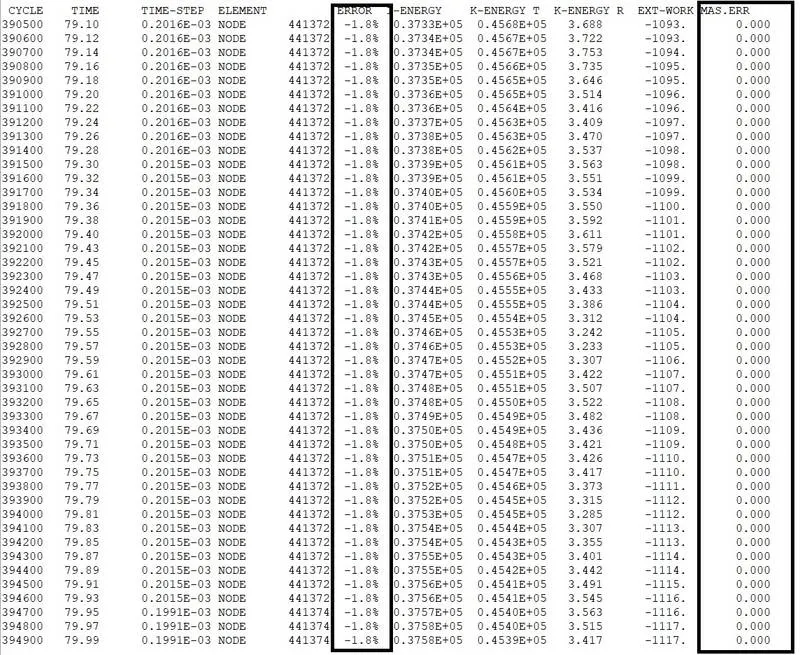
Engine file output
RESULTS
Now we can post-process our results using Hyperview and hypergraph. Hyperview helps to get useful animation contours and hypergraph helps to plot the required data
The simulation was run successfully. Here the mass error and energy errors are within acceptable ranges hence we procced further.In the crash animation, we can see the front of the car to rise, it maybe due to the mass addition we did.
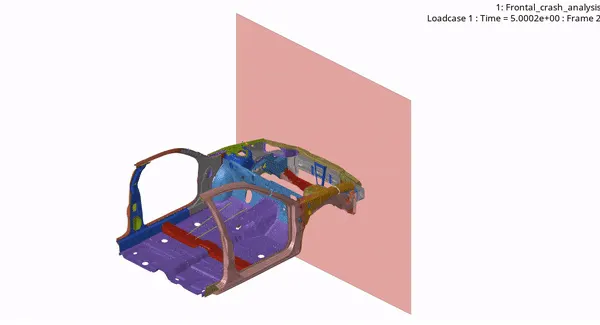
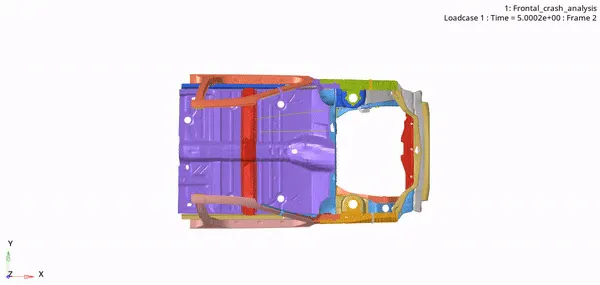
Crash animations in various orientations
Von mises stress
Von mises stress is very important in understanding the stresses that are acting upon BIW fixtures when car crash occurs. It is important for stress to flow from one component so that stresses can be absorbed by different car components so as to ensure maximum safety for passengers. The maximum von mises stress observed is 0.3657 GPa
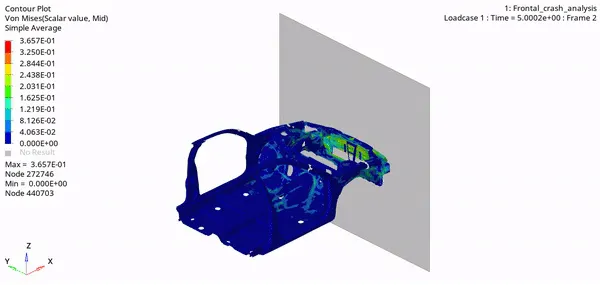
Von mises stress contour
Energy Plots: The plot shos a decrease in Kinetic energy and an increase in Internal Energy after occurrence of impact.The total energy has been same throughout. The choice of proper element formulation has helped to keep hourglass energy to a very negligible value. The contact energy can be seen increasing across the run with an increase in deformation thus resulting in increase in contact
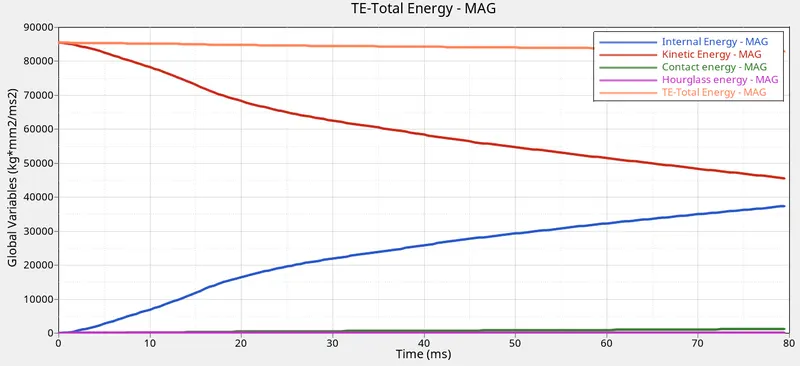
Time vs IE_KE_CE_HE_TE
Ideally, it is recommended that
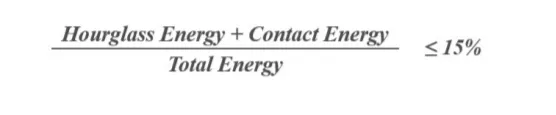
`[(224.3+1254.9)/82995.6] * 100= 1.78%`.Therefore our results are well within the limit
The acceleration measured by the accelerometer: The plot shows the acceleration measured by accelerometers placed at the rocker arms at the bottom of B-pillars. Accelerations become non zero after the impact.The accelerometer on left side that is represented by blue curve has recorded more variation and peaks which has a max value of 3.48 whereas right sided recorded a max of 1.16
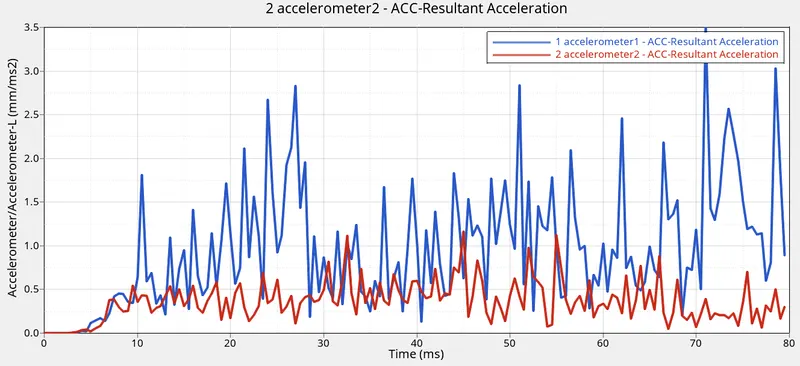
Acceleration vs Time plots
Rigid wall forces: The rigid wall experienced a maximum force of 130.388 at 15.5 ms. We can observe some initial force on the rigid wall due to some part of the car bumper already is in contact with the wall before crash analysis. A peak is observed at 1.5 s which is when the car impats the wall. Every time a component deforms the resultant forces on the walls can be seen decreasing
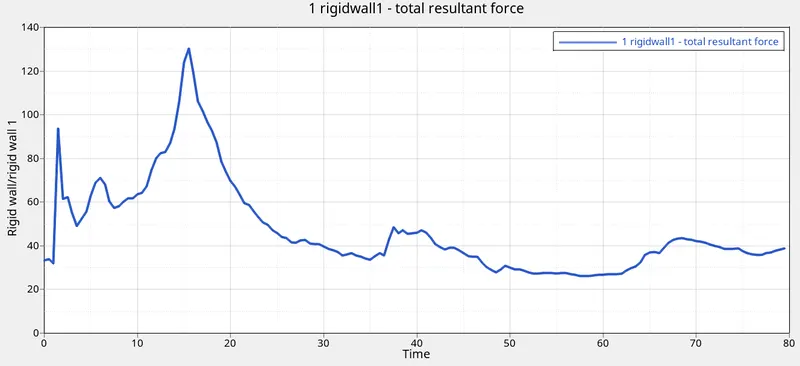
Rigid Wall Forces
Axial forces on bumper rails: Here we have plotted the normal and resulted forces on the bumper rail contact.The forces are high at the beginning and decreases as time progresses.In the end forces aree seen to rise again this maybe due to self impact
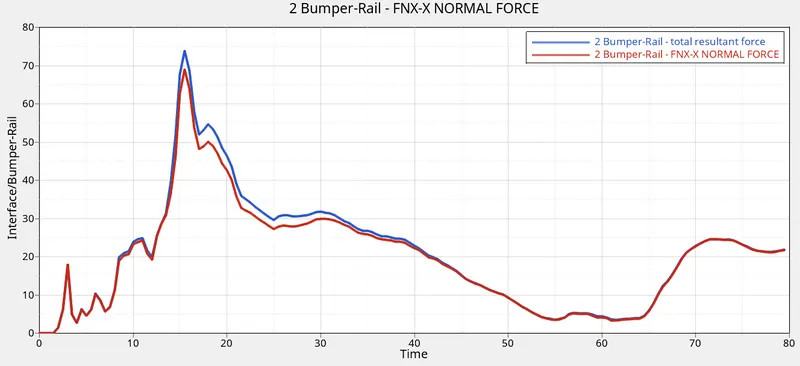
Bumper rail Forces
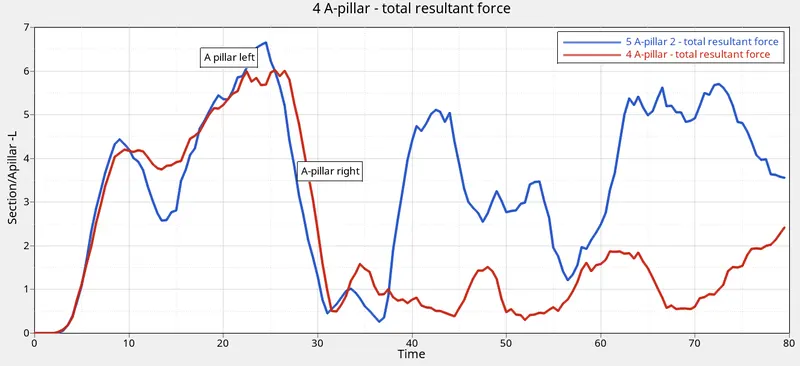
Sectional Forces on A-pillar: The forces are high on the left side of the A-pillar.The peaks recorded were 6.65 and 5.99 on the left and right side respectively. Apillar receives only around 20% of the toatl force transfer and remaining is transferred to the floor panel due to which sectional forces on them are low compared to others
Acceleration vs time plots
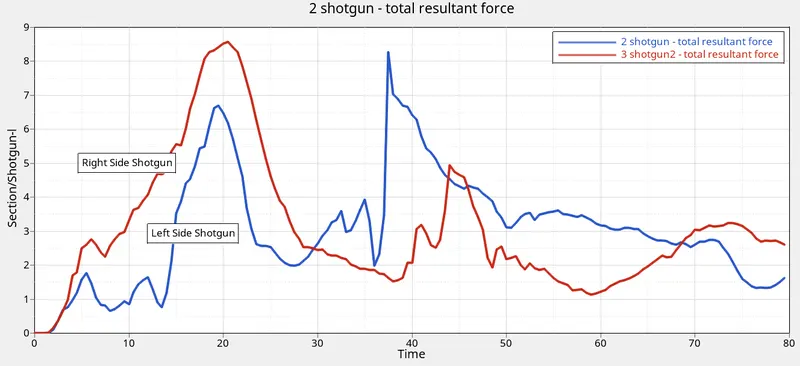
Sectional Forces on Shotgun: The force begins to rise after some time after T=0.The peaks observed were 8.58 ad 8.28 respectively. Shotguns are generally made of advanced high strength materials which have high toughness too. So that shortgun absorbs a large amount of force and deforms hence lessforce would be transferred to occupant
Sectional forces on shotgun
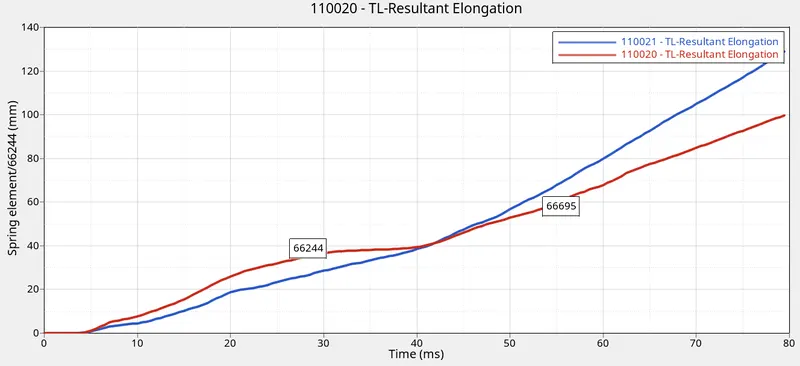
Here the intrusions are found to be 129.9 and 99.63 respectively for 66244 and 66695 nodes. Here we see a pretty big value of displacement on these nodes due to the absence of some engine components in our model
Intrusion on nodes
CONCLUSION:
- The solver deck was set up as the instructions
- The simulation was run successfully with an acceptable range of errors
- The left side of the BIW has more deformation compared to the right side
- All sectional forces were recorded and maximum force was observed on the rails
- Intrusions on the dash wall 66695,66244 were measured
All the simulation files can be found here