Assignment 6
CAR FRONTAL CRASH TEST USING HYPERMESH
Aim :
Car frontal crash analysis and deck setup using hypermesh and hypercrash.
Objective:
To perform frontal crash of the given car model with the given conditions and study the BIW model after crash.
- Check unit system and either follow[Mg mm s] or [Kg mm ms].
- Create appropriate interface ,friction 0.2 and recommended parameters.
- Make sure of no penetrations and intersection.
- Correct rigid bodies if any issues.
- Create rigid wall with friction 0.1.
- Compare the model weight with the full scale 300k nodes model and use added masses to reach target weight 700kg while getting CG about the required range.
- Initial velocity 35 mph.
- Use model checker to ensure good quality.
- Time-step :0.5 to 0.1 microseconds.
- Run 80 ms
Introduction:
Crash Test:
A crash test is a form of destructive testing usually performed in order to ensure safe design standards in crashworthiness and crash compatibility for various modes of transportation ( automobile safety) or related systems and components.
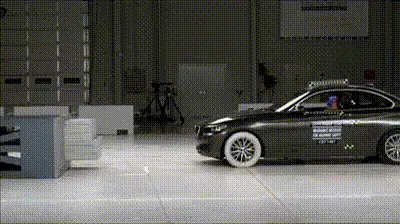
The term ‘structural crashworthiness’ is used to describe the impact performance of a structure when it collides with another object. A study into the structural crashworthiness characteristics of a system is required in order to calculate the forces during a collision which are needed to assess the damage to structures and the survivability of passengers in vehicles, for example. This topic embraces the collision protection of aircraft, buses, cars, trains, ships and offshore platforms, etc and even spacecraft .
Vehicle crashworthiness is an important design attribute which designers strive to improve. However, design for structural crashworthiness is a difficult task. A vehicle structure must have strength to shield the passenger compartment, as well as compliance to cushion the impact energy. The best known analysis method for crashworthiness performance prediction is nonlinear finite element (FE). FE analysis of detailed vehicle models requires enormous computational resources thereby hindering the success of general-purpose optimization approaches. An approach which is more of an art than a formal procedure is that of crash mode matching. Qualitatively, the crash mode is the observed gross-motion of the structure and its time history of deformation in various zones. Crash mode matching involves adjusting the design variables of the structure in order to achieve a desirable structural deformation history, which an experienced designer can typically do while requiring only a few trial FE runs. This dissertation to develops an algorithmic methodology by formalizing this crash mode matching approach. A quantitative representation of the crash mode is introduced as a matrix of time series of the structural deformation history, with dimensions of the matrix being the structural location and type of deformation. A comparison metric is then introduced for the degree of matching between crash modes as the integral of the error between the time series. An automated algorithm for crash mode matching heuristically directs stochastic sampling of the design space by adjusting the mean and standard deviation of normal distributions on the design variables. Adjustment of the mean and standard deviation is performed via Fuzzy logic rules that are defined by the algorithm user in analogy to the type of decisions that an experienced designer would make. Stochastic search allows for global convergence properties, as well as accounting for different expert designers sometimes having different opinions on how to modify a design. Implementation of the proposed framework is applied to two real-life case studies involving front half of a vehicle, as well as full vehicle models. The studies show success in attaining high performance designs, while requiring a modest number of FE runs, hence reasonable computational resources.
Types of Crash Test :
- Frontal-impact tests: which is what most people initially think of when asked about a crash test. Vehicles usually impact a solid concrete wall at a specified speed, but these can also be vehicle impacting vehicle tests. SUVs have been singled out in these tests for a while, due to the high ride-height that they often have.
- Moderate Overlap tests: in which only part of the front of the car impacts with a barrier (vehicle). These are important, as impact forces (approximately) remain the same as with a frontal impact test, but a smaller fraction of the car is required to absorb all of the force. These tests are often realized by cars turning into oncoming traffic. This type of testing is done by the U.S.A. Insurance Institute for Highway Safety (IIHS), EuroNCAP, Australasian New Car Assessment Program (ANCAP) and ASEAN NCAP.
- Small Overlap tests: this is where only a small portion of the car's structure strikes an object such as a pole or a tree, or if a car were to clip another car. This is the most demanding test because it loads the most force onto the structure of the car at any given speed. These are usually conducted at 15-20% of the front vehicle structure.
- Side-impact tests: these forms of accidents have a very significant likelihood of fatality, as cars do not have a significant crumple zone to absorb the impact forces before an occupant is injured.
- Pole-impact tests: A difficult test which places a large amount of force on a small proportion on the side of the vehicle.
- Roll-over tests: which tests a car's ability (specifically the pillars holding the roof) to support itself in a dynamic impact. More recently, dynamic rollover tests have been proposed in lieu of static crush testing.
- Roadside hardware crash tests: are used to ensure crash barriers and crash cushions will protect vehicle occupants from roadside hazards, and also to ensure that guard rails, sign posts, light poles and similar appurtenances do not pose an undue hazard to vehicle occupants.
- Old versus new: Often an old and big car against a small and new car, or two different generations of the same car model. These tests are performed to show the advancements in crash-worthiness.
- Computer model: Because of the cost of full-scale crash tests, engineers often run many simulated crash tests using computer models to refine their vehicle or barrier designs before conducting live tests.
- Sled testing: A cost-effective way of testing components such as airbags and seat belts is conducting sled crash testing. The two most common types of sled systems are reverse-firing sleds which are fired from a standstill, and decelerating sleds which are accelerated from a starting point and stopped in the crash area with a hydraulic ram. It can also be used to evaluate the whiplash protection of a vehicle's seat.
Body in white (BiW):
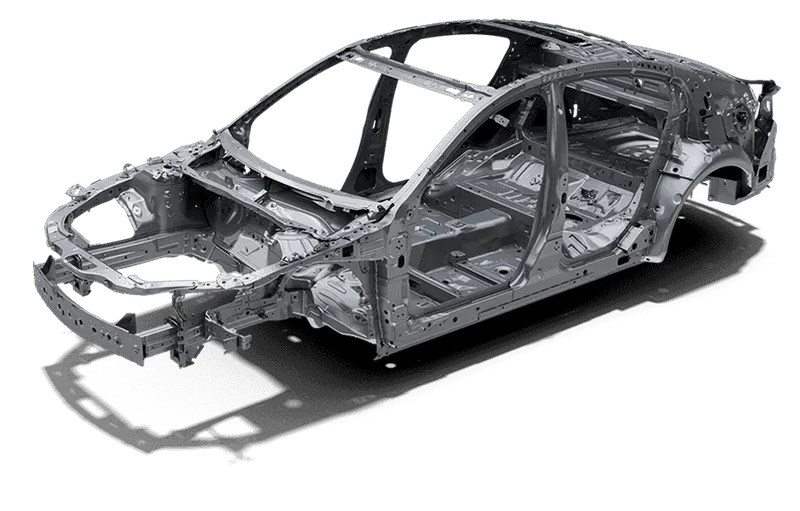
Body-in-white (BiW) is the name given to a car body’s sheet when all its components—barring moving parts (e.g., hoods, fenders, etc.), trims (e.g., glass, seats, etc.), or chassis subassemblies—have been welded together. Usually, BiW constitutes about 27% of a car’s curb weight , and remains the key determinant of how the car will perform. BiW can be made into two structures: the more common monocoque structure where all body members are carrying load with chassis in-built with BiW and are integrated with each other, and the body-on-frame structure where the frame is the main load-carrying member .
Procedure:
1. Import the file:
In the data we have two files
neon_front_0000.rad (starter input file): Which has all data required for the solver such as model information, elements, nodes, loads, boundary condition etc.
neon_front_0001.rad (engine input file): Which has all data required for the radioss engine i.e speed , time step, run time, what all data we want as output.
To import file,
- change user profile to radioss Because we are using solver as Radioss
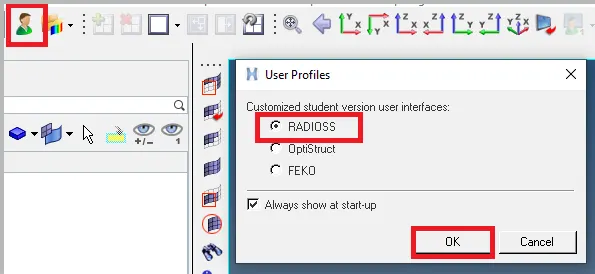
- File>Import>Solver deck we can see the new tab where options available for browse file. Browse the file FIRST_RUN_0000.rad
- Click on import so we can see imported file with required for the solver such as model information, elements, nodes, loads, boundary conation etc.
2. To Check the unit system followed
a. Click on Cards>BEGIN CARD from model browser.
b. Check the entity editor in which unit system is used in this model.
c. Here we use the units kg-mass, mm-length, ms-time.
3. Creating appropriate interfaces
a. We create a type 7 interface on the car body to study self intersection.
b. Right click on Groups in model browser> click on create.
c. In card image choose Type 7
d. Choose the slave nodes in Grnod_Id(S) and master
e. Give value of friction as 0.2
f. Then fill the parameters with recommended parameters.
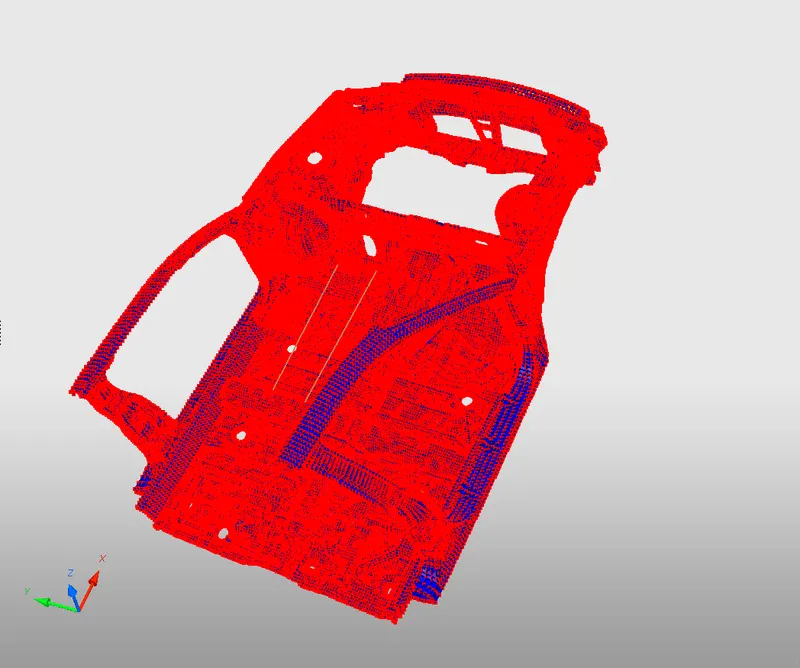
4. Check for penetrations and intersection :
a. Its is to check these in hypercrash so we can also open hypercrash.
b. Import the model in hypercrash.
c. Go to Quality > Check all solver contact interfaces
d. A quality tab appears and in that we can see that Intersection and penetration are zero.
5. COG and Mass balancing
- To see the COG point go to Mass > Balanceing .
- Click on the spectacle icon you can see the location of COG point now.
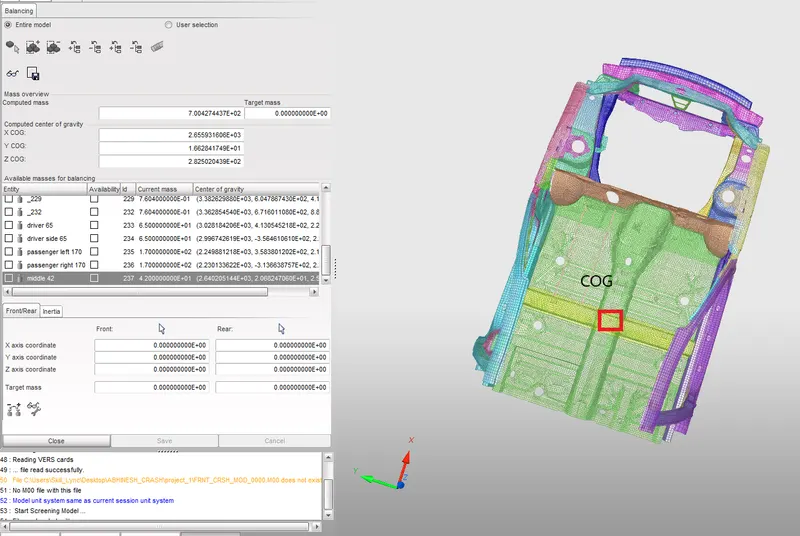
- If it is not at the center, we need to shift it to the center. Also the total mass should be 700kg. The masses should be divided to different areas so that it should never exceed 700kg.
- We can change the COG by adding Masses.
- For adding mass go to LoadCases > Added Mass.
- Right click on the Added mass area> Create New> Select Type 1- Mass is distributed to each of node group.
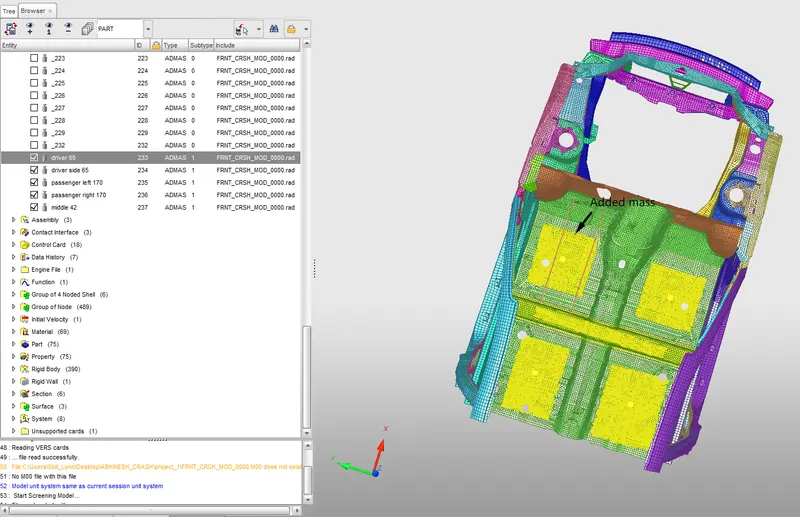
- In title give a name.
- In Added Mass give the mass to add.
- In grnod_ID , pick the nodes to which the mass should be distributed.
- Click on Save.
- Like that add masses at different places of the car body and position the COG at center.
6. Give an Initial Velocity of 35mph (15.6464 m/s)
- In browser tab Right Click > Creat New > I-L > Initial velocity.
- In the INVEL tab edit the values .
- Type is translational because there is no rotation motion.
- Only X velocity is given because there is only movement in the X direction.
- In Grnod_id select the whole nodes of the car.
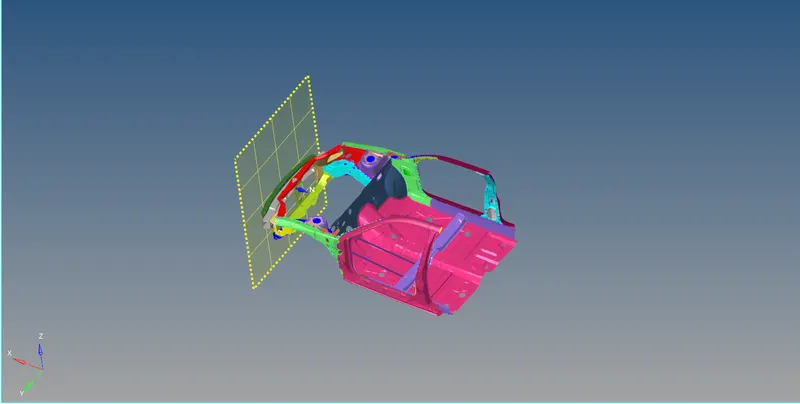
7. To Create rigid wall
- To create RWALL using hypermesh
- Create Rigid wall by Solver > Create > Rwall > Plane.
- Give sliding with friction of 0.1.
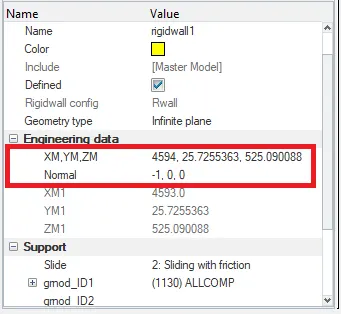
- XM, YM, ZM is the location where we need Rigid wall
- Normal is the direction normal to the rigid wall depending on the Global co-ordinate system. here we need normal in X direction.
8. Check the model, eliminate errors and minimize warnings
- To check the quality go to Hypermesh and Tools > Model Checker > Radioss Block
- Click on Run Checks, When the check is finished it will be show on the bottom.
- If we have errors Click on Auto Correct, it will eliminate almost most of the errors.
- Still errors persist we need to look manually and correct it.
9. Give Time step and Run time
- In Hypermesh from model browser choose Cards
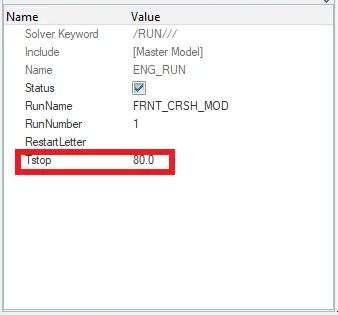
- From cards open ENG_RUN
- In that give the value of Tstop as 80.
- To give the time step value open the ENG_DT card.
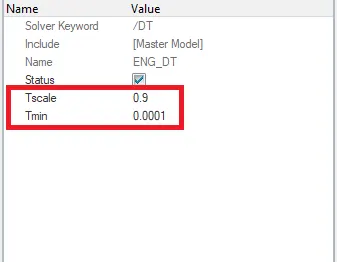
- In that give the value .0001 for Tmin.
- Give the Tscale value as 0.9
Procedures For creating Output requests
Output requests :
- Sectional force in the rails at location of indicated node 174247
- Axial force received on the rails from bumper.
- Shotgun cross sectional forces.
- A pillar cross section.
- Acceleration curve received on the accelerometer at base of B pillar (on B pillar rocker).
- Intrusions on the dash wall 66695,66244
1. Creating Cross sections at rails, shotgun, A pillar :
- For createing section we need to define skews so first we create skew.
- Go to solver tab Right click> Create > Skew > MOV
- Then we need to select the nodes to define the planes for getting direction of the skew.
- First select the node to show origin, then choose an axis and select the nodes to define a plane.
- Click on create.
- Now we can create a section. Go to model tab Right click > Create > Cross section.
- In the Entity editor Give the parameters correctly.
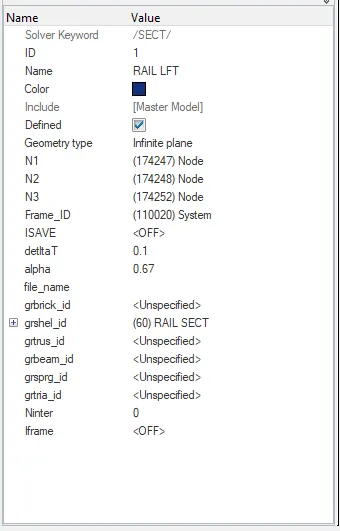
- Give a Name to the crosection.
- Select 3 nodes to define the x-axis and x-y plane.
- In Frame_ID select the skew that we created.
- In deltaT give .1 and for alpha give .67
- l In grshel_id select the set of elements. Where we want to see the section force.
- Like this we need to create sections and skews in 6 areas. (Left and right rails, shotgun and a pillar)
- 174247, 139604, 103242 these are the nodes where we need to create section on Left side.
- So we create a temp node in each point and do.
- For right side we need to reflect these nodes to find the nodes there.
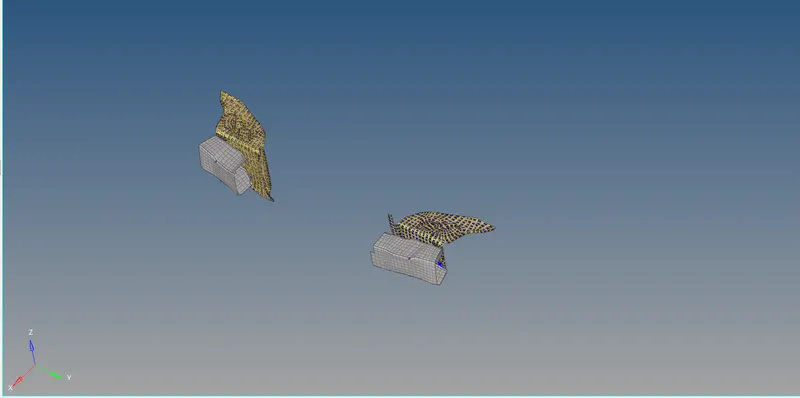
2. Axial forces can be identified by creating interfaces on both rails and bumper :
- We need to create 2 interfaces, Left and right . With the bumper and rails.
- The interfaces should be made with Type 7 Card and with recomended parameters.
- Master will be rail elements and the slave should be bumper nodes.
3. Intrusions on the dash wall 66695,66244 :
- Intrution is measured using 2 spring from each of the given node and the middle cross beam.
- For creating spring we go to 1D > springs > select the nodes between where we want to create the spring.
4. Creating Accelerometer for acceleration curve :
- Right click on the model browser area Create > Accelerometer
- In the Entity editor in node_ID Select the node where we want to place the accelerometer.
- Click on proceed.
5. For ploting graphs, add TH as required :
- Go to solver tab.
- Right click on TH, Select option as we needed.
- INTER- Interfaces
- ACCEL- Acceleration
- SPRING- spring elongation
- PART- For each parts forces
- SECTIO- sectional forces
- First we select INTER for ploting forces.
- In Entity ID select the interface of which we need to plot tge graph.
- In NUM_VARIABLES select number of variables (How many forces you need to plot in y axis)
- In INTER select which all forces you need to plot.
- Like this create TH of ACCEL, SPRING, PART, SECTIO ... etc
Simulation analysis and plotting graphs:
Energy Error and Mass Errors:
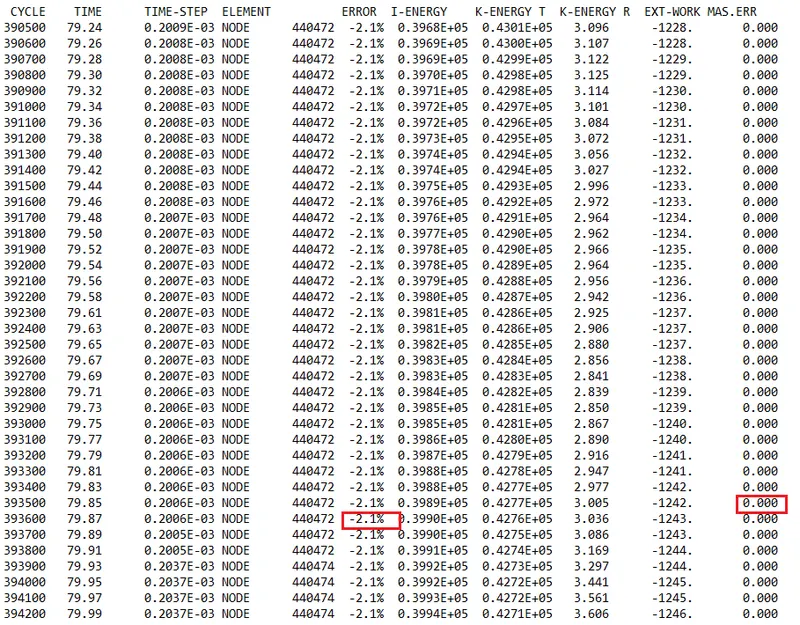
- Energy error is 0 to -2.1 % and mass error is 0% this is due to energy is dissipated from the system.
- In case of under integrated elements, the Hourglass Energy can explain a negative Energy Error since it is not counted in the energy balance.
- If the enery error value negative and decreasing, also is less than 15% it is acceptable.
- For Mass error, it should be less than 5% of the total model mass.
Simulation:
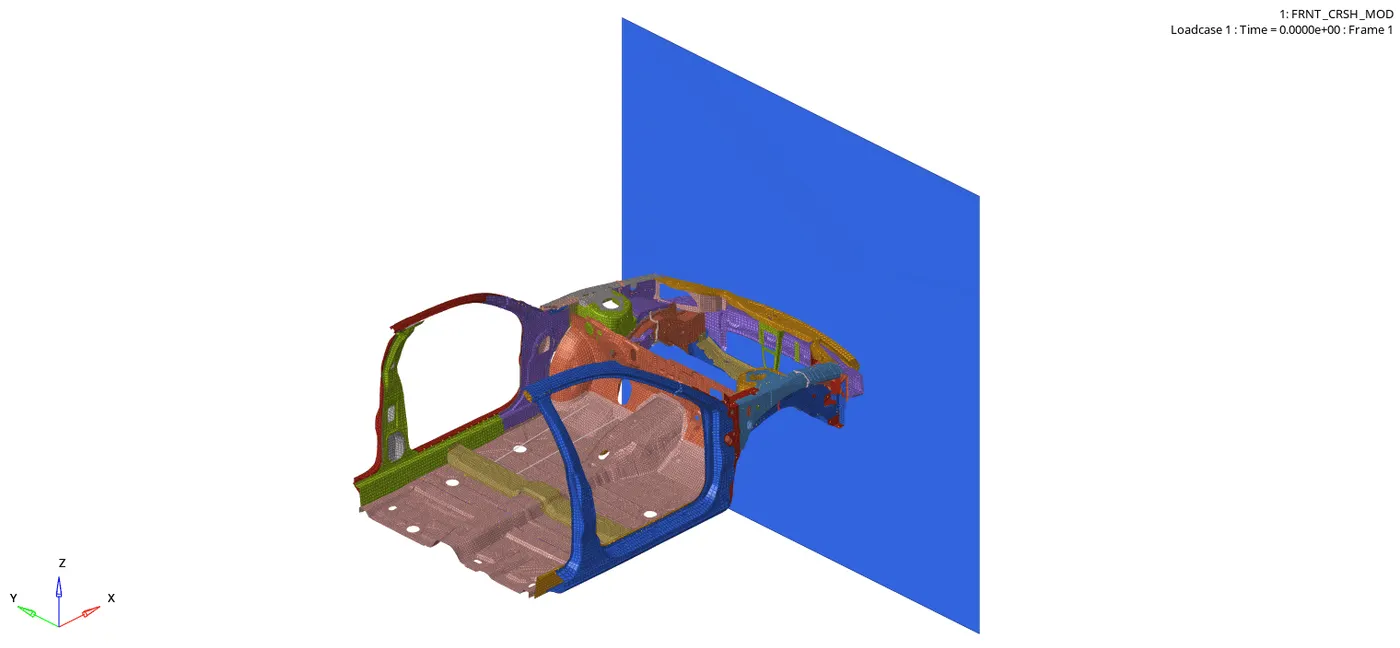
Internal energy graph:
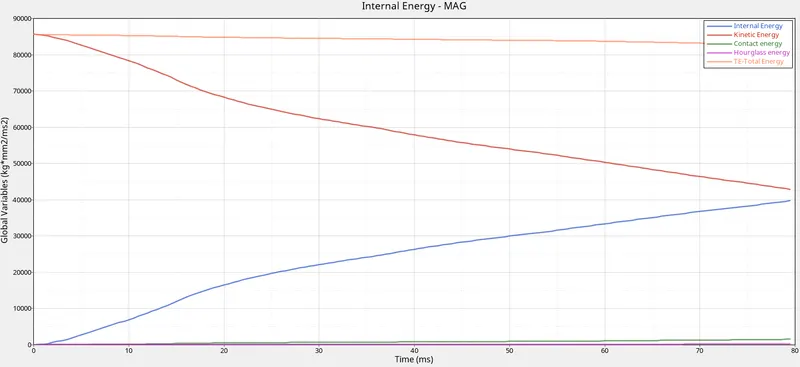
- For the car components, we used Ishell=24 QEPH formulation so only a small presence of the Hourglass energy is present .
- The contact energy is formed only when there is penetration, at the begining there is no penetration.
- But at the end there is some penetration so some contact energy is created.
- Initially the K.E energy is high and will reduce as the car moves forward and get crushed.
- The K.E energy is absorbed by the car and deformations occur.
- So the kinetic energy is converted to internal energy .
- That is why when we look at K.E and internal energy graphs we can see that the reduction in kinetic energy curve is just the opposite of increasing internal energy curve.
- The total energy is the sum of all energy so the curve is like a straight line.
Sectional Force at Rails :
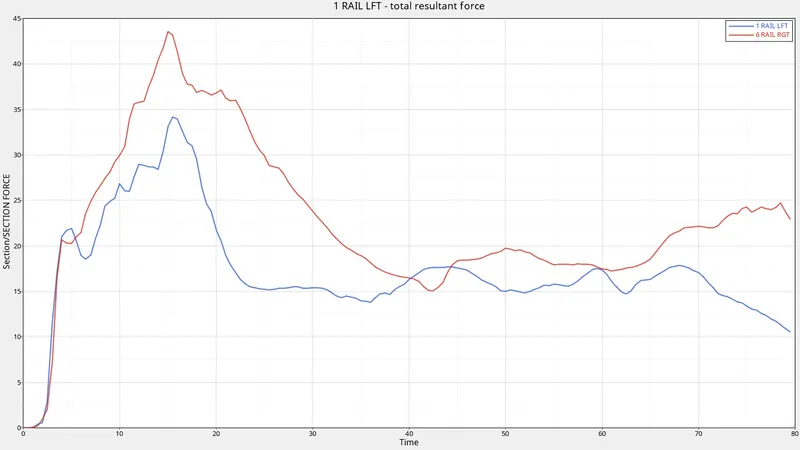
- From the bumper part of load will carry through LH & RH rails of car.
- From the graph the max force are flowing though the rails because the rail is more stiffer compare to the bumper and crush tube.
- Force received at Rails Sectional RH is 43.56KN @ 15.00 ms
- Force received at Rails Sectional LH is 33.08KN @ 15.00 ms
- To study the sectional force at rails I plot graph with X-axis as Time and Y axis as Resultant force.
- We can see from the animation that the rails Almost at the front most area, So maximum force will be felt there.
- When we compare left and right rails we can see that the force is more on right rail which is 43.56kN at 15ms and left rail have 33.08kN at 15ms.
- When we look in the animation we can see that at the maximum force, at that time the right rail and left rail starts buckling.
- Thats why after that point the force is reduced.
- Also you can see that the right rail is buckled and moving But the left rail is buckled and then again get crushed with the wall.
- So in the graph the right rails curve is going down and left rails curve is staying in between a range.
- The difference in force felt initially is different due to the difference in connections given there and also a hole is present in the right side of the car.
Sectional Force at Shotgun :
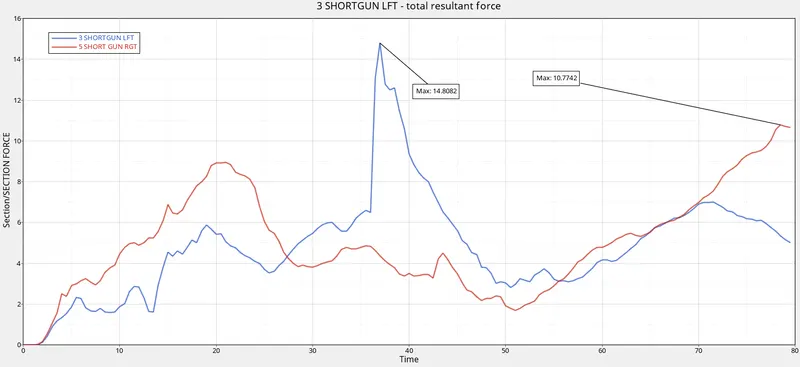
- From the bumper part of load will carry through LH & RH shotgun of car.
- From the graph the force are flowing though the Shotguns is less then Rails because less stiffer and from the structure design we can see the distribution is more on rails then the shotgun.
- Force received at Shotgun section RH is 10.774KN @ 78.5 ms
- Force received at Shotgun section LH is 14.808KN @ 37.00 ms
- Plotted the graph with X-axis as Time and Y axis as Resultant force on shotgun.
- Initially the force felt on the shotguns are the force which are coming from the rails.
- That is why the Left shotgun has a slight increase in the force than the right shotgun.
- Due to the presence of the hole, the right rail is deformed more and force is absorbed.
- So lesser force will be transmitted to the right shotgun.
- Then the forces on both shotguns increases till they buckle, after buckle the forces decreases.
- At time between 30 -40ms we can see a sudden increase in force on the left shot gun this is because at that time the left shotgun directly hits the rigid wall.
- Also at time 46ms the right shotgun will also directly touch the wall so an increase in force can be seen there.
- After the direct hitting on the wall boths force will reduce due to buckling.
Sectional Force at A pillar :
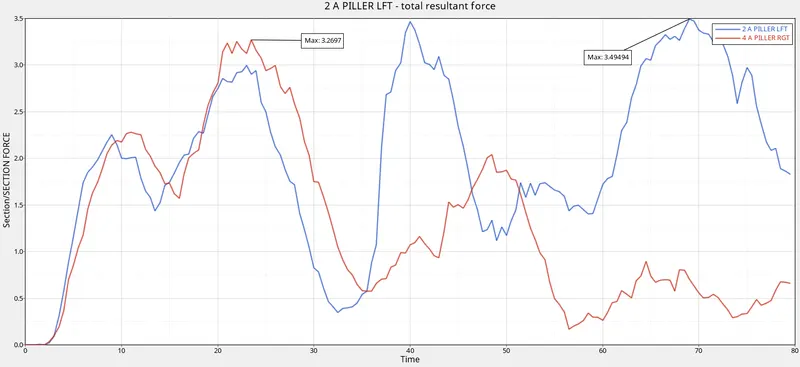
- From the Shot gun load will carry through LH & RH A Piller of car.
- From the graph the force are flowing though the A pliier is less then Rails and Shotgun because less stiffer and from the structure design we can see the distribution is more on rails then the shotgun then A piller.
- Force received at A pillar section RH is 3.26 KN @ 23.5 ms
- Force received at A pillar section LH is 3.49 KN @ 69.00 ms
- Plotted the graph with X-axis as Time and Y axis as Resultant force on A pillar.
- The passenger cabin will starts with the A Pillar so the force affecting this region should be less.
- As the force applied made lot of deformations on the rails and shotgun, only a small amount of force will be transfered to the A pillar.
- The left A Pillar have max of 3.49 KN and the right A pillar have max of 3.26KN.
- On the left A pillar curve we can see certain ups this is due to the buckling of each parts that are in front of the A Pillar.
- Like when we explained the shotgun it was seen that the buckling of parts will make a dip in curve
- And when the buckled part again hit the wall a hike in the force is seen.
- so how the force is recived in the rails and shotgun like the same will be recived in a pillar but will be of a lesser magnitude.
- In case of right A pillar the buckled parts are not hitting the wall again much.
- After the buckling the bended parts move upwards .
- so there is less force on the right A Pillar.
Axial force recived from the bumper to the rail:
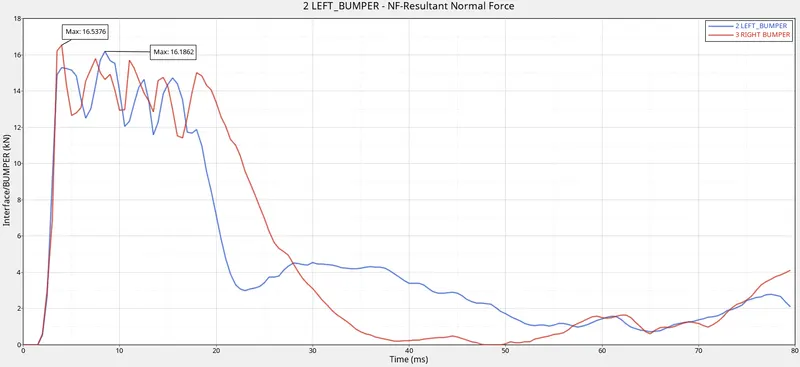
- Force which is coming from the crush tube and bumper is received by rails.
- to find this force we have contact interface b/w crush tube and rail.
- This force is divided in to RH and LH interface.
- Force received at RH rail is 16.537KN @ 4 ms
- Force received at LH rail is 16.1862KN @ 8.5 ms
- The axial force is the force applied by the bumper to the rail in lengthwise .
- At the beganing when the wall touches the bumper and bumper touches the rail there will be high axial force.
- At that time compression of parts occurs, after that the rail bends due to buckling and the force recived in the axial direction will be reduced.
Acceleration curve ( Based on accelerometer at base of B pillar) :
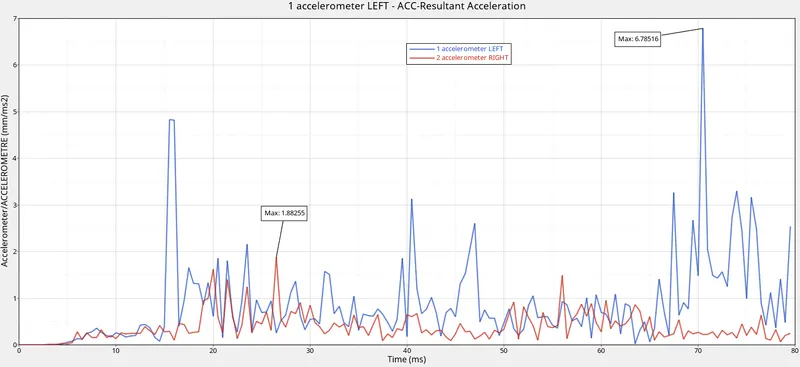
- To make the acceleration curve, we put two accelerometer at the base of B pillar on the rocker.
- The accelerometer on the right side gave a max value of 1.8825 mm/ms2 and the left side give a max value of 6.785 mm/ms2.
- Vibration is most commonly measured using a accelerometer.
- An accelerometer is a sensor that measures the dynamic acceleration.
- In crash accelerometer is used to measure the change in velocity wrt time so that sudden impact or crash we can check change in velocity of particular node.
- Initially there is no any change in velocity ie acceleration. Its starts fluctuating due to impact, due to impact the velocity is dropping w r t time.
Intrusions on the dash wall (66695,66244):
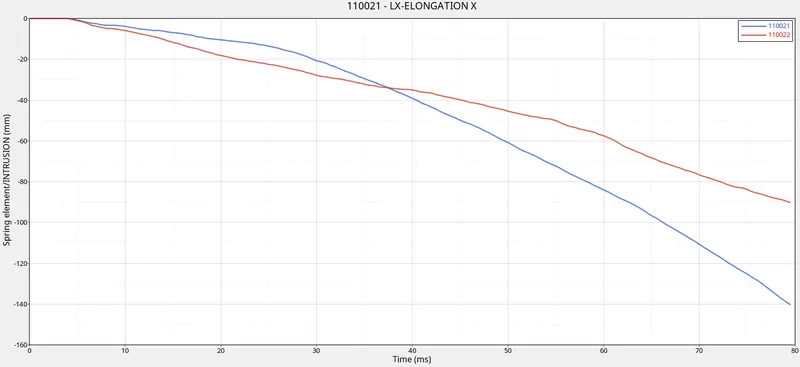
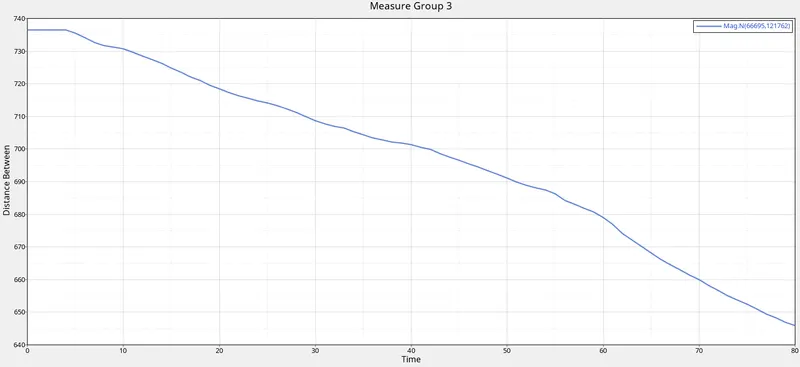
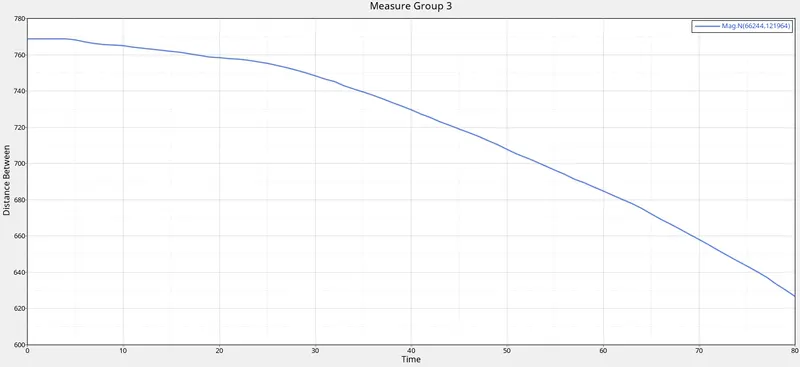
- Intrusions are one of the important parameter, while checking the passenger saftey in crash.
- It can be used to know how much of the car part came inside the passenger cabin during the impact.
- as the crushing happens the elongation happens in negative direction.
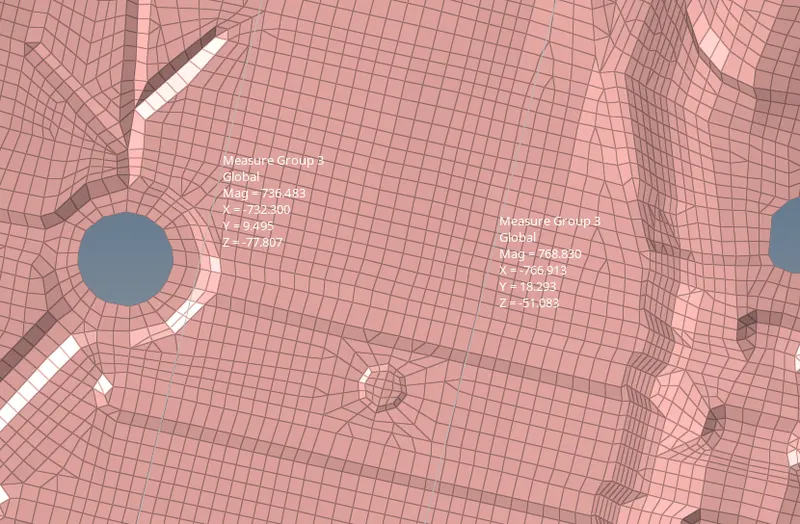
- Here to measure the intrusions at two points i have created 2 springs .
- By measuring the elongation we get the intrusion.
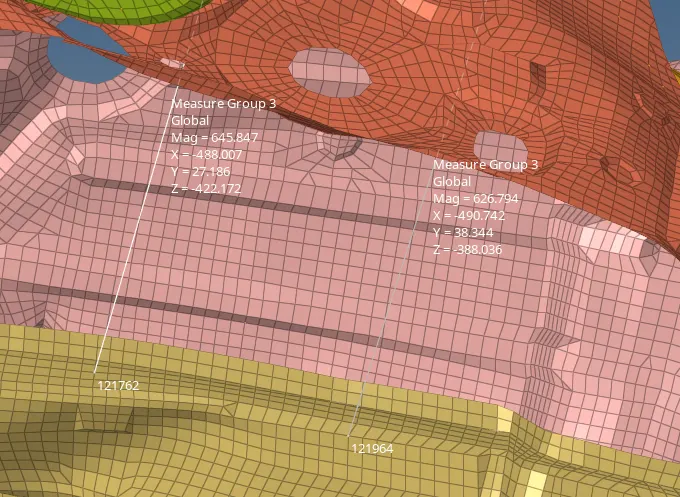
- Here 66695 is having an intrusion of 736.483 - 645.847= 90.636mm and the 66244 have 768.830 - 626.794= 142.036mm
Von Mises Animation :
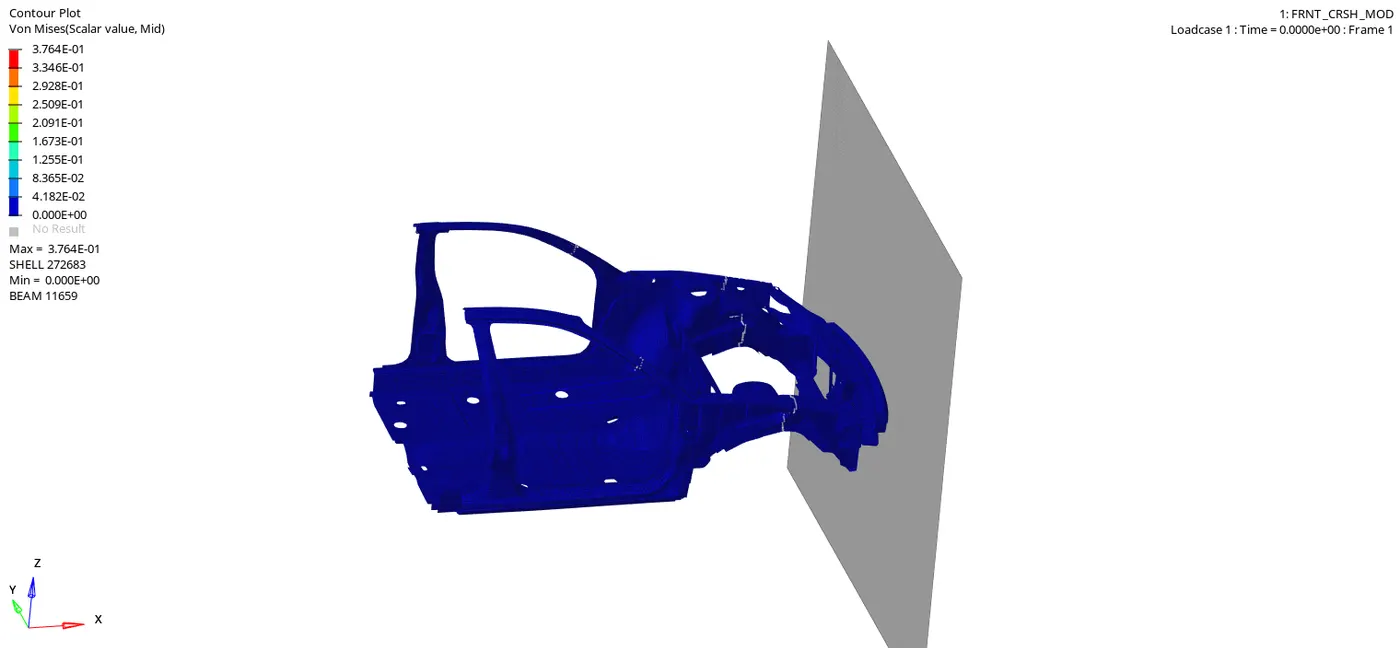
- Here we can see that the maximum stress is 3.764E-01 .
Conclusion:
From the simulation we understand how a front car crash is done, what all things should be checked while the crash test is done, How the car cash in simulation works and compare it to real experimental car crash, what are the difference in real condition and simulation.
From the graphs we understood many things like, from the sectional force graph we can exactly study the transfering of force from the rails to shotgun and from shotgun to the A Pillar. How the force decreases from one part to other.
It has been observed that there is minimum deformation of the cabin and also there was minimum intrusion at given nodes in driver compartment.
Result:
We have done simulation on Dodge Neon 1996 model car's BIW. The deck setup was done as the given condition. Simulation is done and all the graphs are ploted.