Assignment 6
Objective :
1) To check for unit system of the given model .
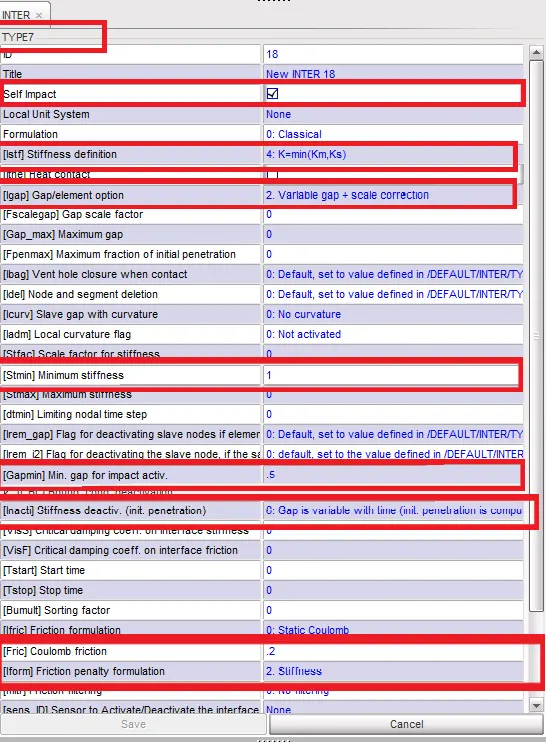
2)To create appropriate interface to the given model , with friction value as 0.2 and all other values as recommended paramters .
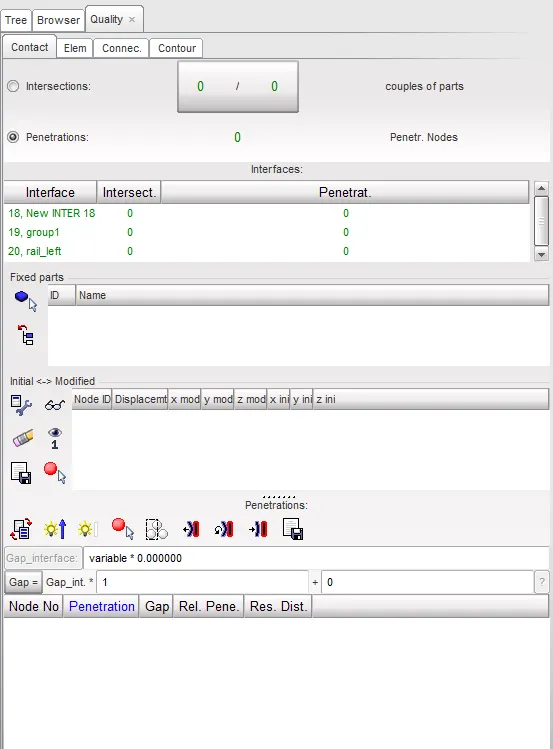
3) To check for initial penetrations and intersections .
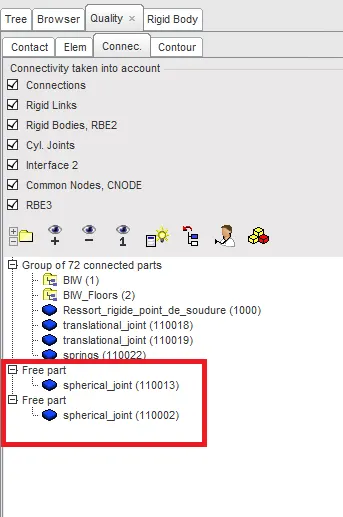
4) To check and correct rigid body issues if any .
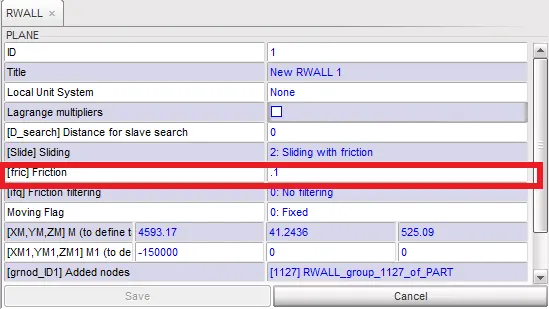
5)To create a rigid wall with friction 0.1 .
6) To postion CG at given location .
7) To assign initial velocity of 35mph to the car model .
8) To ensure good quality of the model before running simulation .
9) To input a timestep value between 0.5 to 0.1 microseconds .
10) To run the simulation for 80ms .
Output Request
1) Sectional force at front LH & RH rails .
2) Axial force received on the rails from bumper .
3) Shotgun cross sectional forces at LH and RH .
4) Sectional forces at A pillar LH & RH .
5) Acceleration curve at base of B Pillar on LH & RH side .
6) Instrusion into the dashwall for node ids 66695 , 66244 .
Procedure :
The given model was imported to Hypercrash and visually inspected .
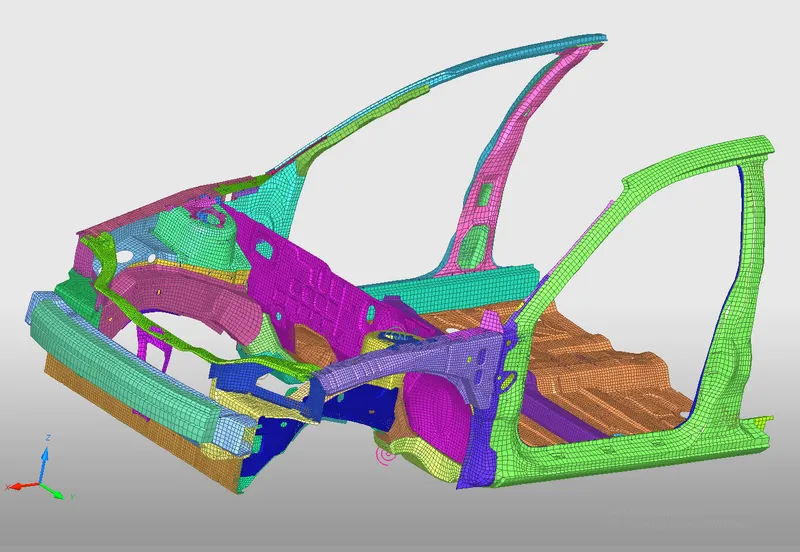
1. The given model was imported and the units were in kN , kg ,mm , ms .
2. To create an interface , create new option was used in browser tab .
Type 7 was chosen as interface type , recommended values were entered , self impact option was turned on . Master nodes were selected by using all nodes option in select by graphics .
3. To check for intial penetrations , check all solver contact interfaces option from quality tab of hypercrash was used . The total number of inital penetrations and intersections were found to be zero .
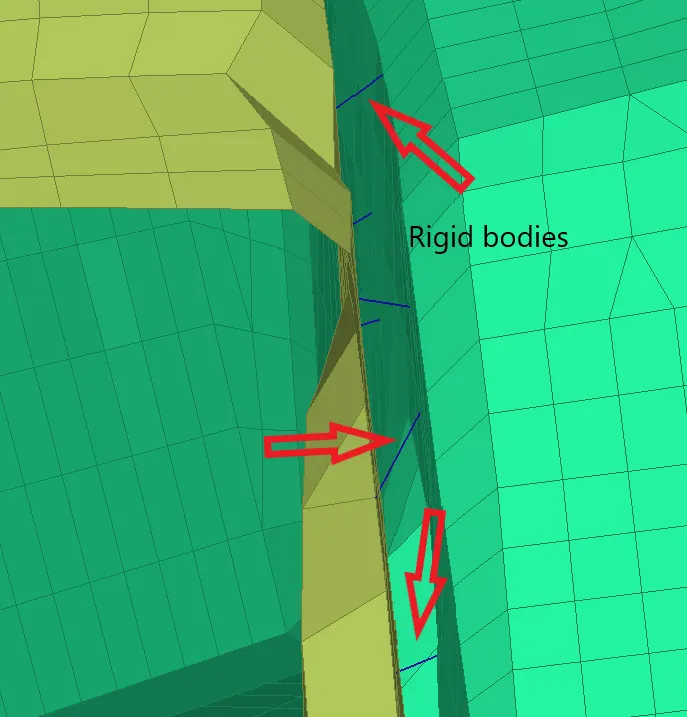
4. To check and correct rigid body issues , check connections option from quality tab was used . Parts were also visually inspected to ensure connection .
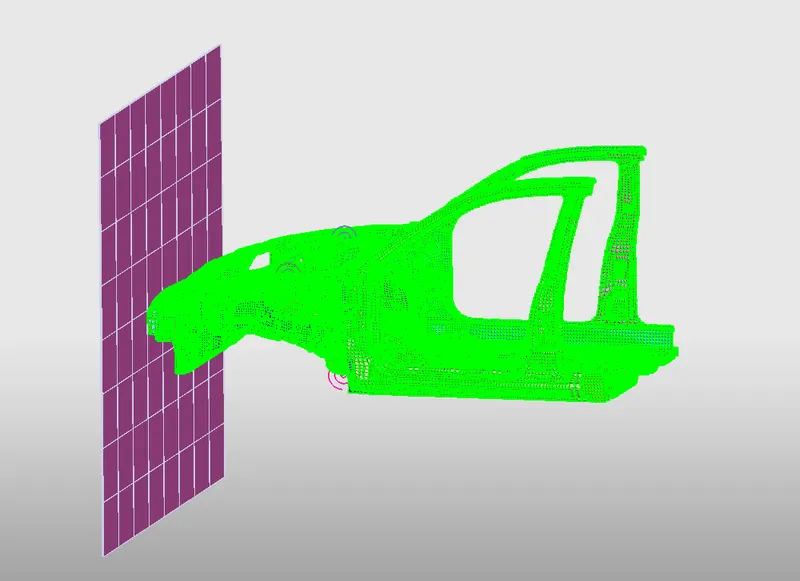
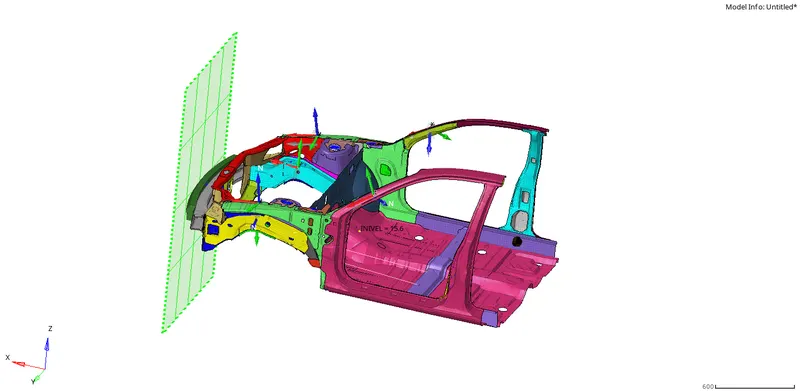
5. To create rigid wall at required location , rigid wall option was chosen from load case tab and required fields were input .
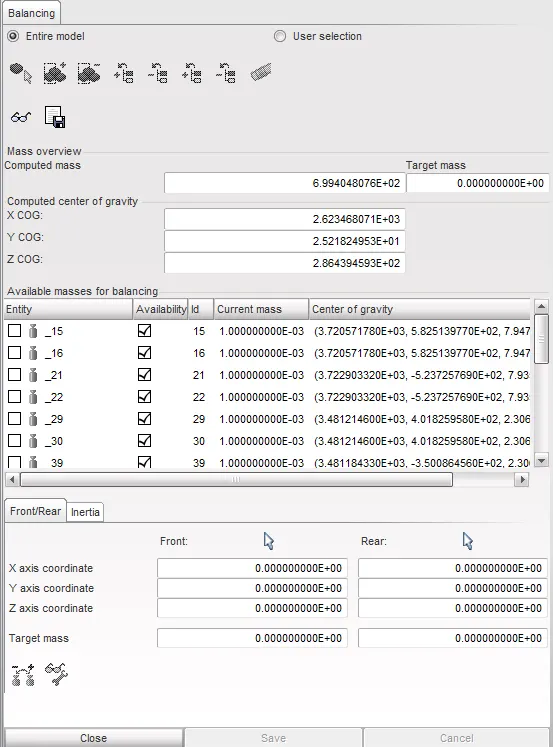
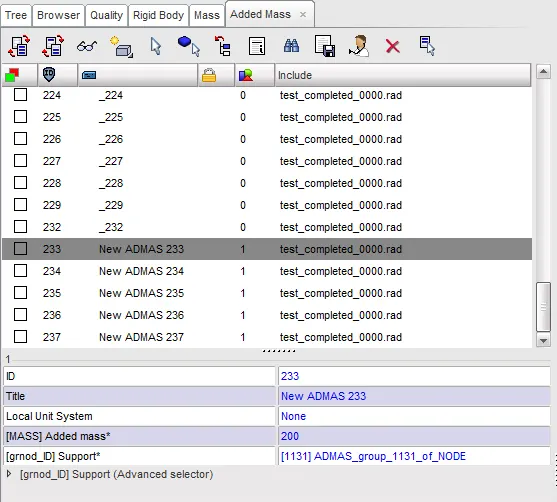
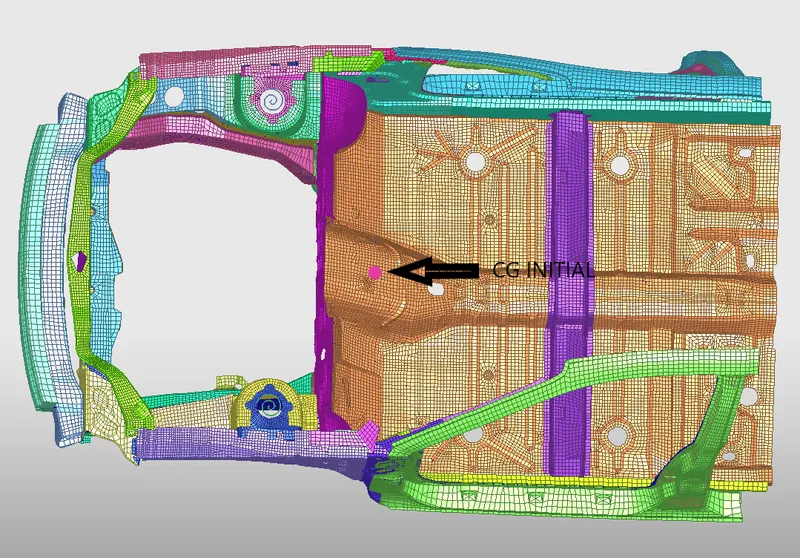
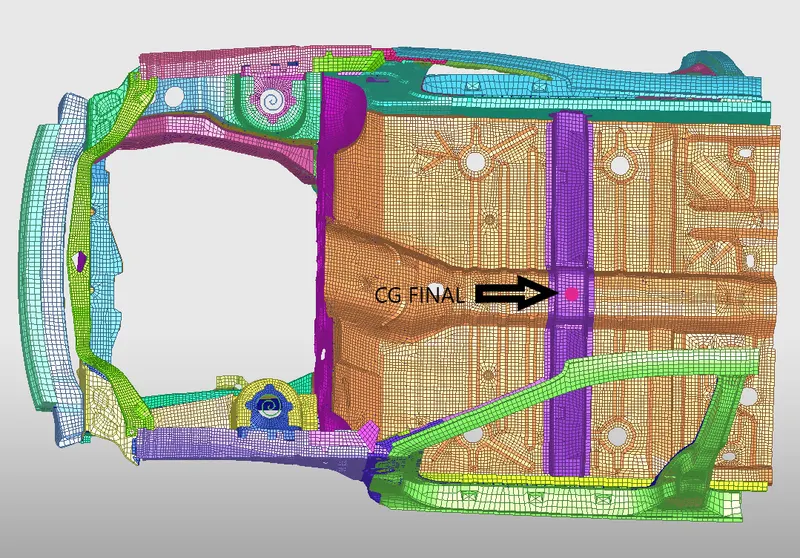
6. To position CG at given location , mass balancing option from masses were selected to find intial CG . Added mass option from load cases were selected to add masses at various locations to shift the CG to the desired location .
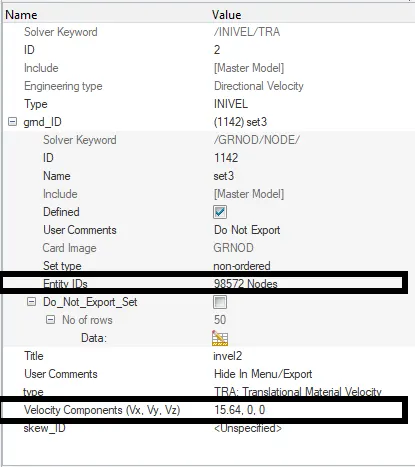
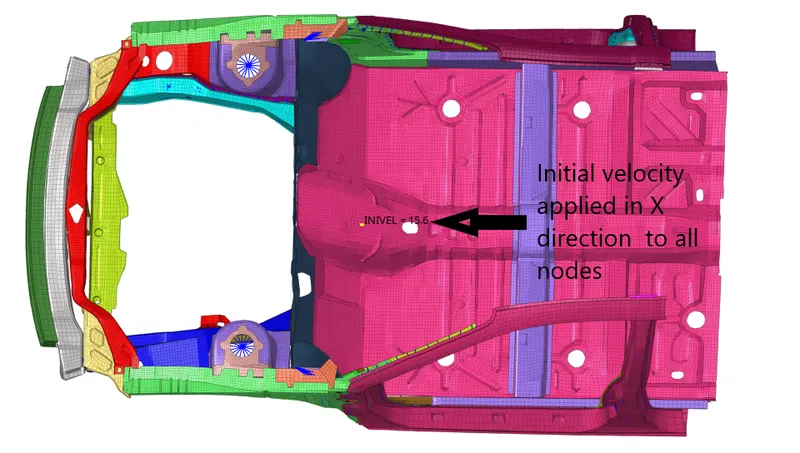
7. To apply initial velocity of 35mph or 15.646 mm/ms , initial velocity tab was opened from Boundary conditions option in solver deck of hypermesh .
The set with ID 1142 and name [set 3] was selected to assign velocities to all nodes in X direction .
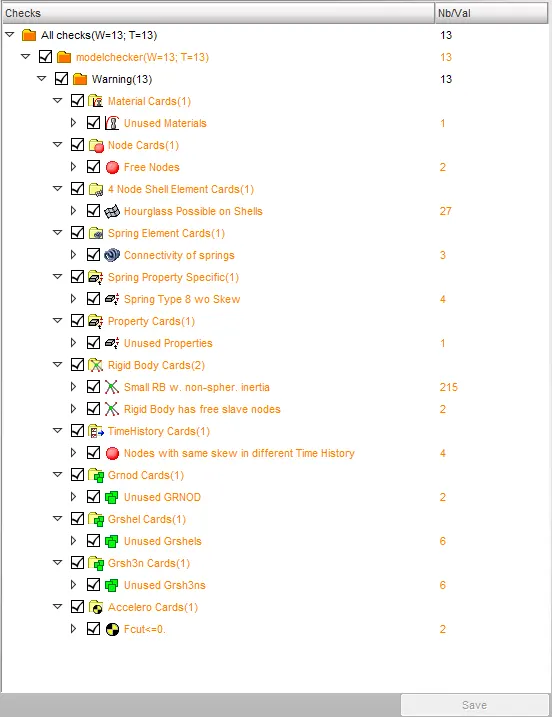
8. To ensure good quality of model , model checker from hypercrash was run and was ensured that there were no errors .
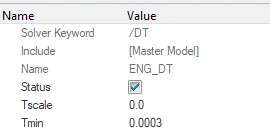
9. To input a timestep of 0.5 to 0.1 miscroseconds , ENG_DT card was created in hypermesh and Tmin value was entered as 0.0003ms .
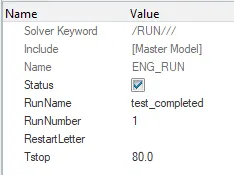
10. To run the simulation for 80ms , the Tstop value in ENG_RUN card was entered as 80 .
Procedure for output request .
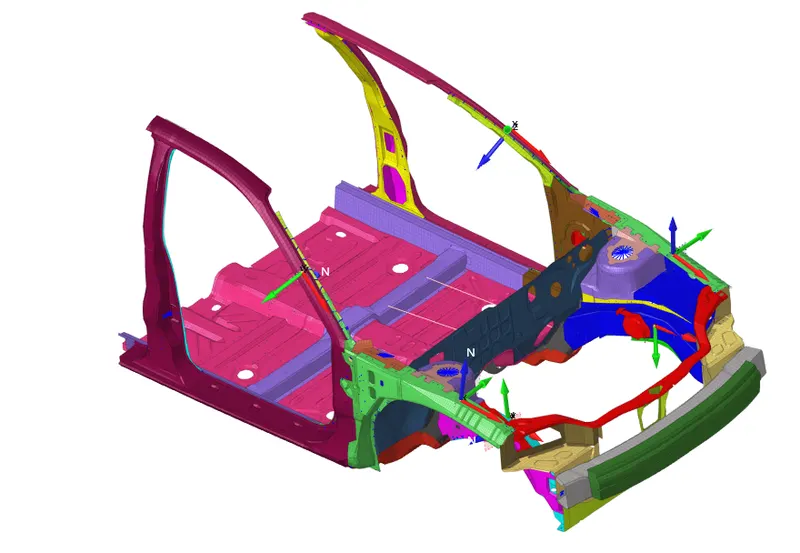
1) To create sectional forces at fron rails , a pillars and shotgun .
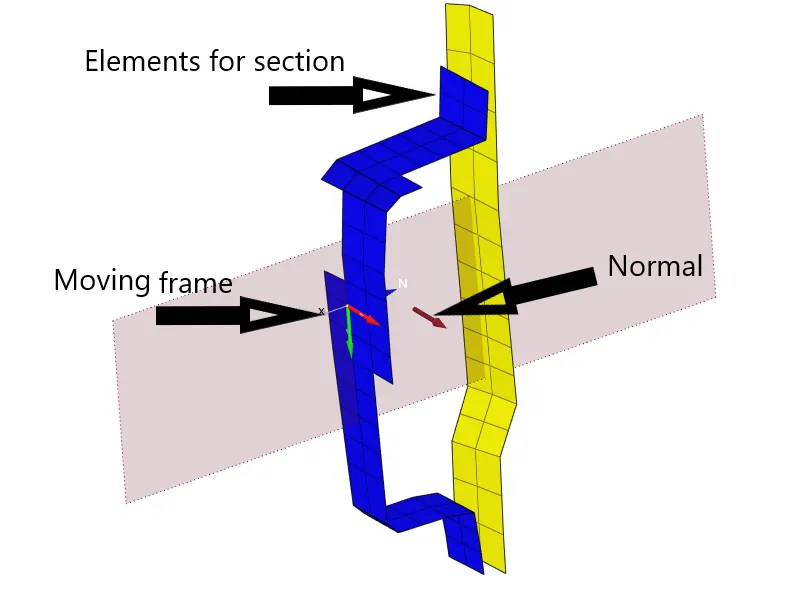
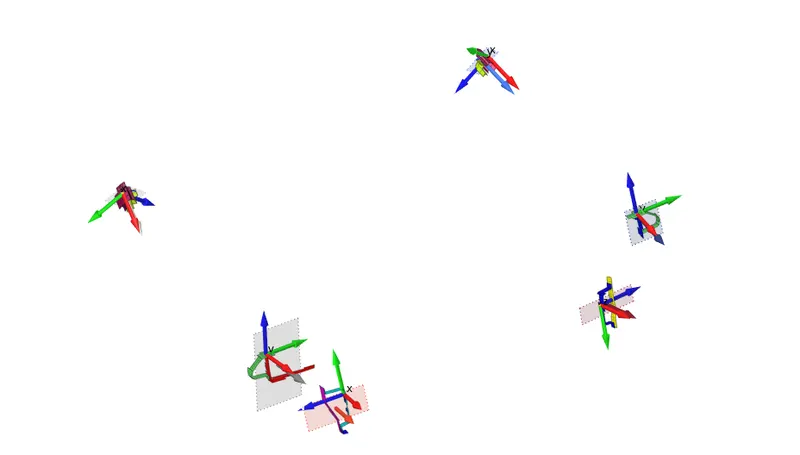
a) Moving frames were created on each parts on sides using create frame option from solver tab.
b) Sections were created by section option in solver tab, sets were created to select elements for each section . Frames were assigned to each section .
c) Normals were checked to be in same direction .
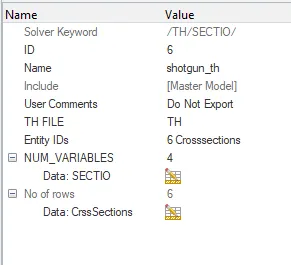
d) TH SECTIO option was selected and all sections were assigned individually .

2) To find axial forces between the rails and bumpers
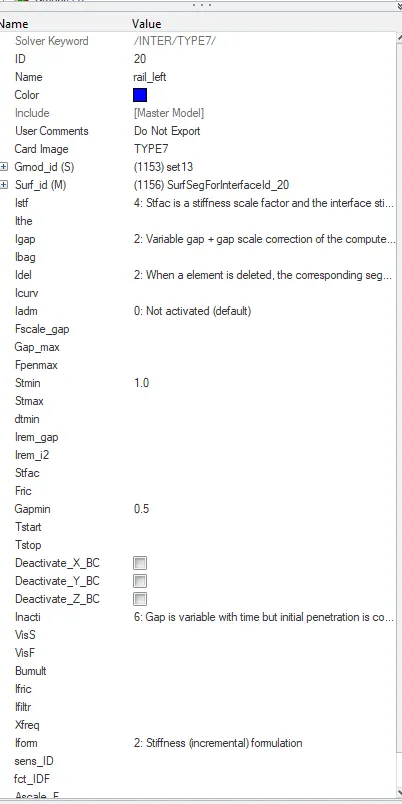
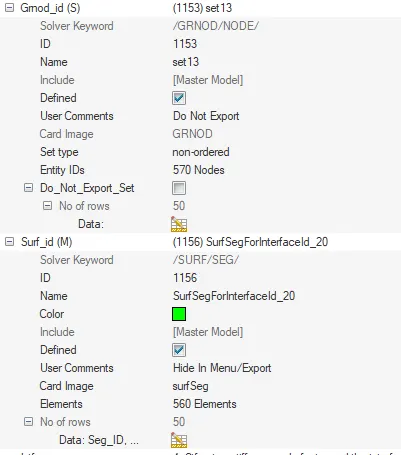
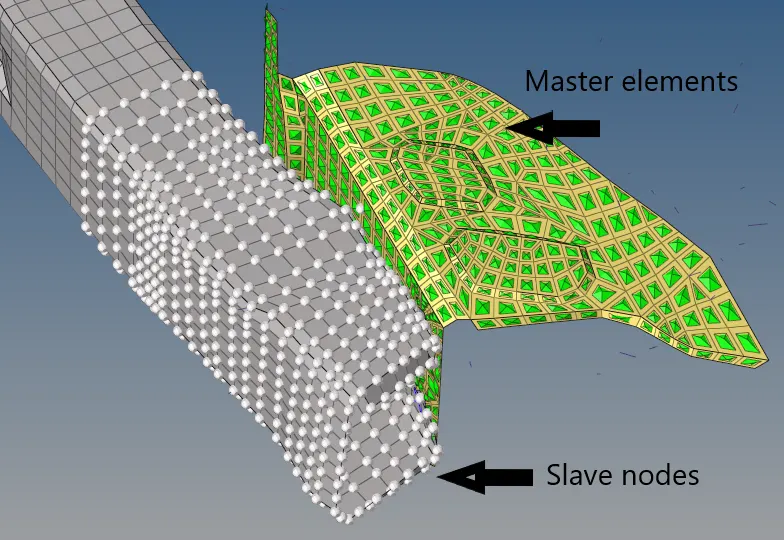
a) Two seperate interfaces of type 7 were created .
b) Recommended values were entered after selecting master and slave nodes repectively by creating sets.
c) TH INTER were created using solver tab.
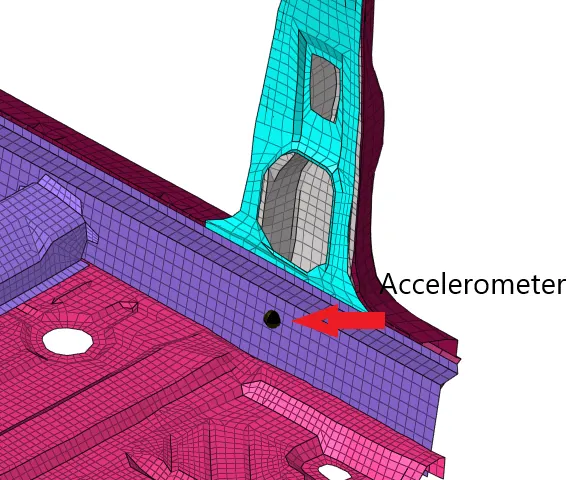
3) To plot acceleration curves at base of b pillars .
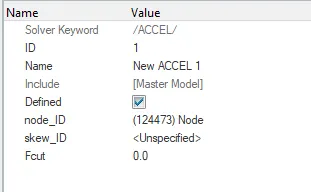
a) 2 accelerometers was created on base of b pillars using hypercrash .
b) TH ACCEL option was used to assign two accelerometers .
4) To find intrusion into the dashboard for node id : 66695 , 66244 .
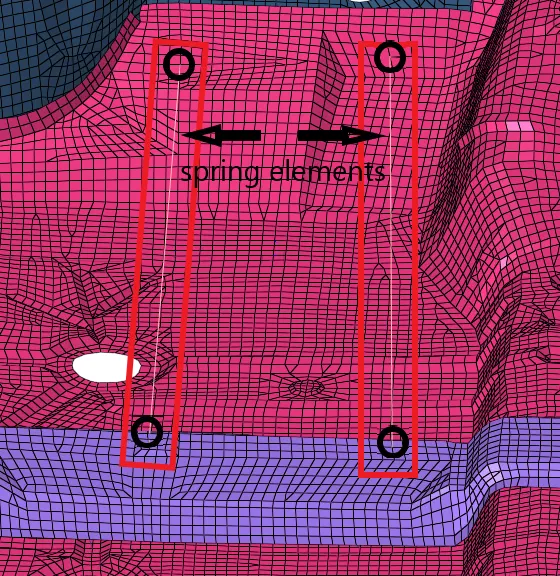
a) 2 springs were created between
node : 66695 and 121739
node : 66244 and 122048
with respective properties assigned .
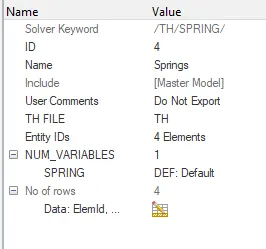
b) TH SPRING was created and springs were assigned .
Results
1) Sectional Forces at left and right rails .
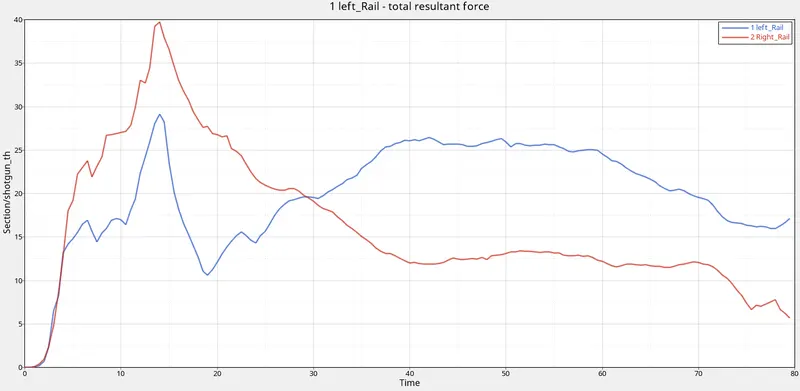
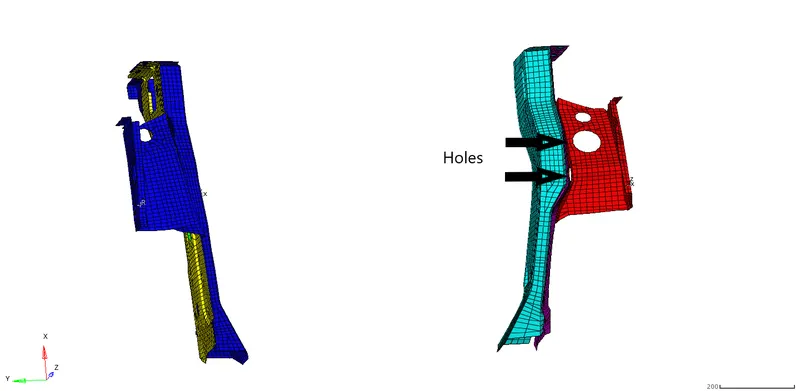
Here we can observe that the peak force at left and right rail are different . Right rail has a peak value of 40 kN at approx 14 ms and left rail has a peak value of around 29 kN at 14 ms . The forces for right rail decreases once it reached its peak . Whereas the forces in left rail dips and then increases again . There is a difference in energy absorption by both rails because of the difference in their design . The right rails have 2 holes present in them , whereas the left rails are not having those same holes . This leads to the difference in deformation pattern of the two rails . Hence at the end of 80ms left rail transfers more energy to the adjoined parts than right rail .
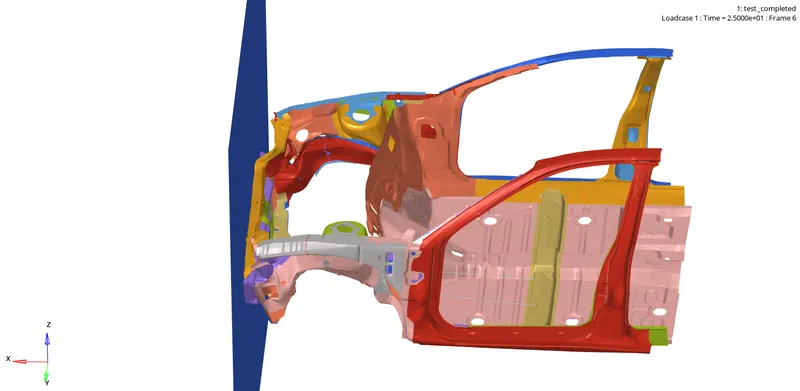
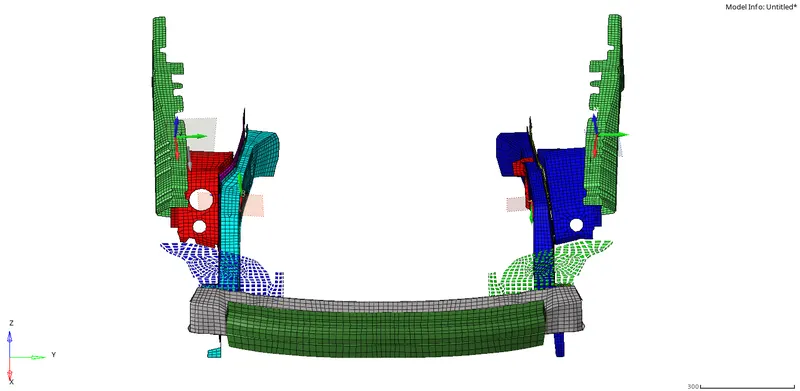
2. Axial forces received on the rails from bumper.
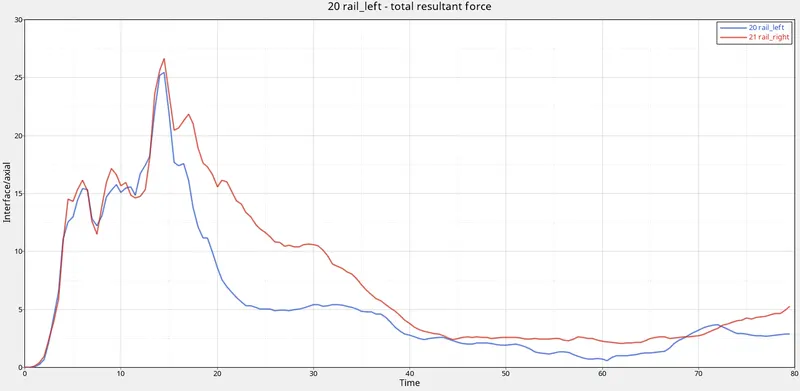
Here we can observe that the axial forces acting on rails from bumpers are almost very similar . Peak forces on left rail reached around 25kN and right rail around 27kN . Since bumpers are connected with rigids to rails , much of the forces are being transferred directly to rails .
3. Sectional forces at A Pillar .
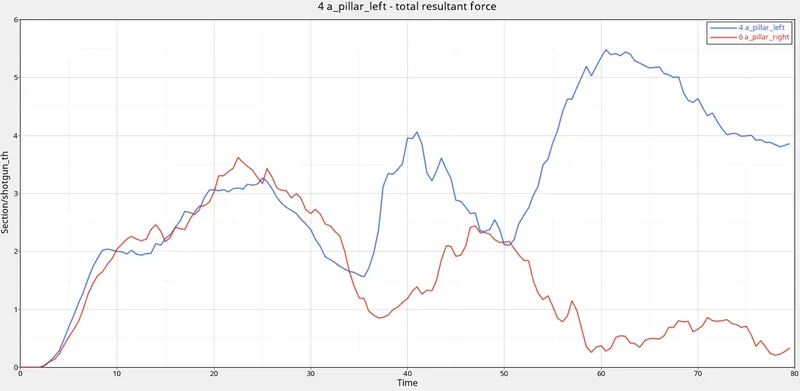
Here we can observe that values of forces remains almost same for left and right pillar upto approximately 33 ms , after which forces in left A pliiar rises and reached a peak vaue of approximately 5.5 kN whereas forces for right pillar reduces gradually with respect to time .
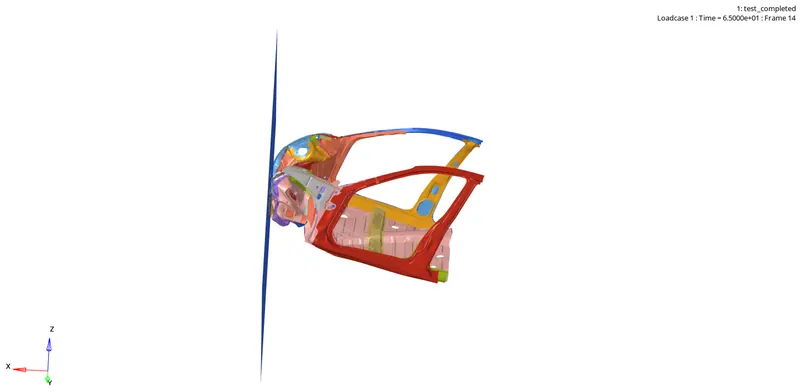
4. Acceleration curve received on the acceleromter at base of B pillar .
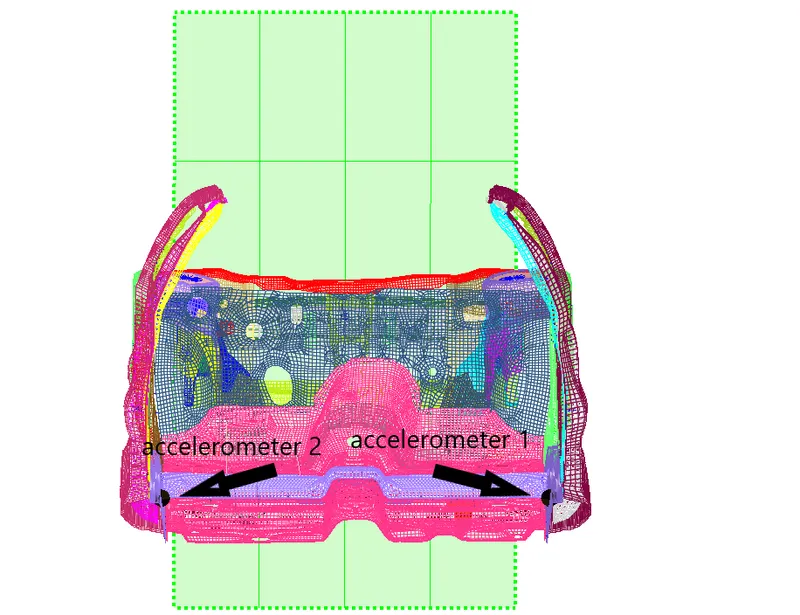
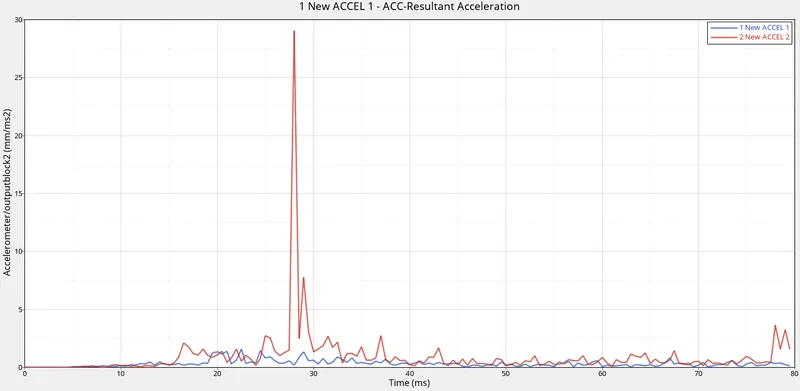
Here we can observe that the acceleration of the node on left side rises sharply after 26 ms to a peak value of 28 mm/ms^2 . Whereas acceleration on right side of b pillar remains comparitively stable . This is due to the fact that more energy is being transferred from rails of left side to the passenger cabin . whereas rails on the right side have absorbed much more energy and have only transferred less energy to passenger cabin .
5. Intrusions into the dash wall node ID : 66695 , 66244 .
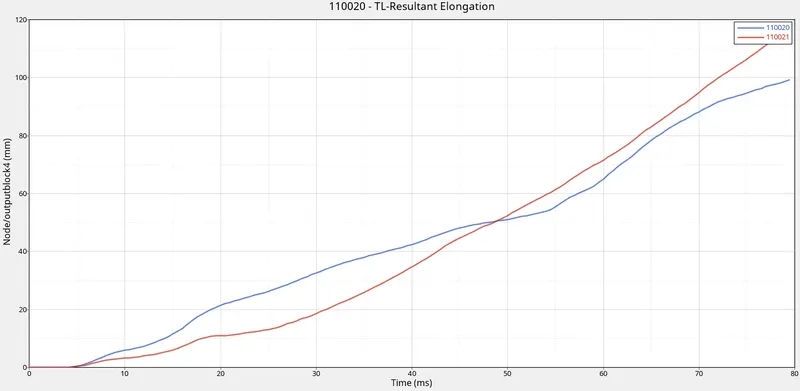
Here we are creating 2 spring elements with minute stifness and measuring its elongation in order to find out dashboard intrusion of the above mentioned nodes .
The spring element ID 110020 and 110021 corresponds to node ID 66695 and 66244 repectively .
From the graph , we can see that the resultant elongation for node ID 66695 is 117mm implying that it has intruded 117 mm into the passenger cabin .
Resultant elongation for node ID 66244 is 99mm , implying that it has intruded 99mm into the passenger cabin .
6. Energy graph
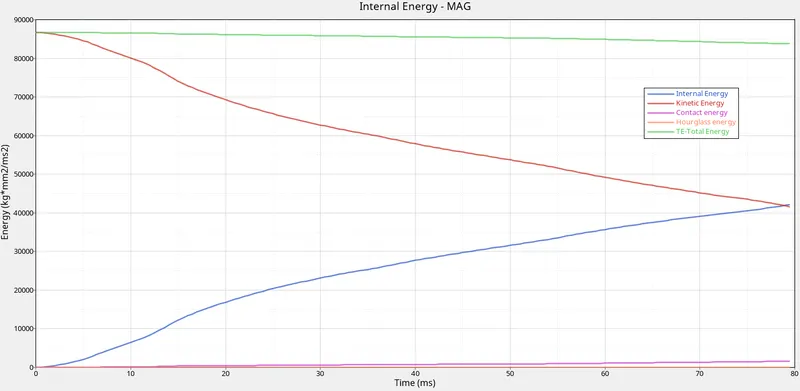
Here we can observe that kinetic energy is being converted into internal energy , represented by decreasing kinetic and increasing internal energy . There is a slight reduction in total energy as there is formation of contact energy which is dissipated from the system .
Conclusion
From the above run simulation , we can observe that , the rails on the right are capable of absorbing much more energy and able to deform than the rails on the left side . However , eventhough rails on right are more deforming , the dashboard intrusions are more on the right side . Hence we can conclude that eventhough left rails transferred more energy , dashboard intrusions were comparitively low on the left side . Also if we take into considerations the impulsive forces , the left side B pillar has high acceleration value , which corresponds to high impulsive forces . Hence passenger on the right side is less afftected by crash than driver on the left side .