Assignment 5-RADIOSS Interfaces & Study of Effect of Notches Challenge
Assignment 5-RADIOSS Interfaces & Study of Effect of Notches Challenge
Aim
To mesh the given model with a mesh size of 6mm
To create different interfaces with recommended properties and compare the simulation results
Theory
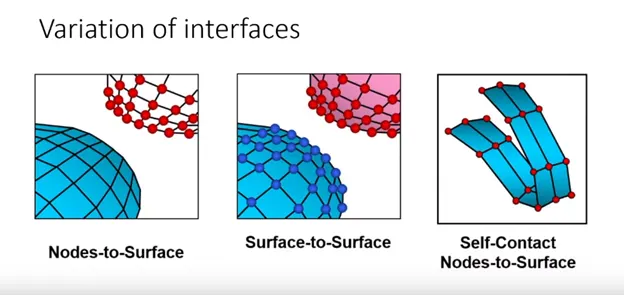
Interfaces are defined to model how parts interact when they come in contact with each other
The 4 types of interfaces that are widely used are
- Interface Penalty Method
- Type 7, variable stiffness, node to surface contact
- Type 11, variable stiffness, edge to edge contact
- Type 24, linear stiffness, node to surface and surface to surface contact
InterFace Penalty Method
This method treats the behaviour between the slave node and master segments(surfaces), like springs that generate the resistive forces as a function of penetration
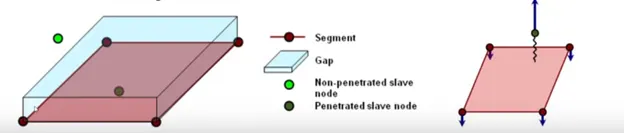
Time step is inversely proportional to stiffness.
There are 2 types of time step.
- Nodal Timestep
- Kinematic Time step, governs the simulation.
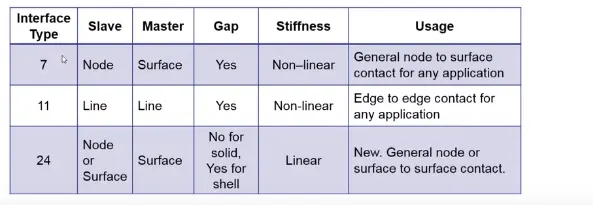
The differences between type7,11 and 24 are listed below
Procedure
Model 1
- Open the model to be meshed
- Perform Geometry clean up,manually, on the model to remove intersecting surfaces,etc
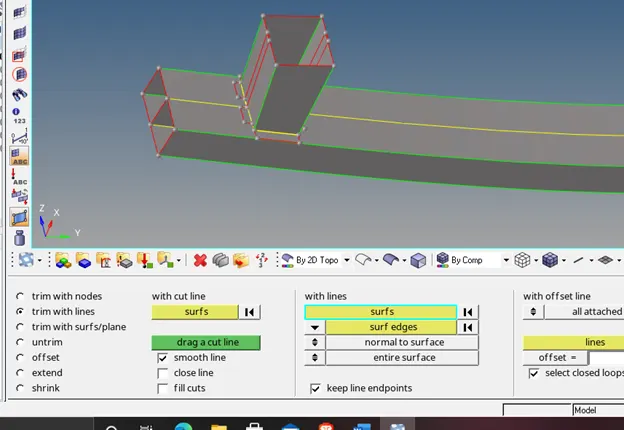
- This can be done using tools like extend,trim with lines,trim with surfaces in surface edit
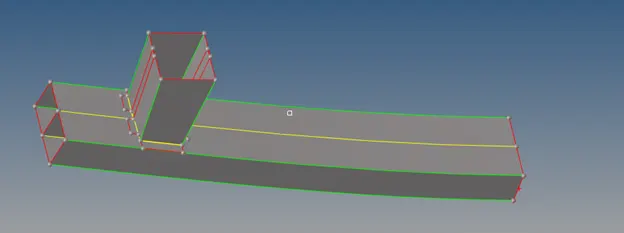
- After geometry clean,mesh the model surface by surface with a mesh size of 6mm.
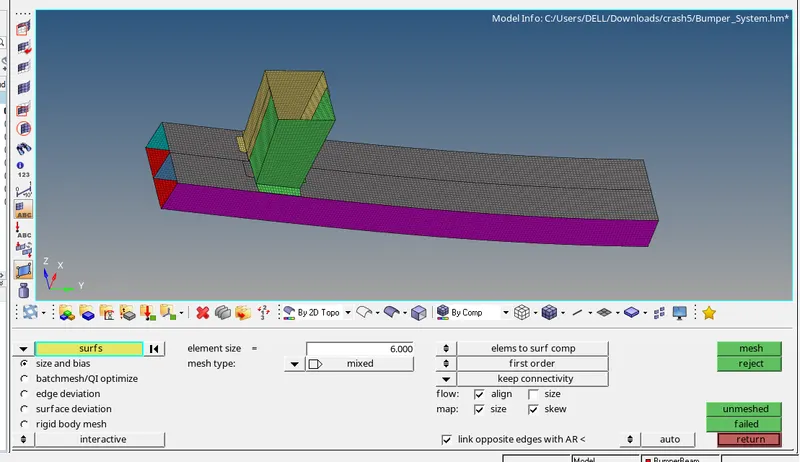
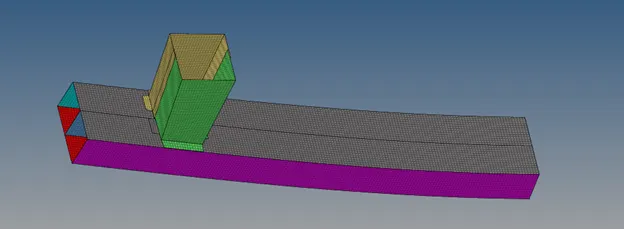
Model 2
Case 1:Run the model as is on the radioss solver.
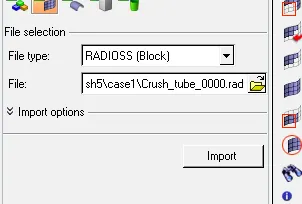
- Import the crush_tube_000 file in hypermesh
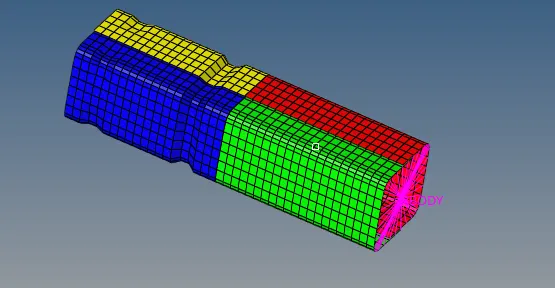
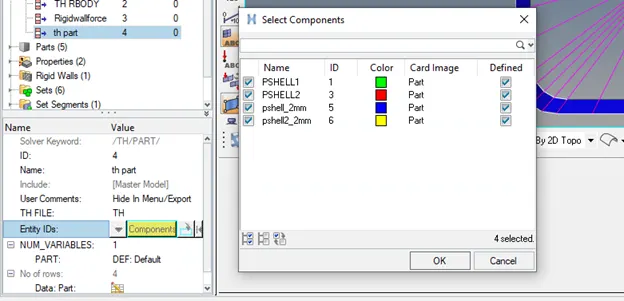
- Create a thpart in the output blocks and select all the components.
- Go to analysis -> radios and add nt -4 in options
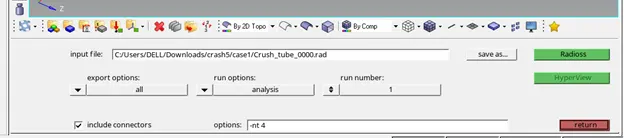
- Start the solver and move to case2 after it has finished solving.
- We will look at post-processing all the different cases in a later section of the report.
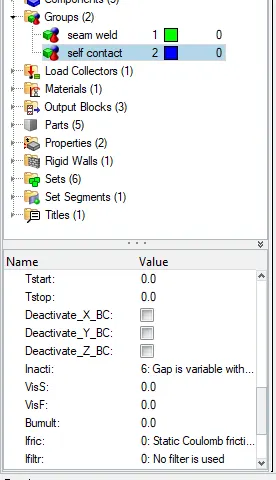
Case 2:Change inacti to 6 and run the solver
- In groups,go to self contact and modify the value of inacti to 6.
- Go to analysis->radioss and start the solver
Case 4:Creating a type 11 contact
- Create a new group under the group's category and name it type 11
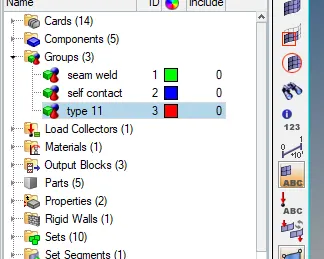
- Change the card image to type 11 and select all the components for master and slave.
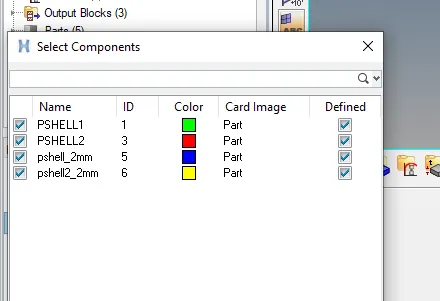
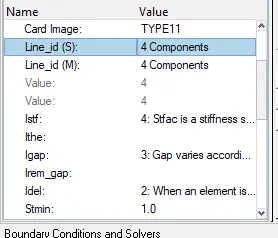
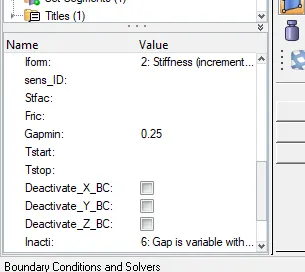
- After modifying the values appropriately,run the model on the radioss solver
Case 4:Remove notches and boundary conditions
- The notches can be removed using project and align commands.
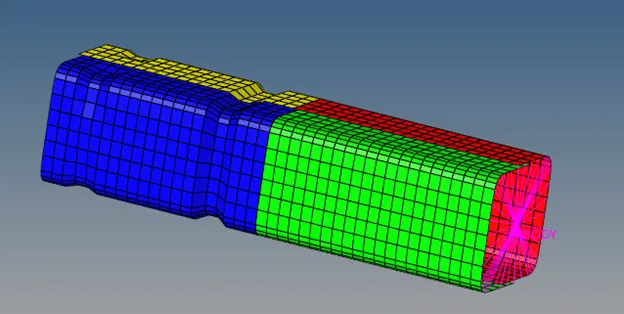
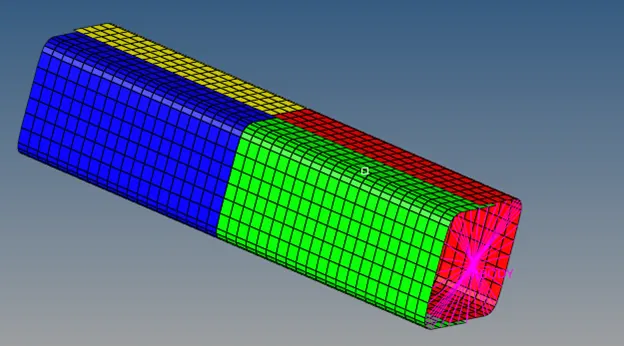
- The boundary conditions can be deleted by going to the solver browser and deleting the bcs card.
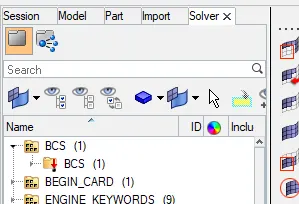
- After this,run the file on the radioss solver.
Case 5: Create a notch in the middle of the component
- A notch can be creating using the translate command.
- We create a depth of approximately 3mm to create the notch by translating the nodes on the appropriate axis.
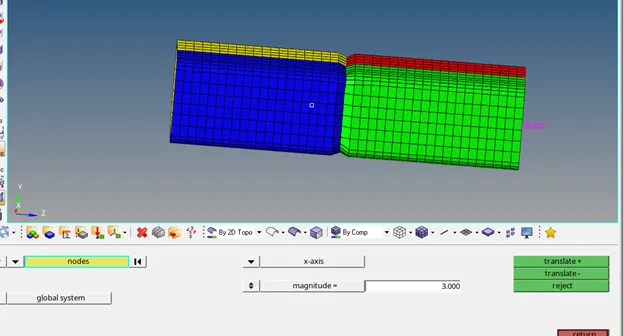
- After creating the notch,the file is run on the radioss solver.
Case 6:Creating a notch on 2 opposing faces only.
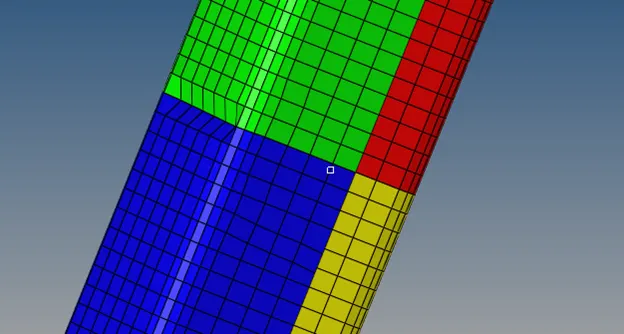
- Using the project/align/translate options we can create a notch on 2 opposing faces
- After this run the file on the radioss solver.
Post Processing
Case 1
- The energy and mass error can be seen in the .0001out file on any text editor.
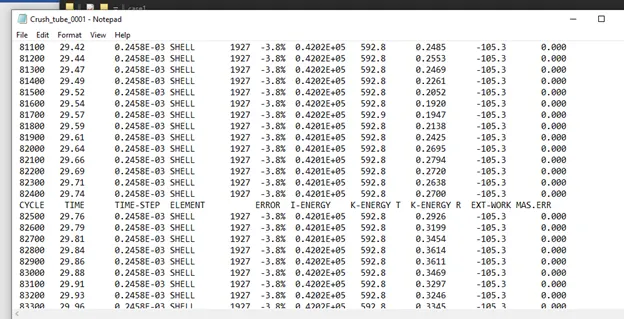
- An energy error of -3.8% is considered good for further calculations.
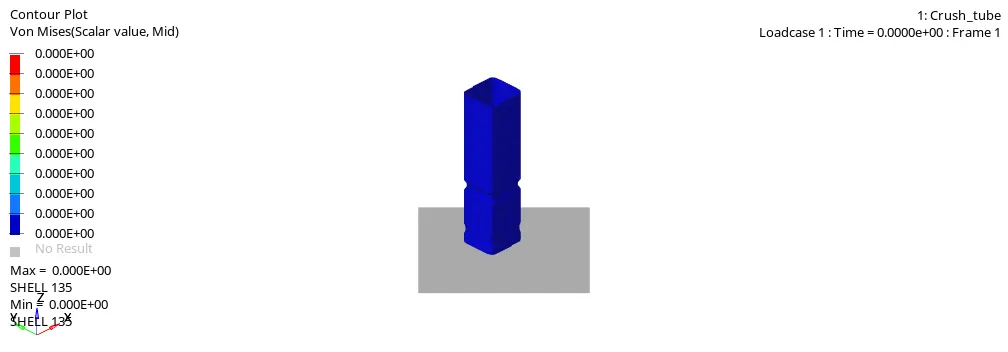
- It can be observed that deformation occurs in the notched region first
- This is due to the higher stress concentration present in notched areas
- This is then followed by deformation in the bottom area ,due to lesser thickness. and finally the top region
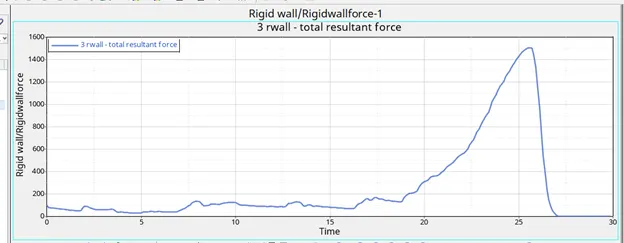
- The rigid wall graph increases steadily during the initial velocity given.
- It peaks around 1300.
- When the tube collides with the wall, the contact energy increases,resulting in the increase of rigid wall forces
- This spike can be seen starting from around 20 ms
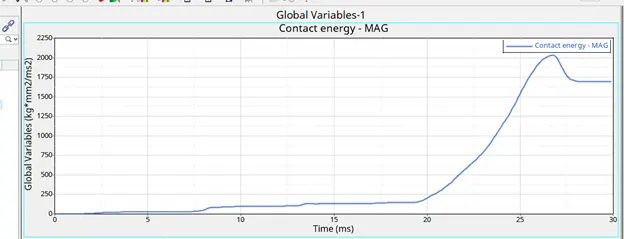
- The contact energy starts from 0 as there is no contact between the elements
- The fluctuation of the curve in the beginning suggests fluctuation of contact between elements
- The peak can be seen to start from around 20 ms,this indicates that collision has taken place and more elements are in contact with each other
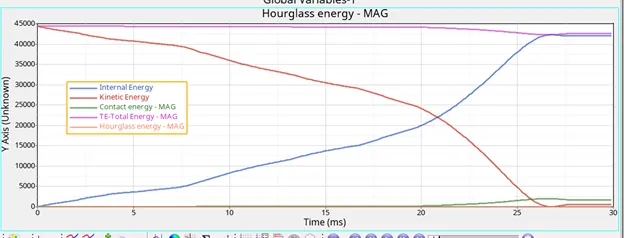
- The energy graphs plotted are Internal Energy,Kinetic Energy,contact energy,total energy and hourglass energy
- Hourglass energy is non existed due to the use of Qeph elements
- The internal energy starts from 0 and increases steadily as the simulation time progresses.The peak value is obtained at the end of collision
- The kinetic energy decreases steadily and reaches 0 at the end of collision.
- The total energy remains constant with a small dip at the end.This can be attributed to energy loss error due to the resistive forces between master and slave segments
- The constant nature of Total energy and the dip of Kinetic energy suggest that kinetic energy is converted into internal energy during the simulation.
Case 2:Change inacti to 6
- On changing inacti to 6, the gap between the master and slave will vary after initial penetration
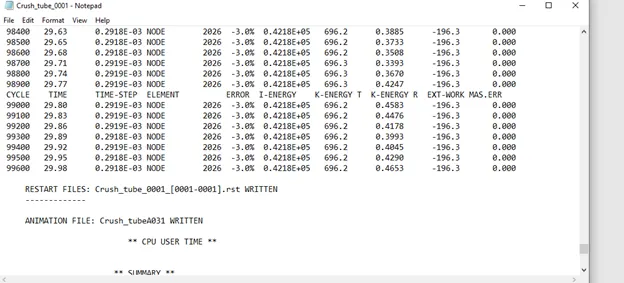
- On reading the 0001.out file,the energy error is -3 %
- This is considered to be good for further calculations and simulations.
- There is no discernible difference in the animation of case 1 and case 2.
- The rigid wall graph increases steadily during the initial velocity given.
- The value peaks at around 1500 compared to the 1300 in case 1
- When the tube collides with the wall, the contact energy increases,resulting in the increase of rigid wall forces
- It is similar to case 1 outside of peak value of forces.
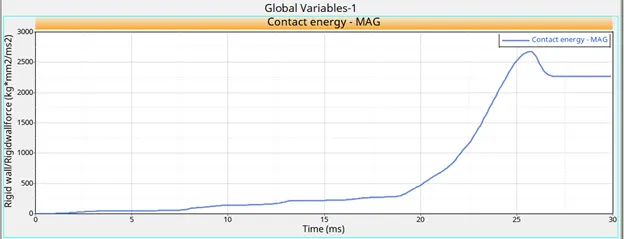
- The contact energy starts from 0 as there is no contact between the elements
- The fluctuation of the curve in the beginning suggests fluctuation of contact between elements
- The peak can be seen to start from around 20 ms,this indicates that collision has taken place and more elements are in contact with each other
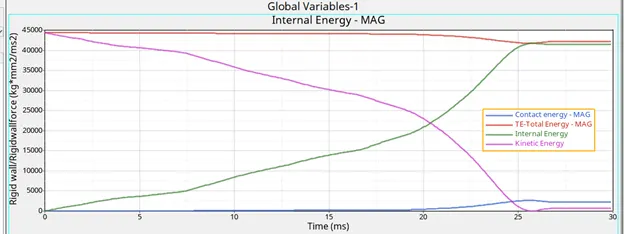
- The energy graphs plotted are Internal Energy,Kinetic Energy,contact energy, and total energy
- The internal energy starts from 0 and increases steadily as the simulation time progresses.The peak value is obtained at the end of collision
- The kinetic energy decreases steadily and reaches 0 at the end of collision.
- The total energy remains constant with a small dip at the end.This can be attributed to energy loss error due to the resistive forces between master and slave segments
- The constant nature of Total energy and the dip of Kinetic energy suggest that kinetic energy is converted into internal energy during the simulation.
Case 3-Type 11 contact
- In case 3,a type 11 contact is created to go along with the type 7 contact group

- A energy error of -3% is considered good for further analysis
- Similar to the previous cases there is no obvious difference in the animation of the model
- This suggests that there is no significant edge to edge contact in the model
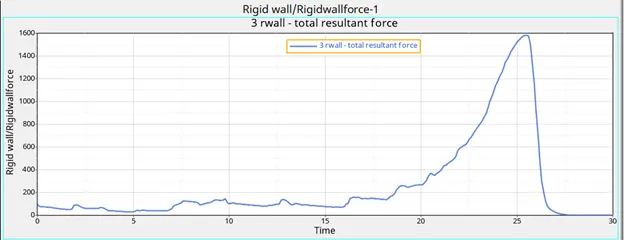
- Unlike in the previous case, the resultant force peaks at 1600.This can be attributed to the fact that the type 11 interface adds edge to edge contact in addition to the other contacts.
- This results in more contact energy as well as more rigid wall forces
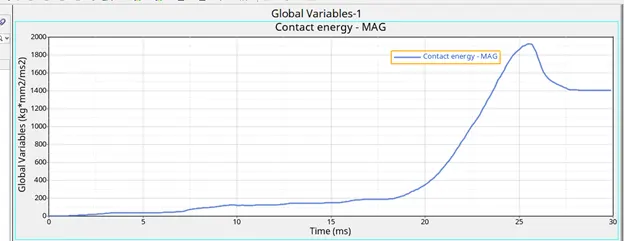
- The contact energy starts from 0 as there is no contact between the elements
- The fluctuation of the curve in the beginning suggests fluctuation of contact between elements
- The peak can be seen to start from around 20 ms,this indicates that collision has taken place and more elements are in contact with each other
- It decreases a little after the peak signifying expansion of the model after collision.
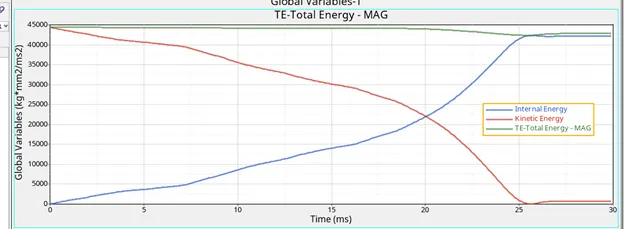
- The energy graphs plotted are Internal Energy,Kinetic Energy,contact energy, and total energy
- The internal energy starts from 0 and increases steadily as the simulation time progresses.The peak value is obtained at the end of collision
- The kinetic energy decreases steadily and reaches 0 at the end of collision.
- The total energy remains constant with a small dip at the end.This can be attributed to energy loss error due to the resistive forces between master and slave segments
- The constant nature of Total energy and the dip of Kinetic energy suggest that kinetic energy is converted into internal energy during the simulation.
Case 4:Remove notches and boundary condition
- In case 4,the notches present on the model have been removed.
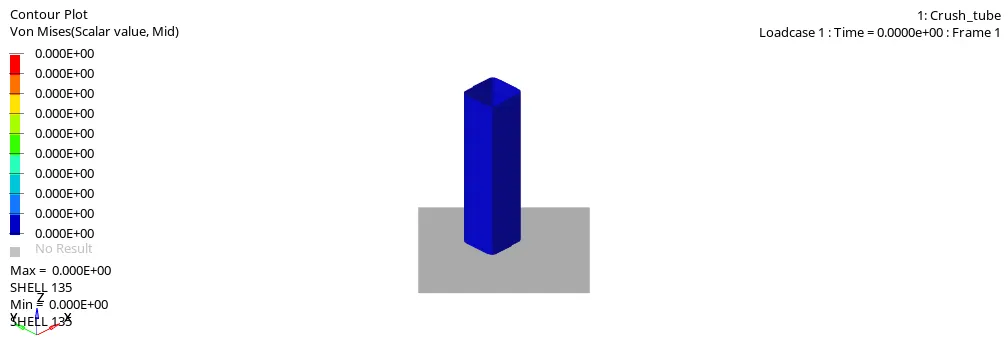
- In this case, unlike the other cases it can be seen that deformation occurs from the bottom of the tube
- This can be attributed to the absence of notches in the model
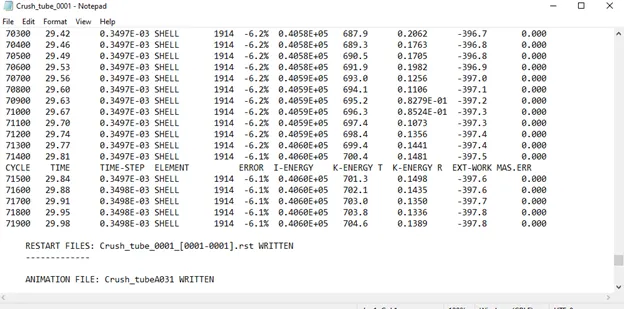
- An energy error of -6.1% is considered acceptable for further calculations
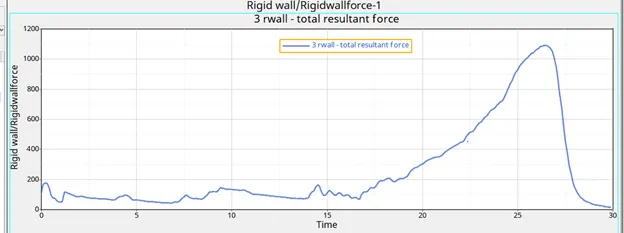
- It can be observed that the rigid wall forces are significantly lower as compared to the previous cases
- This significant dip can be attributed to the removal of notches on the model.This leads to lower stress concentrations
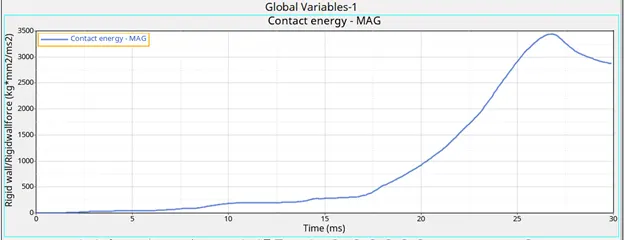
- The contact energy starts from 0 as there is no contact between the elements
- The peak can be seen from around 27 ms,this indicates that collision has taken place and more elements are in contact with each other
- It decreases a little after the peak signifying expansion of the model after collision.
- The contact energy peaks much higher compared to other cases
- This is due to the fact that since more elements are in contact with each other,a higher amount of energy is needed to resist penetrations.
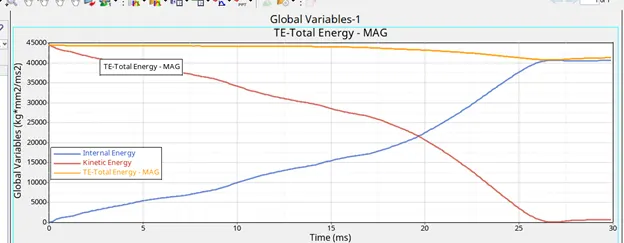
- The energy graphs plotted are Internal Energy,Kinetic Energy,contact energy, and total energy
- The internal energy starts from 0 and increases steadily as the simulation time progresses.The peak value is obtained at the end of collision
- The kinetic energy decreases steadily and reaches 0 at the end of collision.
- The total energy remains constant with a small dip at the end.This can be attributed to energy loss error due to the resistive forces between master and slave segments
- The constant nature of Total energy and the dip of Kinetic energy suggest that kinetic energy is converted into internal energy during the simulation.
Case 5:Notch at middle
- In this case,a notch is created in the middle of the model.
- It can be observed that deformation takes place in the notched area first
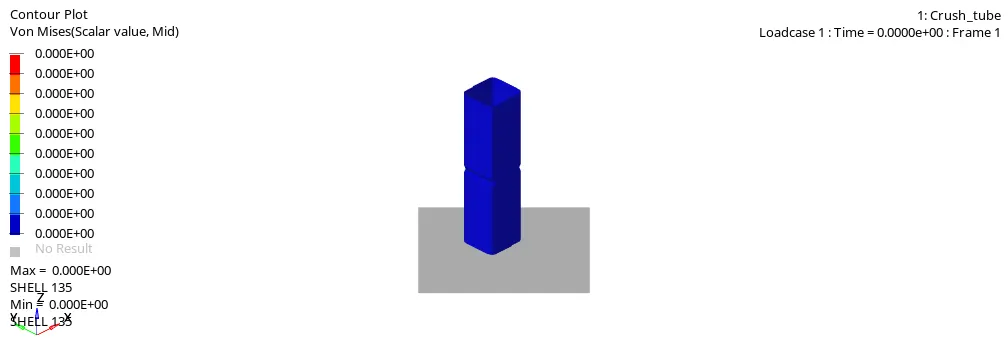
- After that,the lower region undergoes deformation followed by a very fast deformation of the upper region
- Note:since the notch is created manually,there may be anomalies.
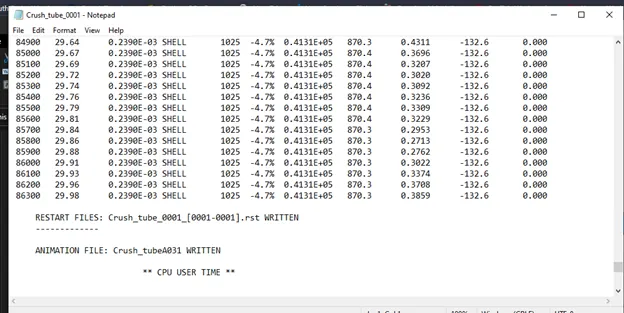
- An energy error of -4.7% is considered good for further calculations
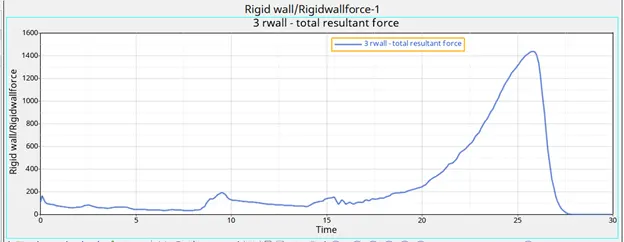
- The rigid wall forces peak around 1400,similar to the 2nd case
- The rigid wall graph increases steadily during the initial velocity given.
- When the tube collides with the wall, the contact energy increases,resulting in the increase of rigid wall forces
- This spike can be from around 27 ms
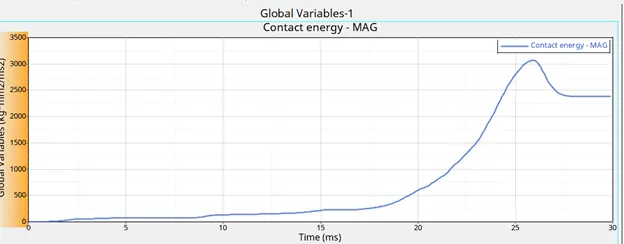
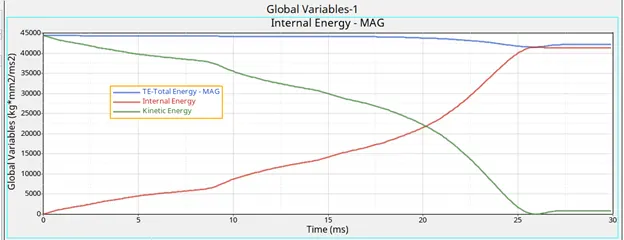
- The energy graphs plotted are Internal Energy,Kinetic Energy,contact energy, and total energy
- The internal energy starts from 0 and increases steadily as the simulation time progresses.The peak value is obtained at the end of collision
- The kinetic energy decreases steadily and reaches 0 at the end of collision.
- The total energy remains constant with a small dip at the end.This can be attributed to energy loss error due to the resistive forces between master and slave segments
- The constant nature of Total energy and the dip of Kinetic energy suggest that kinetic energy is converted into internal energy during the simulation.
- The internal energy decreases a little since the model moves back after hitting the rigid wall and increases again because the model hits with elements after the notch
Case 6:Notch on opposing faces
- In this case,the notch is creating only on 2 opposing faces.
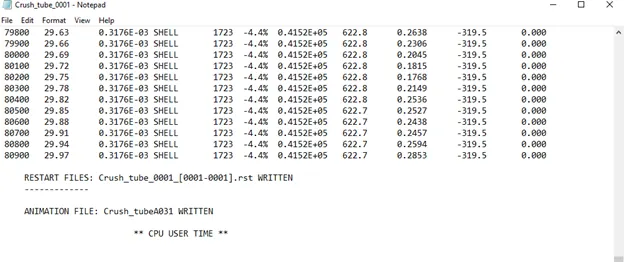
- An energy error % of -4.4 is good for further analysis.
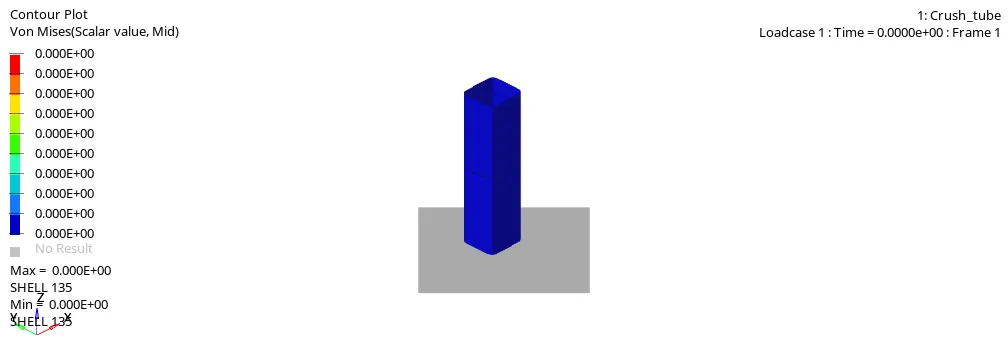
- The deformation occurs at the notched location due to high stress concentrations.
- After deformation of the notch,the next region to deform is the bottom layer due to lesser thickness.
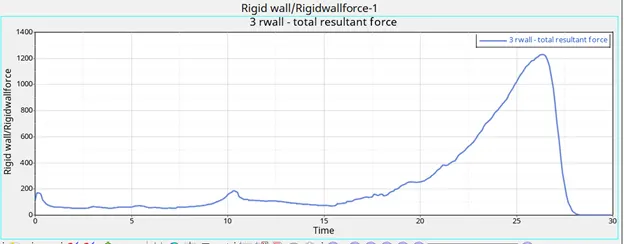
- The peak of the rigid wall force is the point at which complete deformation has taken place and the rigid wall has to react to all the forces due to the impact motion of the rigid body
- The dip after signifies loss of contact with the rigid wall
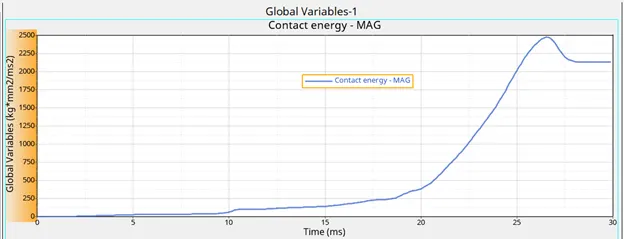
- The contact energy peaks at around 27 ms,signifying the point at which complete deformation takes place.
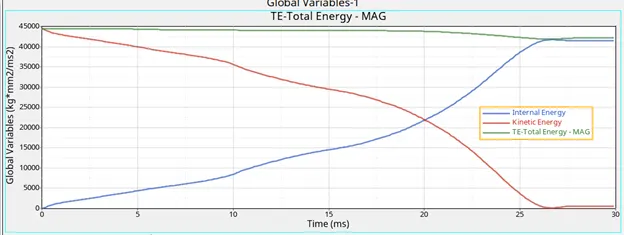
- The energy graphs plotted are Internal Energy,Kinetic Energy,contact energy, and total energy
- The internal energy starts from 0 and increases steadily as the simulation time progresses.The peak value is obtained at the end of collision
- The kinetic energy decreases steadily and reaches 0 at the end of collision.
- The total energy remains constant with a small dip at the end.This can be attributed to energy loss error due to the resistive forces between master and slave segaments
- The constant nature of Total energy and the dip of Kinetic energy suggest that kinetic energy is converted into internal energy during the simulation.
Conclusion
- Notches are regions where deformation occurs first due to them being areas of high stress concentration.But it does help to predict and control areas of deformation.This is extremely important for automobile applications to ensure safety of the passenger.
- This also affects how absorbed energy is spread throughout the tube
- A notched tube results in higher contact forces but smoother transmission of load
- Different types of contacts were used and simulated under constant load.The results were then compared with each other.
- The effect of notches on deformation and load transmission were also observed.