Assignment 5-RADIOSS Interfaces & Study of Effect of Notches Challenge
Aim: To mesh the bumper component using hypermesh and also run the simulation on crush tube by using RADIOSS.
OBJECTIVE:
- To perform mesh operation on bumper component as per quality criteria.
- To run the crush tube model as it is with default failure parameters.
- To run the model by changing the parameter Inacti=6.
- To run the model by creating type 11 contact parameters.
- To run the model by removing both notches and boundary conditions on rigid body node.
- To run the model by creating new notch at middle and boundary conditions on rigid body node.
- To create a new notch with nodes only from opposing two faces and run.
PROCEDURE:
- To perform mesh operation on bumper component as per quality criteria.
Open the hyperwork software, and then we have to set user profile interface i.e. Optistruct or RADIOSS. Optistruct is implicit solver which handles small deformations. And RADIOSS is explicit solver which handles large deformation. So we will use RADIOSS as user interface.
First we have to import the required file, which is in .hm format. So to import the .hm file format model in hyperworks, we have to follow:
File--->Import---->Model---->select file--->Import.
Once model is opened, it will look like as shown picture in below.
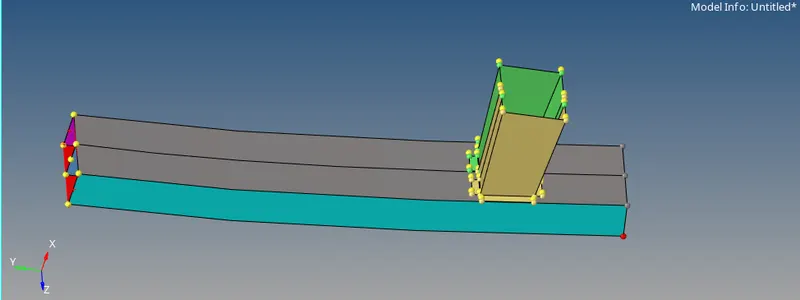
Now we have to remove all unwanted temporary node by following.
Geom--->Temp nodes ----> select nodes--->clear all.
Once all unwanted temporary nodes are clear, model will look like as shown in picture below.
Now we will switch the geometry color mode from “auto mode” to “By Topo”. Once mode is changed model will look like as shown in picture below.
Once Bumper system model is selected to make it visible in hyperworks window. It will show the solid component. And we have need for surface only. From which we will extract mid surface. So, we have to delete the solid by using delete option. In order to use delete option. Under collectors select delete then select solid as displayed and then have to select delete entity. Once solid is deleted, we will only have surface. And the model will look like as shown in picture below.
By default, “auto mode” is selected in “geometry color mode”. If auto mode is on we cannot check the free edges, CONS, suppressed edges and sharp edges etc. which are the main criteria for geometry check.
Now we will switch the geometry color mode from “auto mode” to “By Topo”. Once mode is changed model will look like as shown in picture below.
below.
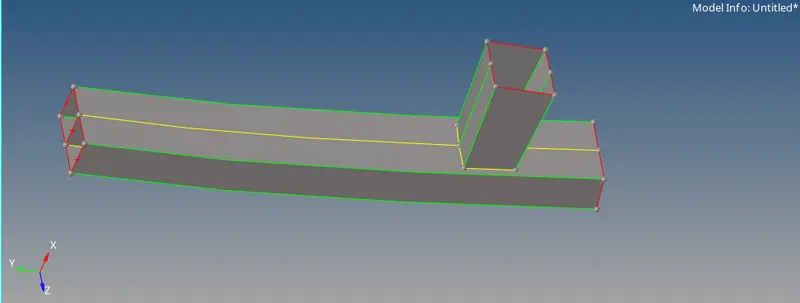
Free edges are shown in red color. In this surface edge is not connected to any other surface edge.
Shared edges are shown in green color. This is the boundary between two connected surfaces.
Suppressed edges are shown in blue color.
Geometry cleanup:
In Practice model we have edges dis-connectivity. Which means these edges have no shared edges and are acting like a free edge as shown in picture above.
In order to resolve these issues, we can perform toggle function under edge edit in geometry module by increasing the tolerance value. If this operation will not work, then we can perform either autocleanup and manually cleanup.
To perform geometry cleanup operation, we will use autocleanup panel. Cleanup operations include the equivalencing of "red" free edges, fixing of small surfaces (relative to the element size), and detection of features such as beads. It also performs specified surface editing/defeaturing operations like the removal of pinholes (less than specified size), removal of edge fillets, and the addition of a layer of washer elements around holes.
To perform this operation, we have to follow:
Geometry---->autocleanup---->select surface: all---->autocleanup
In order to resolve those errors which are not auto detected, we have to manually perform spline / filler, ruled options to repair geometrical errors by following
Geom---->Surfaces---->select spline/filler or ruled.
Spline/filler subpanel option helps to create surfaces by filling in gaps, such as a hole in existing surface. And ruled subpanel option helps to create surfaces by interpolating linearly between lines or nodes.
Once geometrical errors are resolved model will look like as shown in picture below.
As we will perform defeaturing, which will help us to provide good meshing flow by eliminating unnecessary CONS on flat surfaces. To suppress these unnecessary CONS we have to perform toggle function by following
Geom---->edge edit---->toggle.
Once geometry cleanup and toggle operation is done, model will look like as shown in picture below.
Quality criteria parameters
QUALITY INDEX
Discretization of component:
A mesh is a network that is formed of cells and points. A meshing is the process of subdividing the structure from infinite number of points to the finite number of node and elements. This process is also known as discretization.
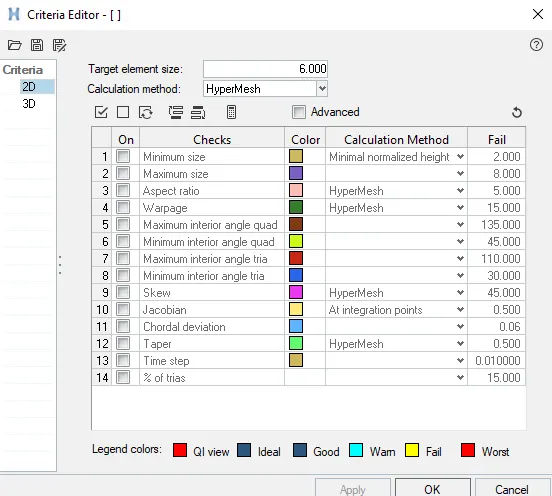
And we have to maintain the distance between two nodes equal to the average target length i.e. 6mm. This can be done by following certain steps i.e.
2D---->automesh---->select surface---->element size---->mesh type: mixed---->mesh.
In order to fix quality meshing we will use some of useful function such as remesh, rebuild mesh, smooth, split elements, align nodes, replace nodes etc.
We will also use normal panel which is under tool. Normal panels help to display and reverse the normal of elements or surfaces.
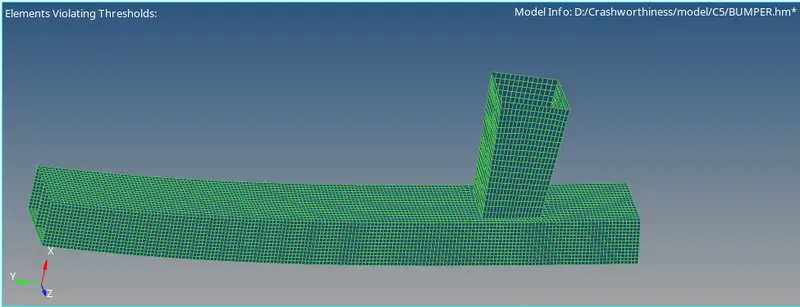
Once discretization is done model will look like as shown in picture below:
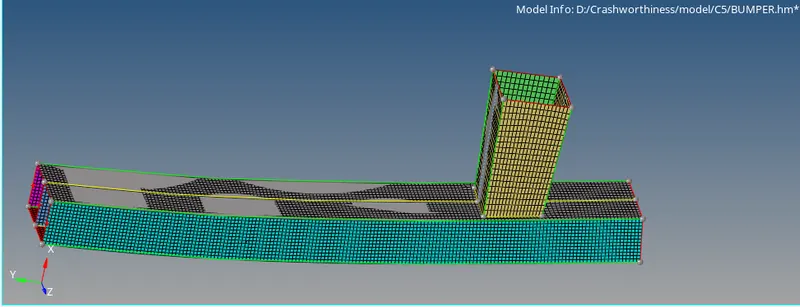
Now we need to verify the connectivity between the nodes throughout. To verify and correct connectivity we will use equivalence by following certain steps.
Tool---->edges---->select element---->preview equivalence---->equivalence.
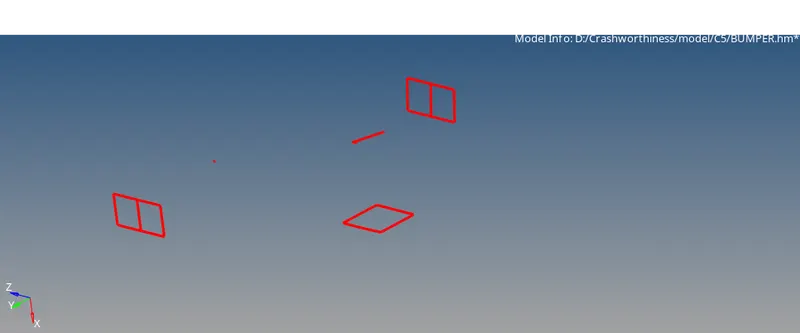
we can also increase the tolerance value if the nodes are not getting highlighted.
1. To run the crush tube model as it is.
Open the hyperworks software, and then we have to set user profile interface i.e. Optistruct or RADIOSS. Optistruct is implicit solver which handles small deformations. And RADIOSS is explicit solver which handles large deformation. So we will use RADIOSS as user interface.
First we have to import the required file i.e. Crush_tube_0000.
File--->Import---->Solver Deck---->File: select file--->Import.
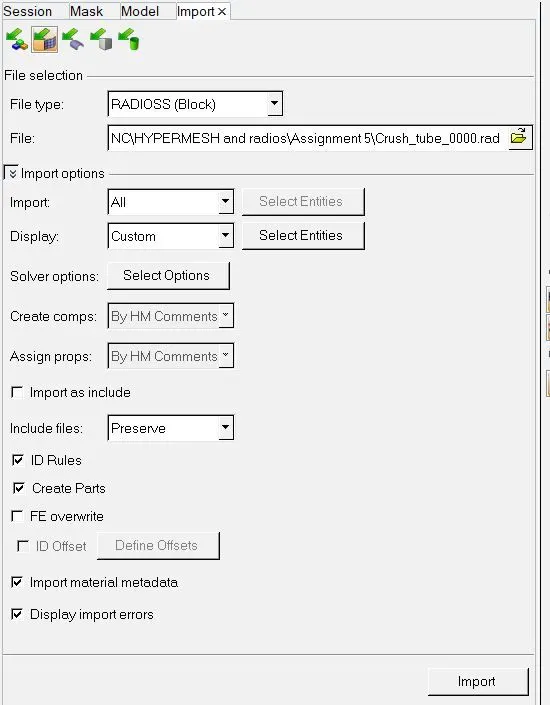
Once file is imported, model will look like as shown in picture below.
Once file is imported, model will look like as shown in picture below.
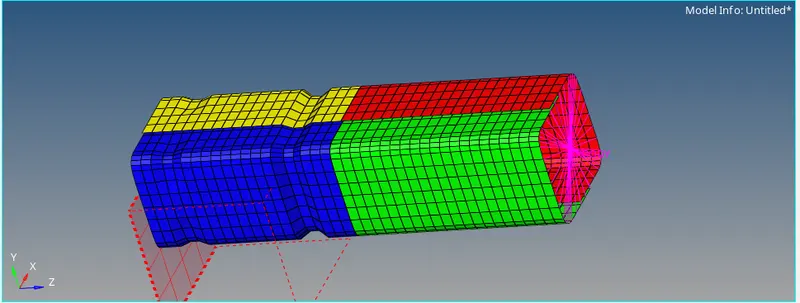
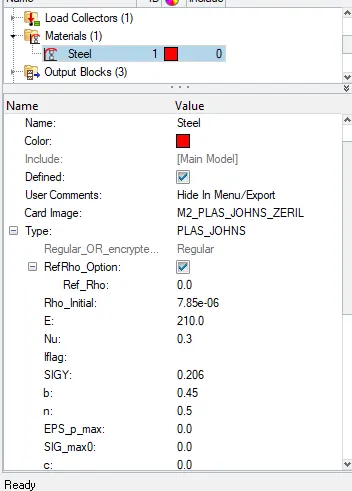
As per requirement for this case, we have to run the simulation for this model with default failure parameters. So, in failure card we have default values in card setting as shown in picture below.
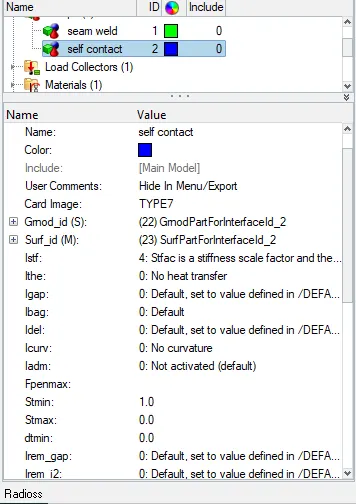
By default, TYPE7 Interface /contact modeling has been assigned. TYPE7 supports variable stiffness with node to surface contact.
Igap determines how the size of gap is calculated. Here defaults value for Igap=0, which means gap will be constant for all the contacts. This gap is defined by Gapmin.
Gapmin defines the minimum gap for the activation of interface. Gapmin>=0.5mm specify minimum thickness of the model to avoid numerical issues. Typically, half of the thickness part.
Inacti specify action to take if initial penetration exist. The initial penetration should be smaller than 30% of the initial gap to avoid contact stability issues.
Idel specifies what to do with slave nodes and master segments if element fails or deleted that with they are attached to.
Now we can check the animation by run the simulation with default properties by following:
Analysis---->Radioss
Now we have to give location to export the input file:
Options helps to choose number of cores to solve this problem, here we have chosen 4 number of cores by (-nt 4).
Then click on Radioss, and new window will get pop-up. A simulation will start to show result,
After run the simulation on model, solver has generated different files such as engine listing file, animation, time history and then restart file.
Now, in order to check the energy error and mass error. We have to open the output file in notepad.
Once output file is opened, we can see the results.
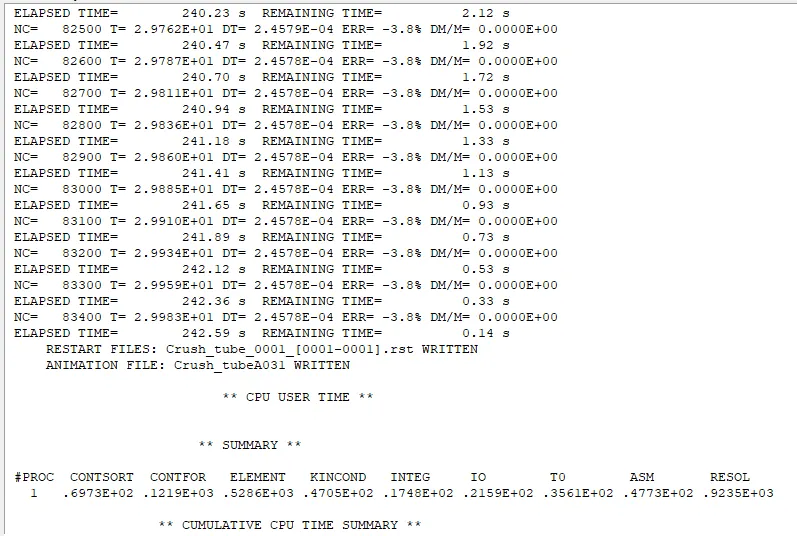
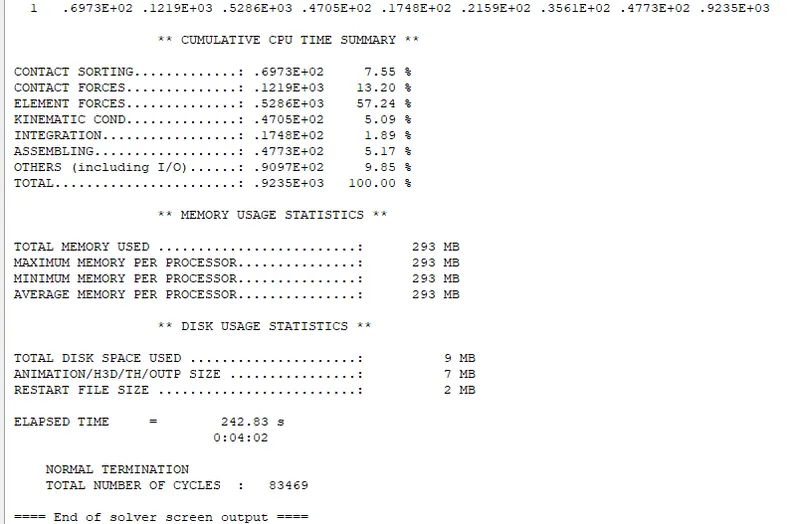
At the end of simulation, we have found maximum energy error is having value of -3.8% and maximum mass error is having value of 0.
If the energy error lies in between range of value -15 to 5%, then results will be acceptable. Also, mass error in between ranges of 0 to 2% are acceptable. If energy error is below the range, then results could be acceptable. Here we have -3.8% energy error, which is acceptable. Closer to 0%. And a mass error is coming closer to zero, which is also acceptable.
Now we have to switch from Hypermesh mode to Hyperview mode. Then we have to select the appropriated (.h3D) file. And then we have to click on Apply to view the results.
By using different animation controls, we can check and animate the results as shown in picture below.

Contour plot for Von Mises stress
Maximum stress reached upto 0.69 MPa over the period of time.
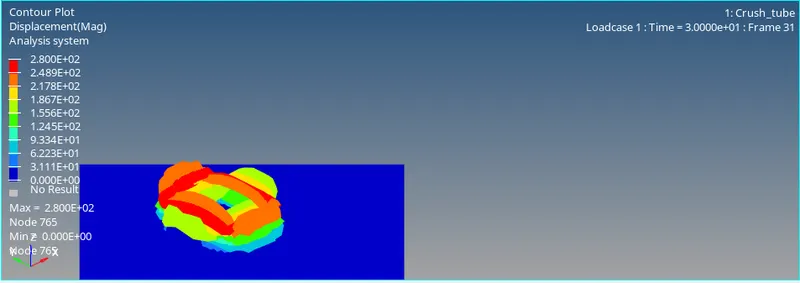
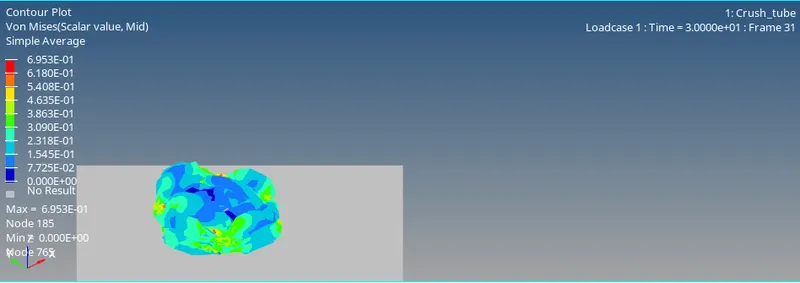
From above animation we can observe that deformation starts from notch region first and then over the period of time stress starts propagated from middle notch region to bottom of crush tube.
Now we have to switch from HyperView mode to HyperGraph 2D mode.
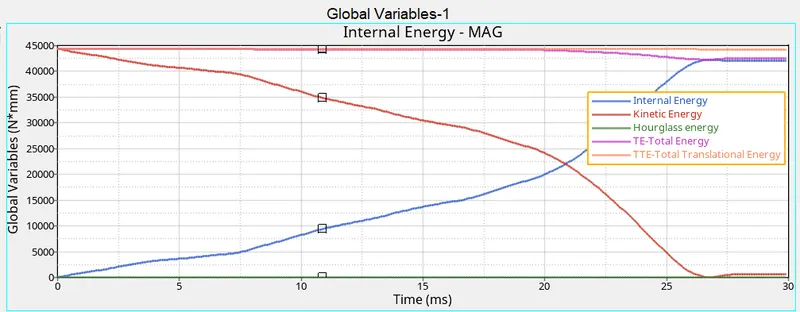
As we can see, from below graph that kinetic energy is decreasing from starting time to termination time. Because a displacement rate is reduced over a period of time. So, kinetic energy is reducing respectively.
As we know internal energy, there is no heat transfer in the system. So we only have to consider work done for calculating the internal energy. Work done is the product of force and displacement. Since a displacement is increasing over a period of time, work done will also increasing. As a result of which internal energy will also increase.
As we know total energy is the combination of internal, kinetic energy which has been plotted below.
Once all parameters are filled, we have a required graph as shown in picture below.
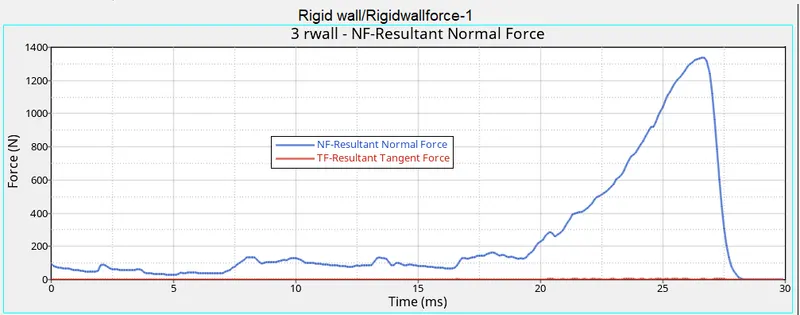
Now we have to plot the total resultant force graph. Once all parameters are filled, we have a required graph as shown in picture below.
Initially rigid wall force starts from lower value because initially there is no contact between crush tube and rigid wall. And then graph goes on increasing because elements are getting deformed and once rigid wall force reached at peak. Then entire crush tube collides with rigid wall.
Then decrease in plot indicates entire component is at rest after Collison over a period of time.
2. To run the model by changing the parameter Inacti=6.
For this case we have to import the required file i.e. Crush_tube_0000.
In this case we have to edit some parameters, such as Inacti=6.
Inacti=6 removes initial penetrations where possible. Elsewhere, reduce initial penetration to less than 30% of the defined gap value and adjust the gap.
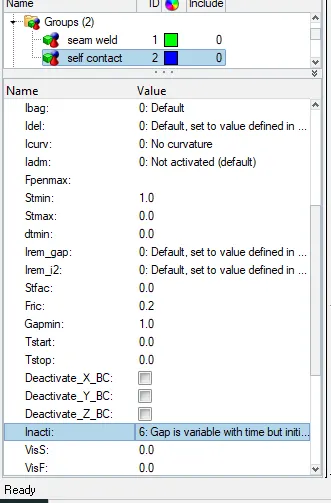
Now in order to run simulation, we have to follow same procedure as explained earlier.
Once simulation is done, solve will generate different files. Now, in order to check the energy error and mass error. We have to open the output file in notepad.
Once output file is opened, we can see the results.
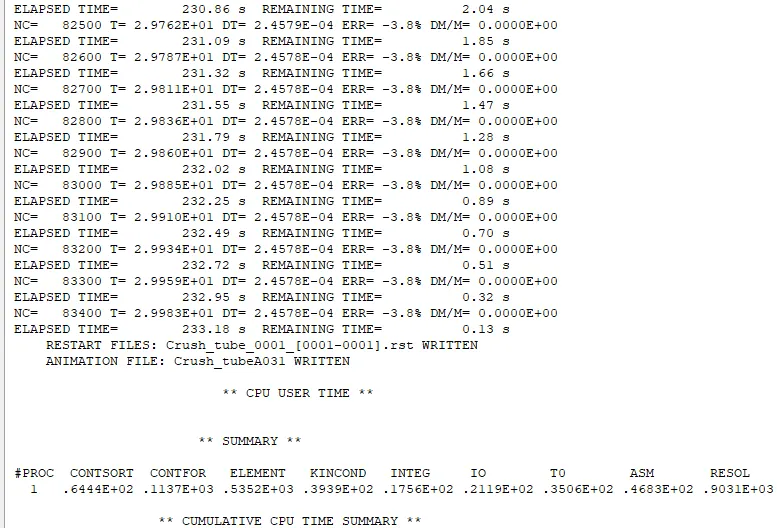
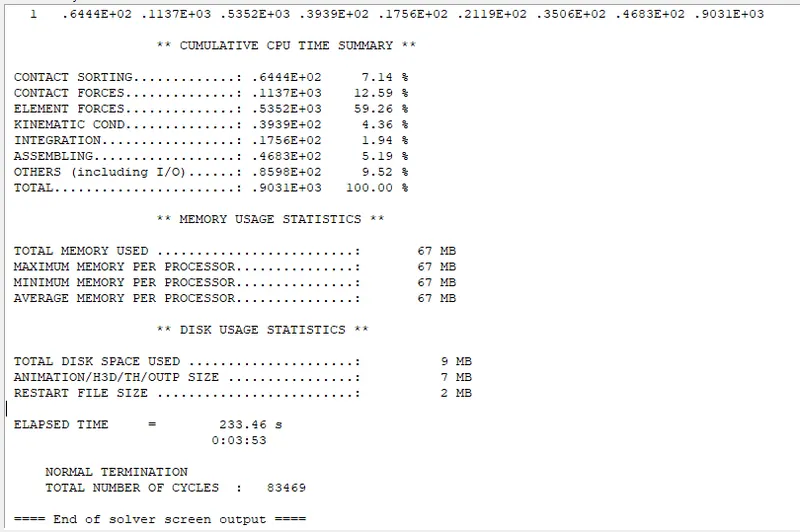
So, maximum energy error is -3.8% and mass error is 0. And both are in acceptable range.
Now we have to switch from Hypermesh mode to Hyperview mode. Then we have to select the appropriated (.h3D) file. And then we have to click on Apply to view the results.
By using different animation controls, we can check and animate the results as shown in picture below.
Contour plot for Von Mises stress
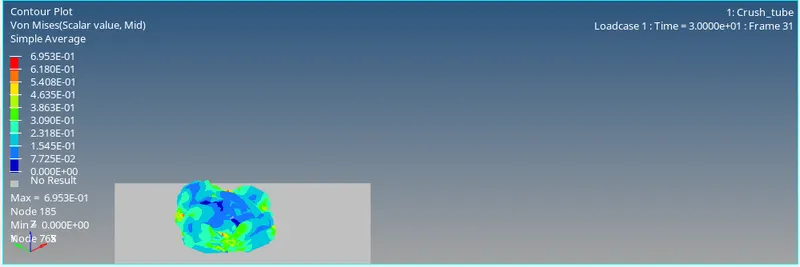
Maximum stress reached up to 0.7 MPa over the period of time. And from animation we can observe same deformation pattern as we noticed in earlier case.
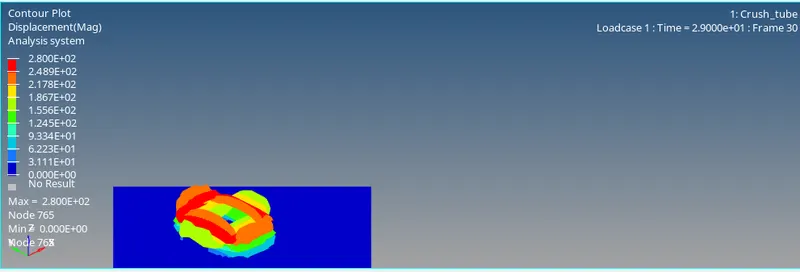
Now we have to switch from HyperView mode to HyperGraph 2D mode.
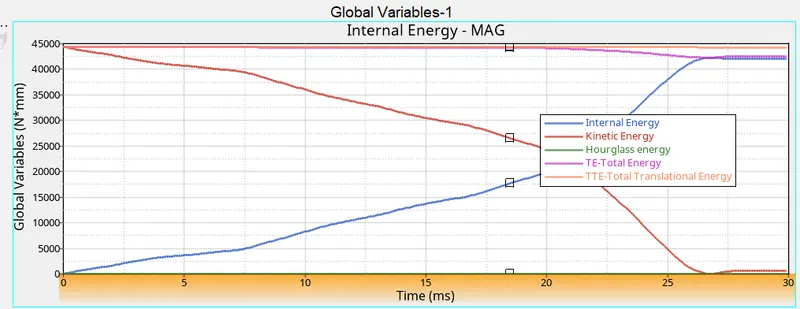
In this case, internal energy shows higher peak value compared to previous case.
An initial velocity is high, so kinetic energy is also high. Over the period of time velocity decreasing. Once crushing is done there is no velocity and graph maintained at approximation constant lower value, which has been plotted below.
Now we have to plot the total resultant force graph. Once all parameters are filled, we have a required graph as shown in picture below.
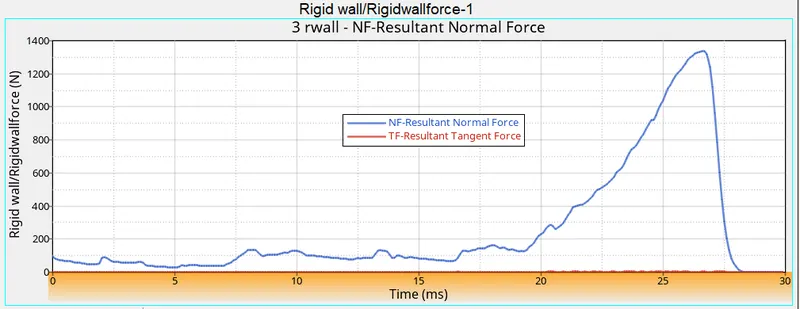
Initially rigid wall force starts from lower value because initially there is no contact between crush tube and rigid wall. And then graph goes on increasing because elements are getting deformed and once rigid wall force reached at peak. Then entire crush tube collides with rigid wall.
Then decrease in plot indicates entire component is at rest after Collison over a period of time.
- To run the model by creating type 11 contact parameters.
For this case we have to import the required file i.e. Crush_tube_0000.
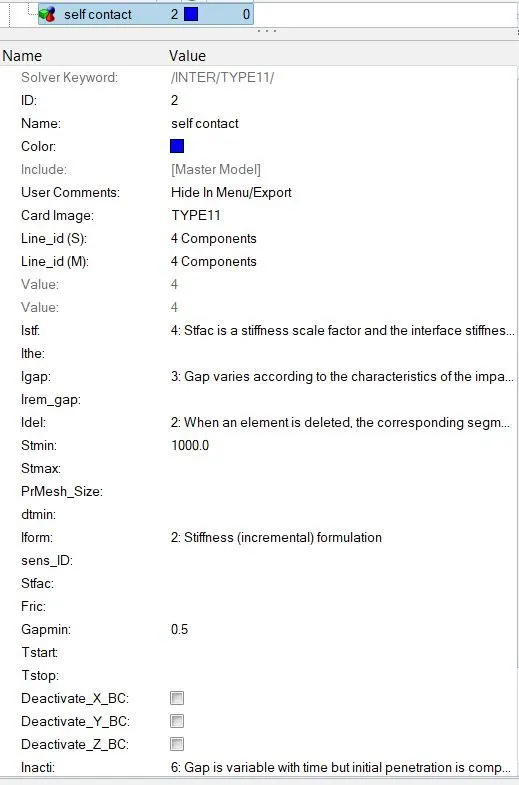
In this case we have to edit card image parameter from TYPE7 to TYPE11.
Interface / contact TYPE11 parameter is having variable thickness and possess edge to edge contact
TYPE11 is defined by identifying master and slave lines i.e. edges.
Stmin = 1000N/mm specifies a minimum stiffness in the contact to avoid soft contact.
Now in order to run simulation, we have to follow same procedure as explained earlier.
Once simulation is done, solve will generate different files. Now, in order to check the energy error and mass error. We have to open the output file in notepad.
Once output file is opened, we can see the results.
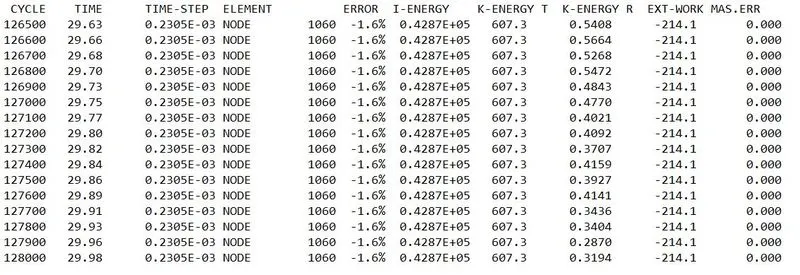
So, maximum energy error is -1.6% and mass error is 0. And both are in acceptable range.
Now we have to switch from Hypermesh mode to Hyperview mode. Then we have to select the appropriated (.h3D) file. And then we have to click on Apply to view the results.
By using different animation controls, we can check and animate the results as shown in picture below.
Contour plot for Von Mises stress
Maximum stress reached up to 0.64 MPa over the period of time. And from animation we can observe same deformation pattern as we noticed in earlier case.
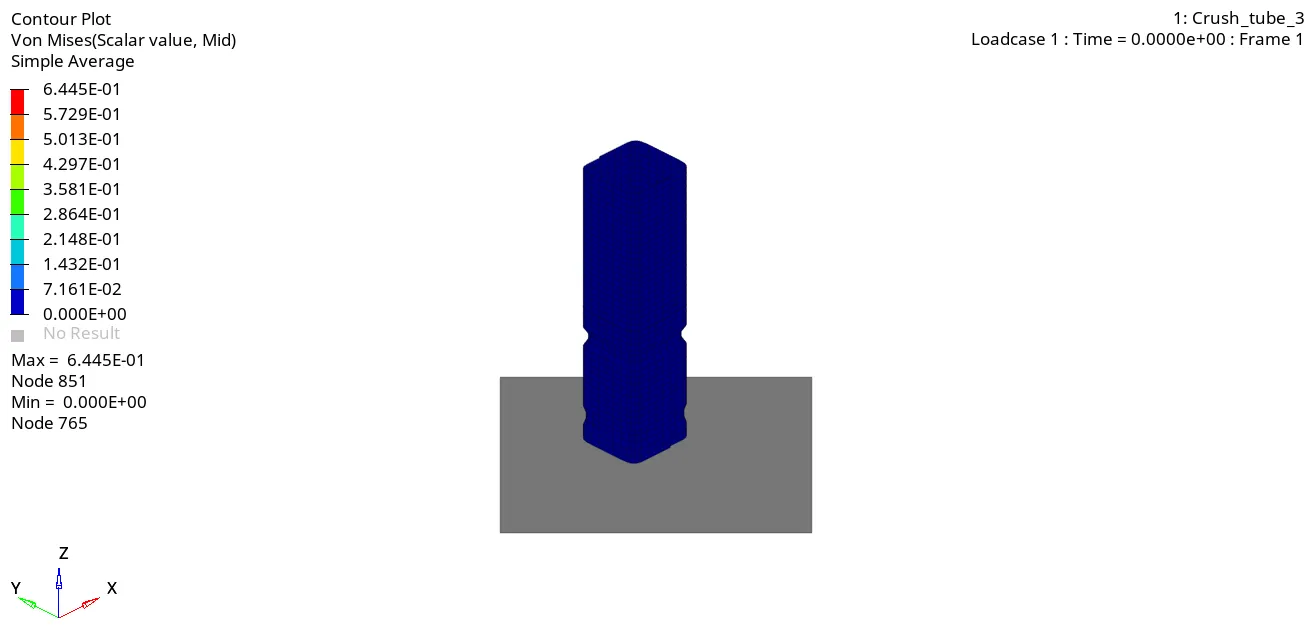
Now we have to switch from HyperView mode to HyperGraph 2D mode.
In this case, internal energy shows higher peak value compared to previous case.
An initial velocity is high, so kinetic energy is also high. Over the period of time velocity decreasing. Once crushing is done there is no velocity and graph maintained at approximation constant lower value, which has been plotted below.
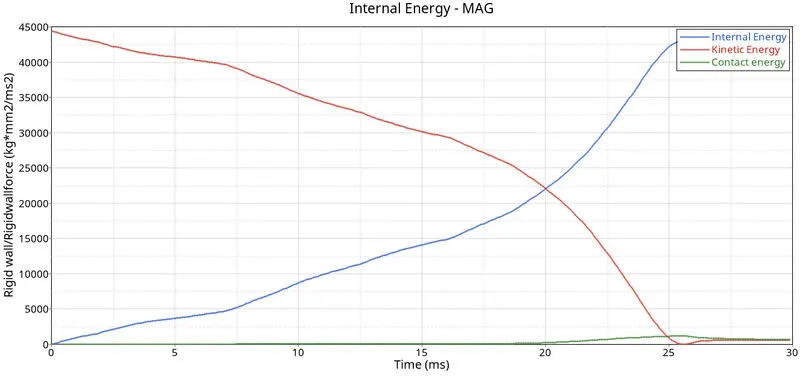
Now we have to plot the total resultant force graph. Once all parameters are filled, we have a required graph as shown in picture below.
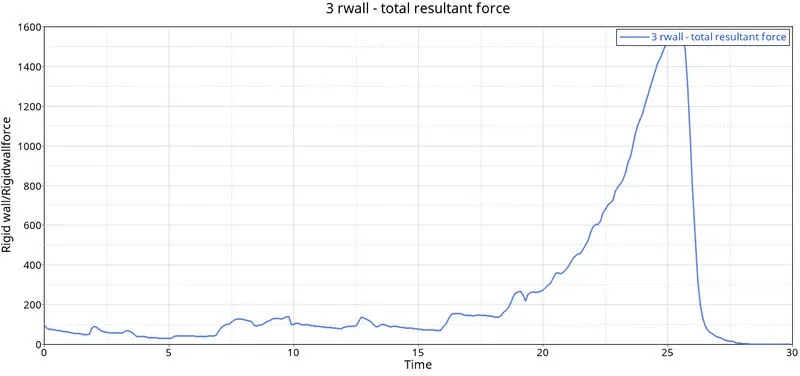
Initially rigid wall force starts from lower value because initially there is no contact between crush tube and rigid wall. And then graph goes on increasing up to 1600 N because elements are getting deformed and once rigid wall force reached at peak. This peak value is high from previous two cases. Then entire crush tube collides with rigid wall.
Then decrease in plot indicates entire component is at rest after Collison over a period of time.
- To run the model by removing both notches and boundary conditions on rigid body node.
For this case we have to import the required file i.e. Crush_tube_0000.
In this case we have remove both the notches and boundary conditions on rigid body node.
To remove notches, we will follow steps as shown in picture below.
Geom---->node edit---->align node---->select 1ST and 2nd (parallel node) ---->select nodes (which needs to modify)
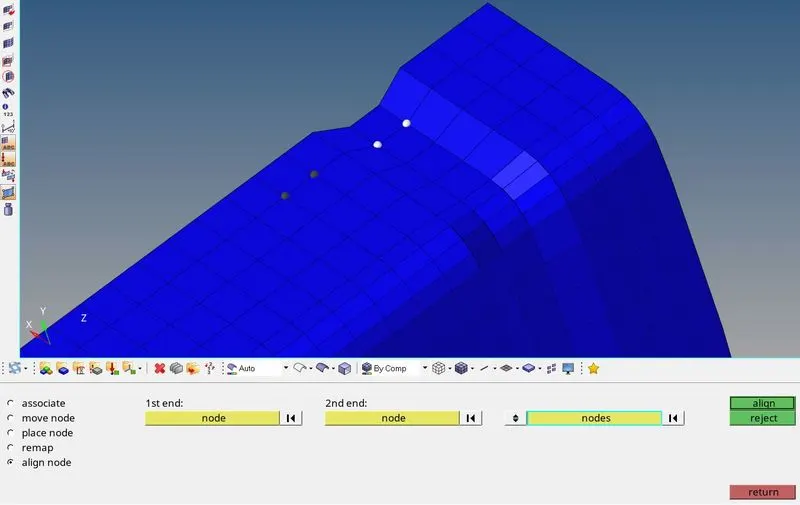
So, we will follow similar steps for both the notches. Once both notches are removed, model will look like as shown in picture below.
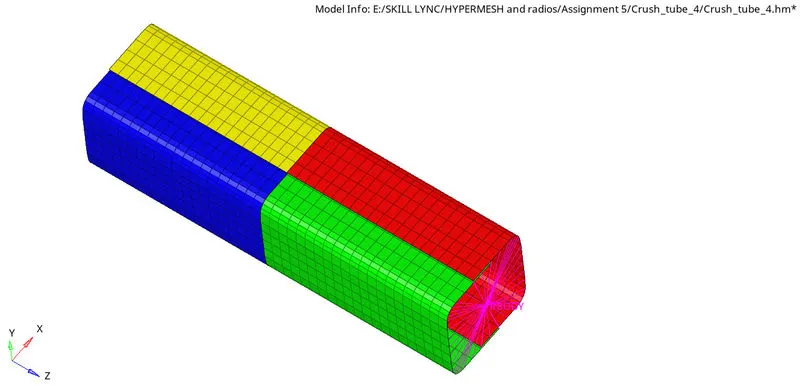
Next step is to remove the boundary conditions from solver browser. In order to remove boundary conditions, we have to follow steps explained in picture below.
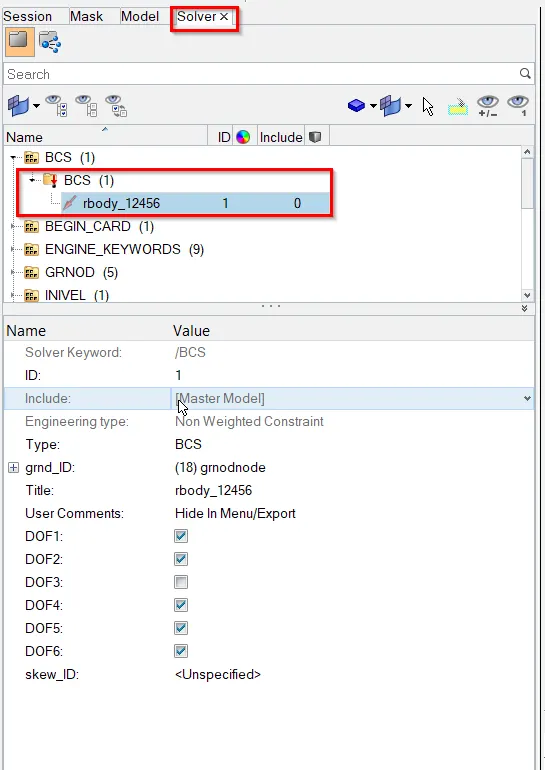
Now in order to run simulation, we have to follow same procedure as explained earlier.
Once simulation is done, solver will generate different files. Now, in order to check the energy error and mass error. We have to open the output file in notepad.
Once output file is opened, we can see the results.
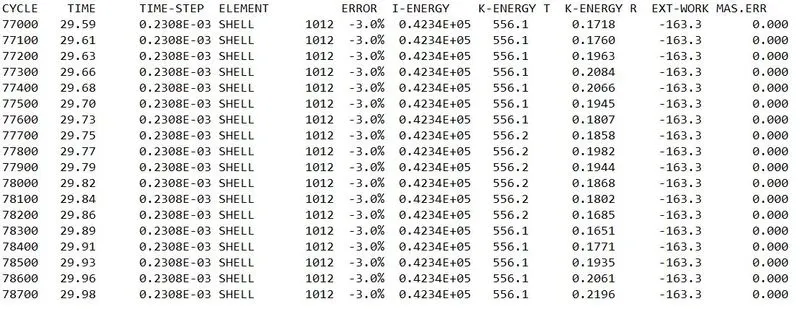
So, maximum energy error is -3.0% and mass error is 0. And both are in acceptable range.
Now we have to switch from Hypermesh mode to Hyperview mode. Then we have to select the appropriated (.h3D) file. And then we have to click on Apply to view the results.
By using different animation controls, we can check and animate the results as shown in picture below.
Contour plot for Von Mises stress
Maximum stress reached up to 0.66 MPa over the period of time.
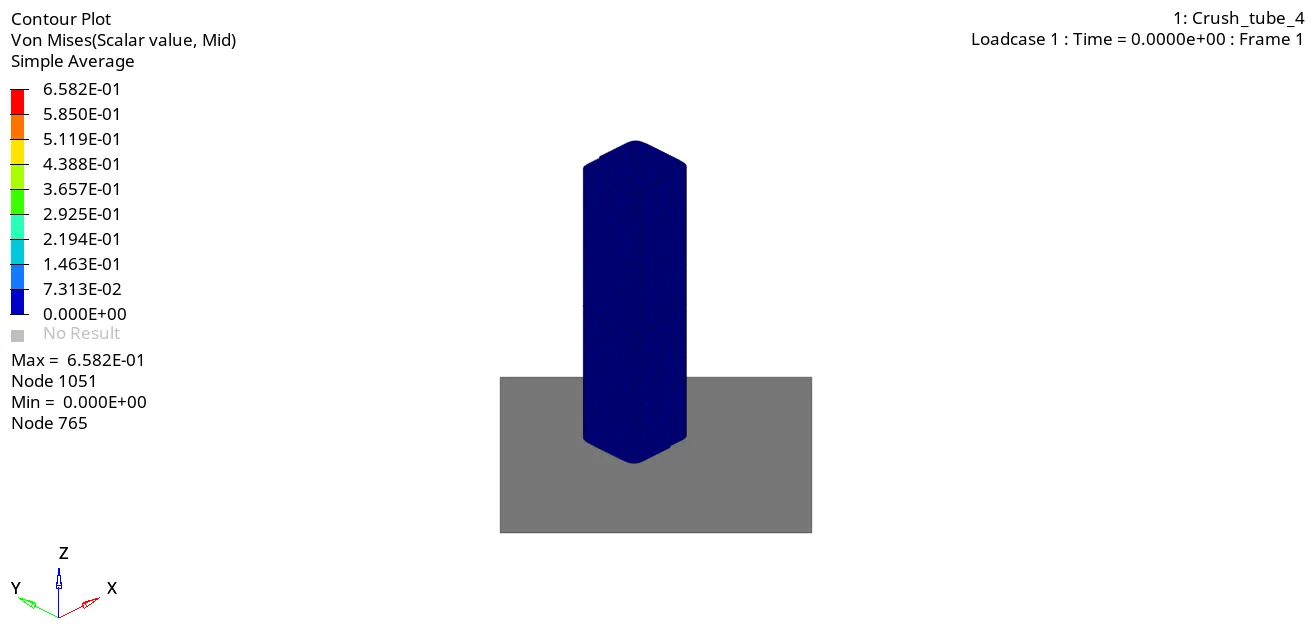
From above animation we can observe that, once notches are removed, deformation has started from bottom to top of the crush tube model.
Now we have to switch from HyperView mode to HyperGraph 2D mode.
In this case, internal energy shows higher peak value compared to previous case.
An initial velocity is high, so kinetic energy is also high. Over the period of time velocity decreasing. Once crushing is done there is no velocity and graph maintained at approximation constant lower value, which has been plotted below.
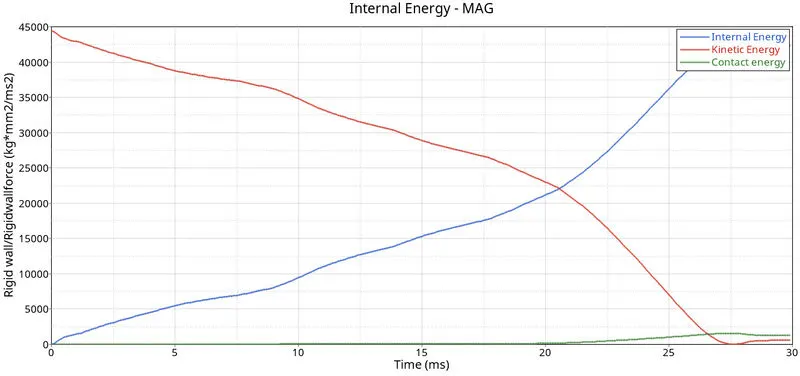
Now we have to plot the total resultant force graph. Once all parameters are filled, we have a required graph as shown in picture below.
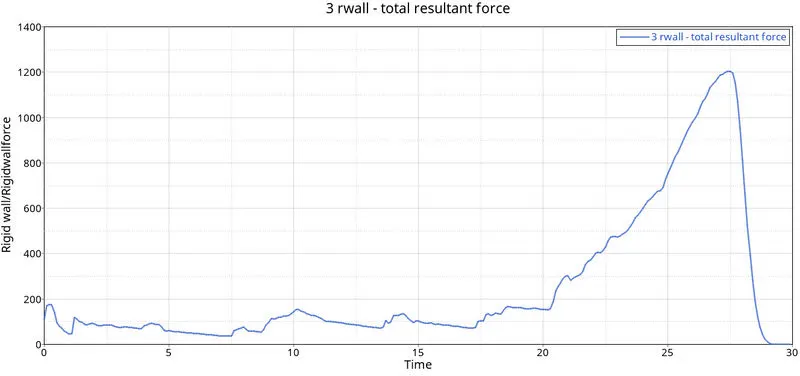
Initially rigid wall force starts from lower value because initially there is no contact between crush tube and rigid wall. And then graph goes on increasing up to 1200 N because elements are getting deformed and once rigid wall force reached at peak. This peak value is lowest from previous all cases. Then entire crush tube collides with rigid wall.
Then decrease in plot indicates entire component is at rest after Collison over a period of time.
- To run the model by creating new notch at middle and boundary conditions on rigid body node.
For this case we have to import the required file i.e. Crush_tube_0000.
In this case we have to create new notch at middle and boundary conditions on rigid body node.
To create a new notch, we have to follow:
Geom---->node edit---->align node---->select 1ST and 2nd (parallel node) ---->select nodes (which needs to modify)
Once both notches are created at middle of crush tube, model will look like as shown in picture below.
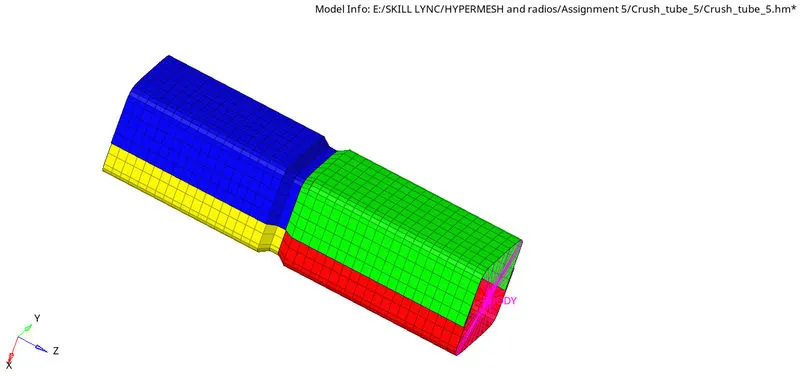
Now in order to run simulation, we have to follow same procedure as explained earlier.
Once simulation is done, solver will generate different files. Now, in order to check the energy error and mass error. We have to open the output file in notepad.
Once output file is opened, we can see the results.
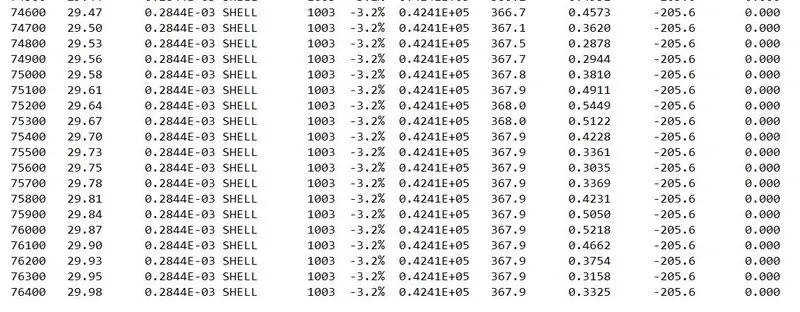
So, maximum energy error is -3.2% and mass error is 0. And both are in acceptable range.
Now we have to switch from Hypermesh mode to Hyperview mode. Then we have to select the appropriated (.h3D) file. And then we have to click on Apply to view the results.
By using different animation controls, we can check and animate the results as shown in picture below.
Contour plot for Von Mises stress
Maximum stress reached up to 0.66 MPa over the period of time.
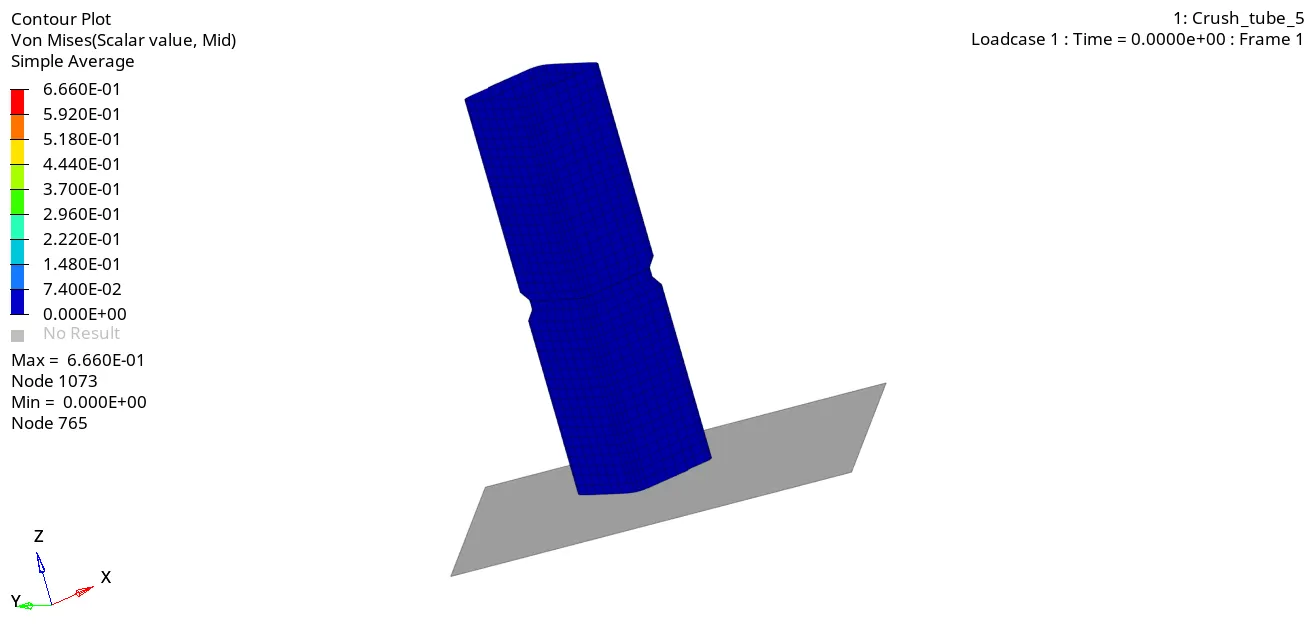
From above animation we can observe that, once notches are shifted to middle, deformation has started from middle to bottom of the crush tube model.
Now we have to switch from HyperView mode to HyperGraph 2D mode.
In this case, internal energy shows higher peak value compared to previous case.
An initial velocity is high, so kinetic energy is also high. Over the period of time velocity decreasing. Once crushing is done there is no velocity and graph maintained at approximation constant lower value, which has been plotted below.
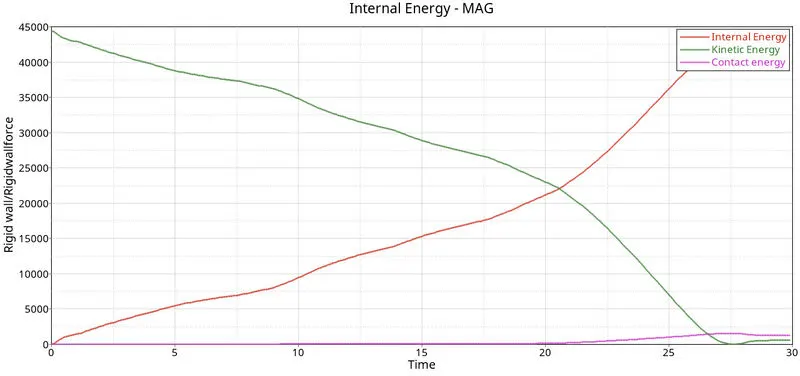
Now we have to plot the total resultant force graph. Once all parameters are filled, we have a required graph as shown in picture below.
Initially rigid wall force starts from lower value because initially there is no contact between crush tube and rigid wall. And then graph goes on increasing up to 1200 N because elements are getting deformed and once rigid wall force reached at peak. This peak value is similar to previous case. Then entire crush tube collides with rigid wall.
Then decrease in plot indicates entire component is at rest after Collison over a period of time.
- To create a new notch with nodes only from opposing two faces and run.
For this case we have to import the required file i.e. Crush_tube_0000.
In this case we have to create new notch with nodes only from opposing two faces.
To add a new notches, we will follow steps as shown below.
Geom---->node edit---->align node---->select 1ST and 2nd (parallel node) ---->select nodes (which needs to modify)
Once both notches are created on opposing two faces of crush tube, model will look like as shown in picture below.
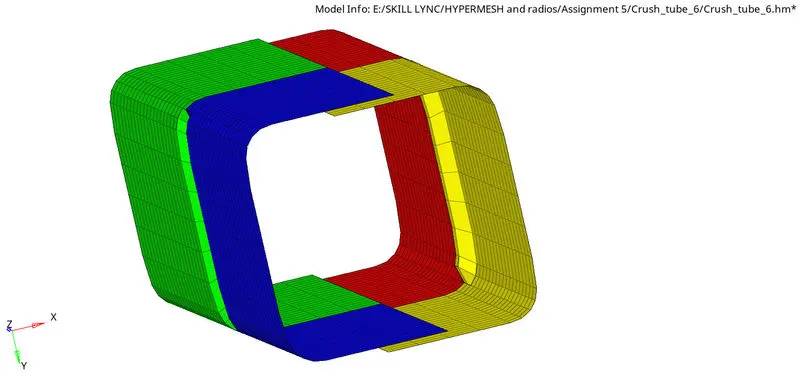
Now in order to run simulation, we have to follow same procedure as explained earlier.
Once simulation is done, solver will generate different files. Now, in order to check the energy error and mass error. We have to open the output file in notepad.
Once output file is opened, we can see the results.

So, maximum energy error is -3.0% and mass error is 0. And both are in acceptable range.
Now we have to switch from Hypermesh mode to Hyperview mode. Then we have to select the appropriated (.h3D) file. And then we have to click on Apply to view the results.
By using different animation controls, we can check and animate the results as shown in picture below.
Contour plot for Von Mises stress
Maximum stress reached up to 0.66 MPa over the period of time.
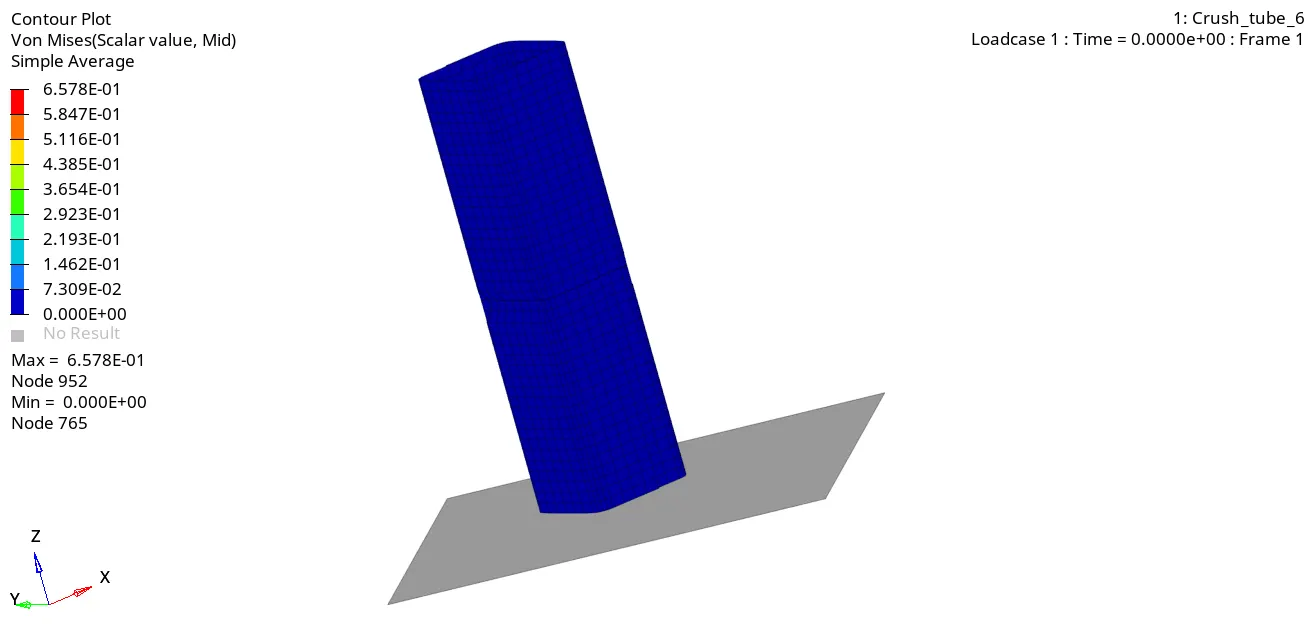
From above animation we can observe that, once notches are shifted to middle of side faces. Component has started deformed at middle side notch regions of the crush tube model.
Now we have to switch from HyperView mode to HyperGraph 2D mode.
In this case, internal energy shows higher peak value compared to previous case.
An initial velocity is high, so kinetic energy is also high. Over the period of time velocity decreasing. Once crushing is done there is no velocity and graph maintained at approximation constant lower value, which has been plotted below.
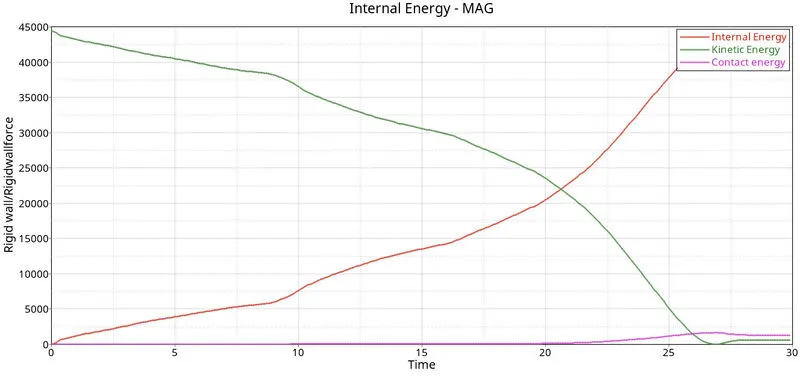
Now we have to plot the total resultant force graph. Once all parameters are filled, we have a required graph as shown in picture below.
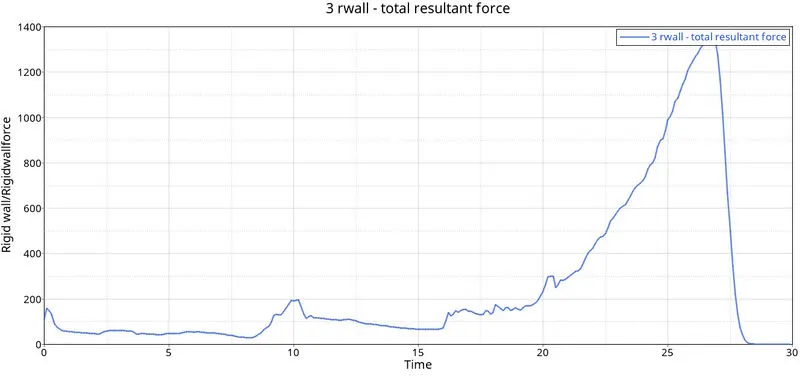
Initially rigid wall force starts from lower value because initially there is no contact between crush tube and rigid wall. And then graph goes on increasing up to 1400 N because elements are getting deformed and once rigid wall force reached at peak. Then entire crush tube collides with rigid wall.
Then decrease in plot indicates entire component is at rest after Collison over a period of time.
How does the notch affect the results?
A notch is basically a region, where change in cross-section of the component happens. When we keep the notch uneven stress distribution and internal stress starts generating.
As in above case, when we have not considered notch region in our component. Component will experience less concentration compared to all the cases.
CONCLUSIONS
|
1. Hence meshing is done successfully on bumper model.
2. Simulation has been done successfully for all the cases of crush tube model and compared.