Assignment 5-RADIOSS Interfaces & Study of Effect of Notches Challenge
AIM:- To mesh the given bumper component using HyperWorks and run the simulation on a crash tube model with 6 different cases in RADIOSS simulation.
Objectives:-
- The mesh size of the bumper component should be equal to 6mm
- Run the crash tube model as it is.
- change the Inacti= 6 and run
- create the type 11 contact and run
- Remove both notches and remove boundary condition on rigid body node then run
- create a new notch in the middle, select the whole section, and run
- Create a new notch with nodes only from opposing 2 faces and run
Procedure:-
Meshing and connecting the bumper element
- After opening and selecting the Radioss user interface the HyperWorks, then import the bumper element .hm file into the HyperWorks by >>import>>import model>>choose file then import.
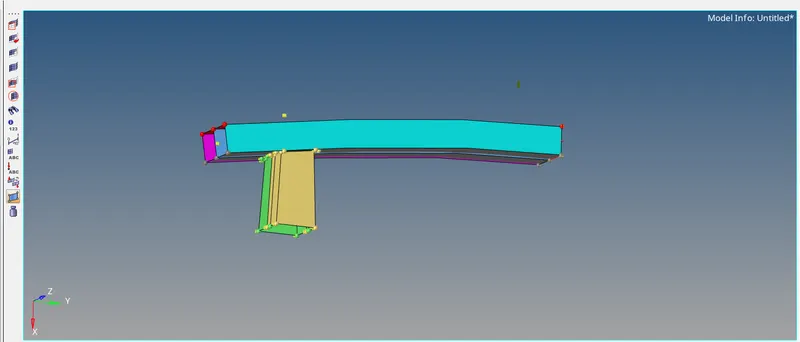
Importing the bumper element
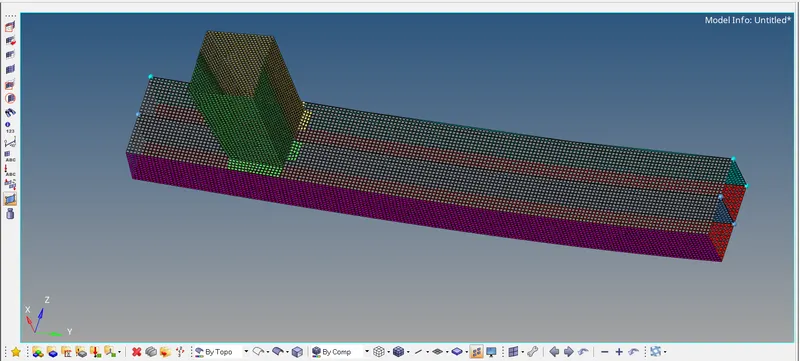
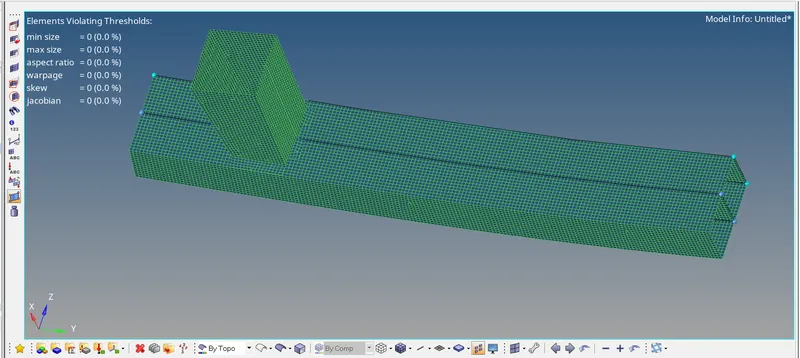
- After importing the .hm file, we have to clean up the geometry of the bumper elements by deleting the free nodes and surfaces and toggling the edges using the geometry clean-up options which are available in the geom tab.
- >>geom tab>>temp node>>select nodes>>remove.
2. Run the crash tube model as it is
- Import the crash tube 0000.rad file into the HyperWorks slover desk by >>Import>>import slover deck >>choose file and then import.
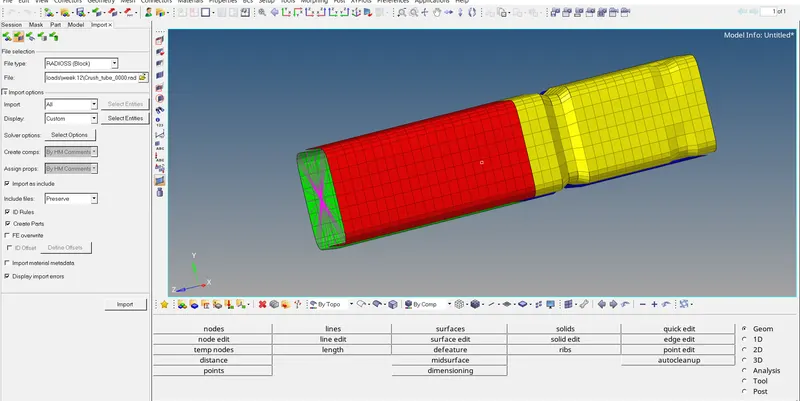
Crash tube model is imported
- After importing the crash tube file, check the given default properties of the model by >>Model>>properties and >>model >> groups as shown below.
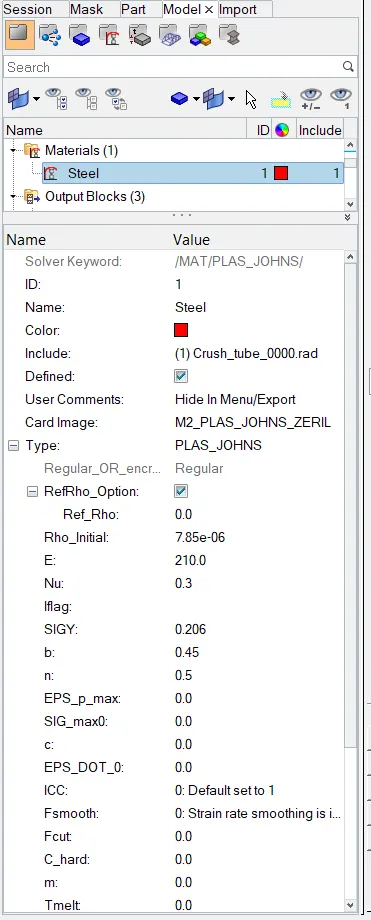
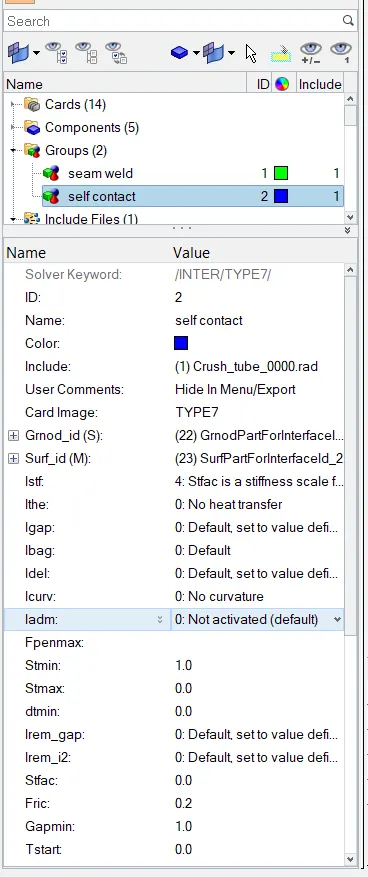
Default properties of the given model
- we can run the simulation >>analysis>>radioss
- we have to save the file in the new folder to store all output files. In the options tab, we have to recommend keeping "-nt4" which indicates 4 crores to run the simulation faster. where "nt" indicates a number of threads.

Analysis and Radioss tab
- After clicking Radioss, the analysis window pops up and we can see after a few minutes the job was done successfully.
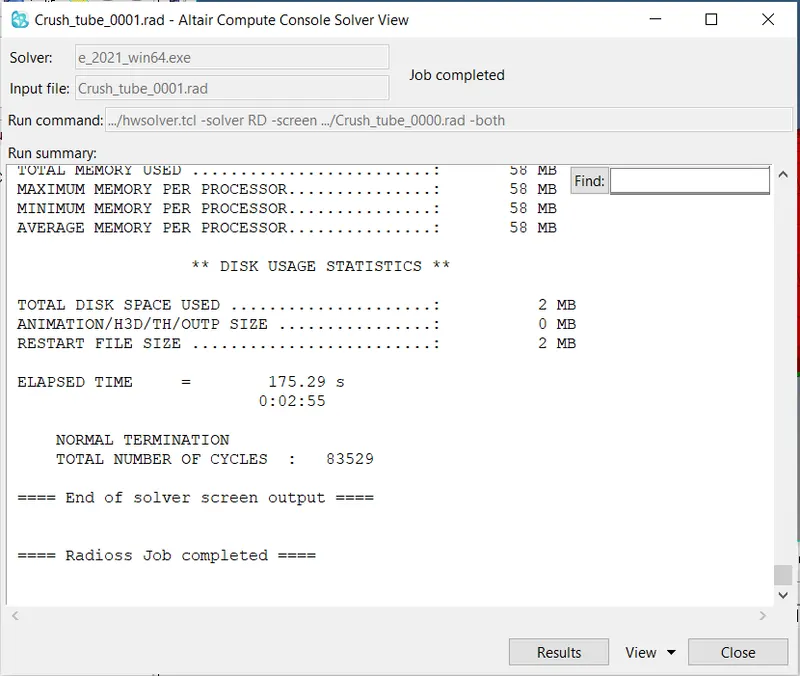
Analysis was done successfully
- The simulation is done, now we have to visualize it in hyper view. for this we have to open hyper view and import the .h3d file.
- And opening contour, then select von misses and averaging method as a simple average method
- In the next step, we have to carry out the energy and mass error analysis. For this, we have to 0001.out file in the notepad. Scrolling to the end we can see the energy error and mass error
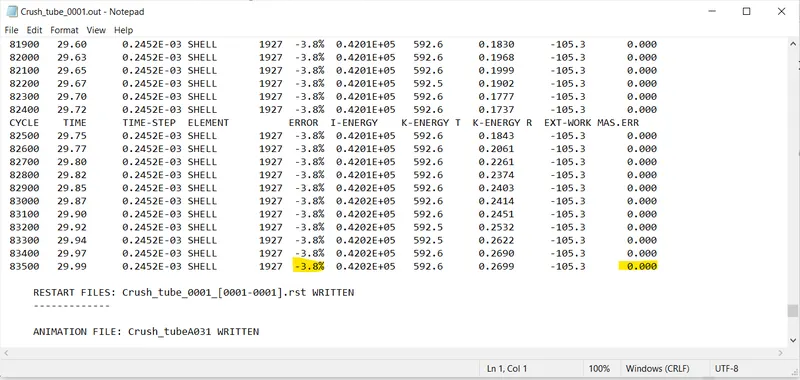
- The energy error is -3.8 % and the mass error is 0.00%. The acceptable range for error is -15% to 5% which is acceptable, we can go ahead to plot graphs in the hypergraph.
- Now we have to plot the graphs in the hypergraph tool and in hypergraph we have to import the.T01 file.
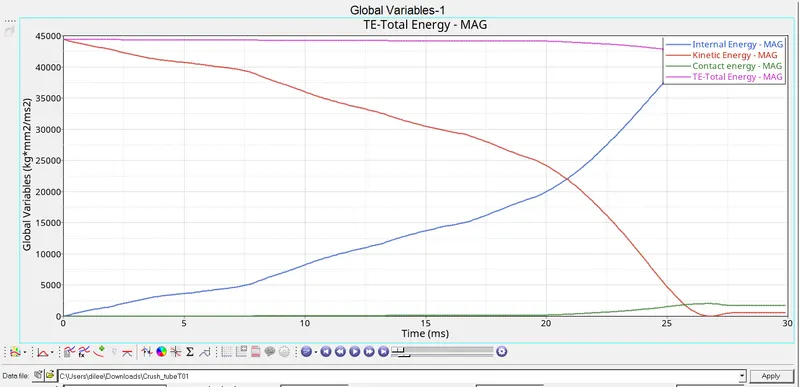
- As we can see from the above graph, the kinetic energy decreases to zero from starting time to the termination time. Because the displacement rate is decreased over a period of time. so the kinetic energy is reduced.
- As we know internal energy, there is no heat transfer in the system. So we only have to consider work done for calculating the internal energy. Work done is the product of force and displacement. Since a displacement is increasing over a period of time, work done will also increase. As a result of which internal energy will also increase.
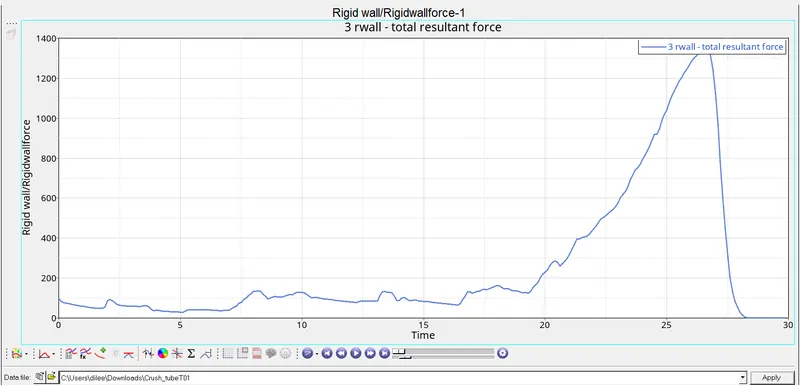
- Initially, rigid wall force starts from a lower value because initially there is no contact between the crush tube and the rigid wall. And then the graph goes on increasing because elements are getting deformed and once rigid wall force reached a peak. Then entire crush tube collides with a rigid wall.
- Then decrease in the plot indicates the entire component is at rest after Collison over a period of time.
3. change the Inacti= 6 and run the simulation.
- Import the crash tube file as discussed in the previous case.
- For this we have to change the Inacti value to 6. which can be done >>Model tab>>Groups>>selfcontact>>change the inacti value as required.
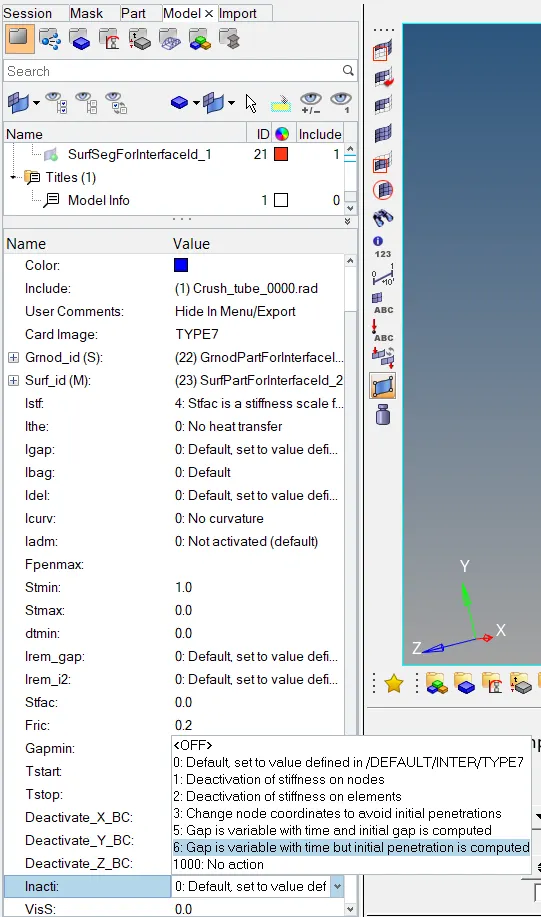
Changing the Inacti value
- Now run the analysis and save the file in the new folder with connectors turned on and options as -nt4. and run the simulation as in the previous case.
- After the completion of the simulation, visualize the simulation in the hyper view tab.
- In the next step, we have to carry out the energy and mass error analysis. For this, we have to 0001.out file in the notepad. Scrolling to the end we can see the energy error and mass error
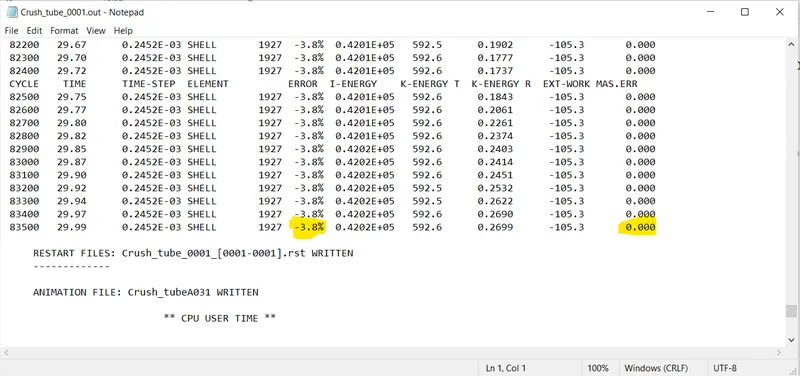
- The energy error is -3.8 % and the mass error is 0.00%. The acceptable range for error is -15% to 5% which is acceptable, we can go ahead to plot graphs in the hypergraph.
- Now we have to plot the graphs in the hypergraph tool and in hypergraph we have to import the.T01 file.
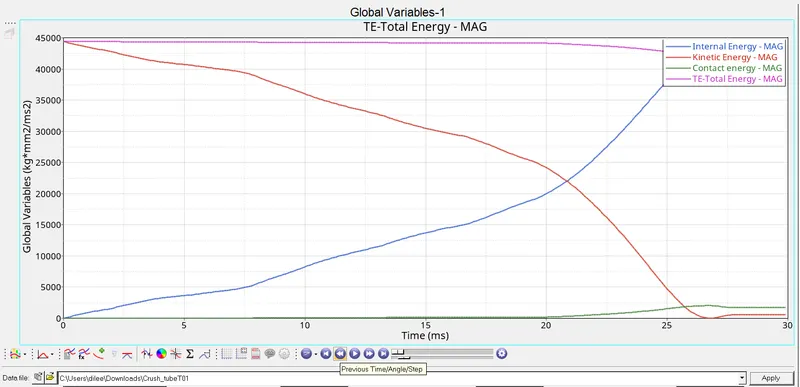
- As we can see from the above graph, the kinetic energy decreases to zero from starting time to the termination time. Because the displacement rate is decreased over a period of time. so the kinetic energy is reduced.
- As we know internal energy, there is no heat transfer in the system. So we only have to consider work done for calculating the internal energy. Work done is the product of force and displacement. Since a displacement is increasing over a period of time, work done will also increase. As a result of which internal energy will also increase.
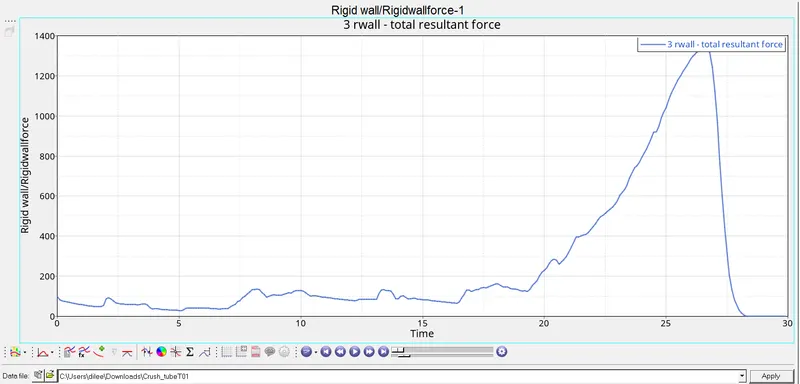
- Initially, rigid wall force starts from a lower value because initially there is no contact between the crush tube and the rigid wall. And then the graph goes on increasing because elements are getting deformed and once rigid wall force reached a peak. Then entire crush tube collides with a rigid wall.
- Then decrease in the plot indicates the entire component is at rest after Collison over a period of time.
4. Create the type 11 contact and run the simulation.
- Import the crash tube file as discussed in the previous case 1.
- For this, we have to create the Type 11 contact type. which can be done >>Model tab>>Groups>>selfcontact>>change the card image as required.
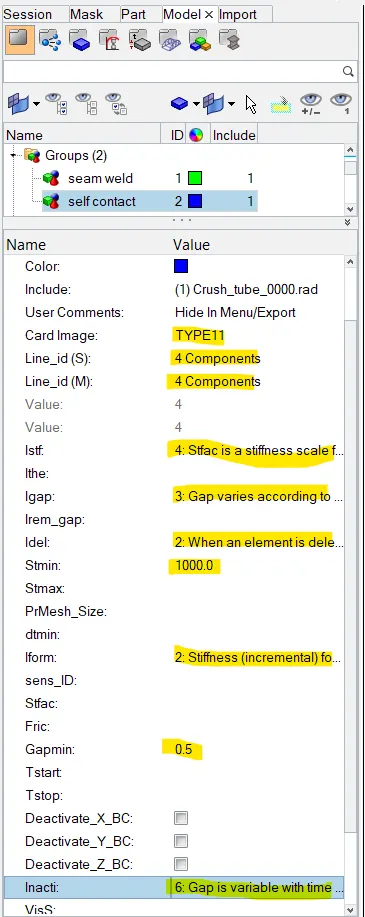
- Now run the analysis and save the file in the new folder with connectors turned on and options as -nt4. and run the simulation as in the previous case.
- After the completion of the simulation, visualize the simulation in the hyper view tab.
- In the next step, we have to carry out the energy and mass error analysis. For this, we have to 0001.out file in the notepad. Scrolling to the end we can see the energy error and mass error
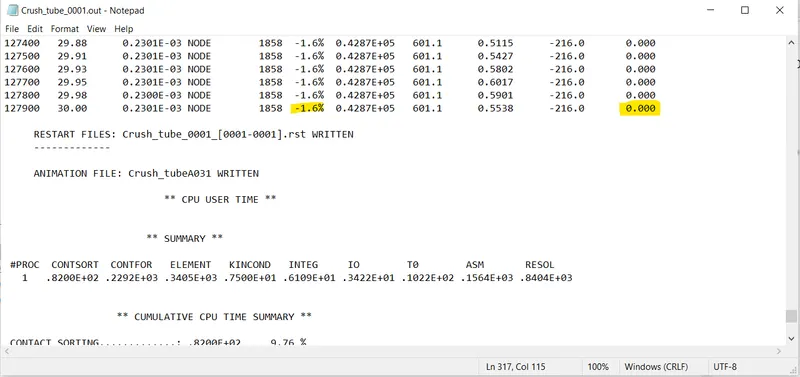
- The energy error is -1.6 % and the mass error is 0.00%. The acceptable range for error is -15% to 5% which is acceptable, we can go ahead to plot graphs in the hypergraph.
- Now we have to plot the graphs in the hypergraph tool and in hypergraph we have to import the.T01 file.
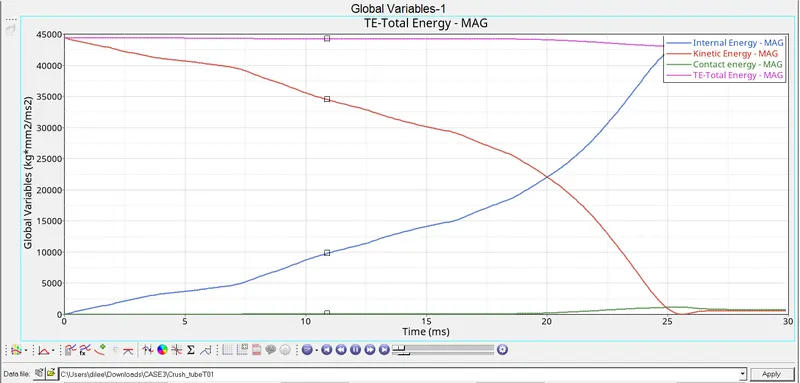
- As we can see from the above graph, the kinetic energy decreases to zero from starting time to the termination time. Because the displacement rate is decreased over a period of time. so the kinetic energy is reduced.
- As we know internal energy, there is no heat transfer in the system. So we only have to consider work done for calculating the internal energy. Work done is the product of force and displacement. Since a displacement is increasing over a period of time, work done will also increase. As a result of which internal energy will also increase.
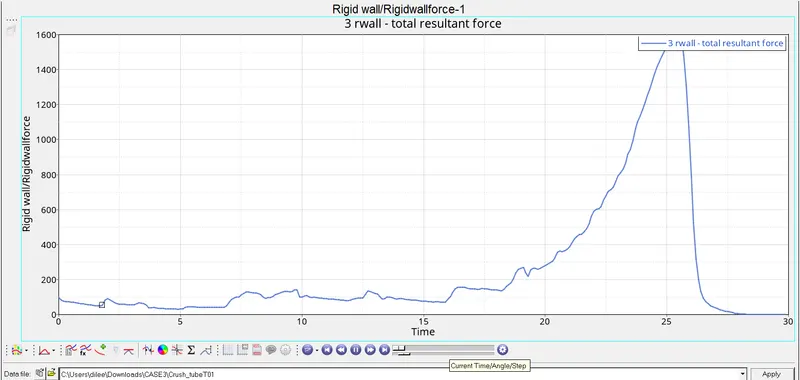
- Initially, rigid wall force starts from a lower value because initially there is no contact between the crush tube and the rigid wall. And then the graph goes on increasing because elements are getting deformed and once rigid wall force reached a peak. Then entire crush tube collides with a rigid wall.
- Then decrease in the plot indicates the entire component is at rest after Collison over a period of time.
5. Remove the notches and remove the boundary condition on rigid body then run the simulation
- import the crash tube file, In this case we have to remove the notches and the boundary conditions on the rigid body.
- We can remove the notches by using the align mode at notches by >>Geometry>>Node edit>>Select 1st and 2nd nodes and then select the which are to be aligned.
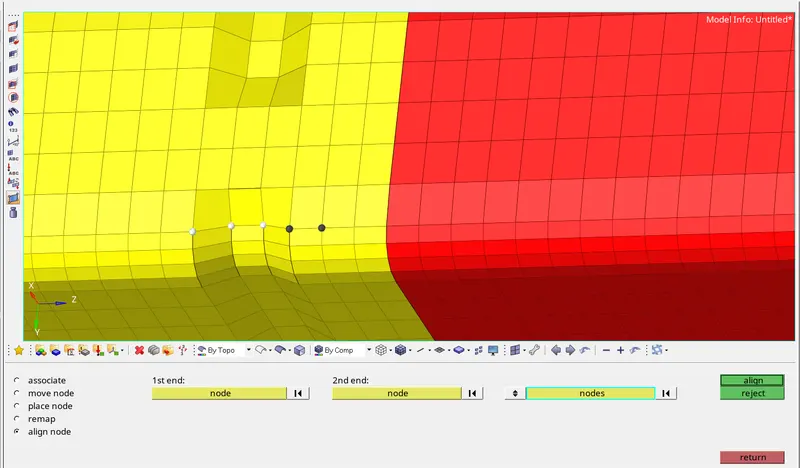
Before deleting the notches
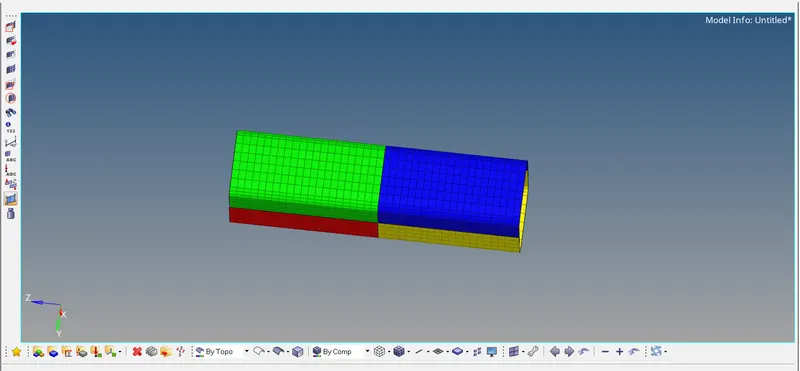
crash tube after deleting all the notches
- Now we have to remove the boundary conditions on rigid body node, for this we have to open >>view>>browsers>>hypermesh>>slover>>BCS>>then remove all the boundary conditions. as shown in the below figure.'
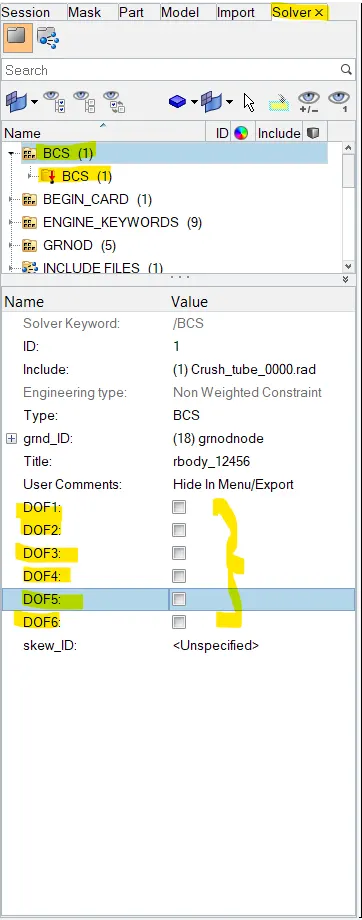
Removing boundary conditions
- Now run the analysis and save the file in the new folder with connectors turned on and options as -nt4. and run the simulation as in the previous case.
- After the completion of the simulation, visualize the simulation in the hyper view tab
- In the next step, we have to carry out the energy and mass error analysis. For this, we have to 0001.out file in the notepad. Scrolling to the end we can see the energy error and mass error
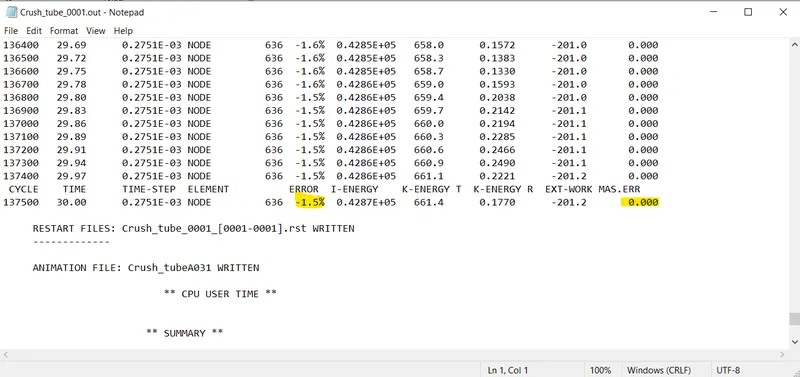
- The energy error is -1.5 % and the mass error is 0.00%. The acceptable range for error is -15% to 5% which is acceptable, we can go ahead to plot graphs in the hypergraph.
- Now we have to plot the graphs in the hypergraph tool and in hypergraph we have to import the.T01 file.
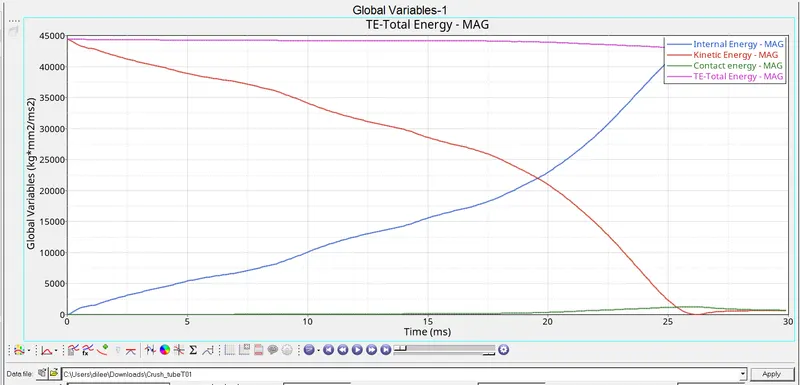
- As we can see from the above graph, the kinetic energy decreases to zero from starting time to the termination time. Because the displacement rate is decreased over a period of time. so the kinetic energy is reduced.
- As we know internal energy, there is no heat transfer in the system. So we only have to consider work done for calculating the internal energy. Work done is the product of force and displacement. Since a displacement is increasing over a period of time, work done will also increase. As a result of which internal energy will also increase.
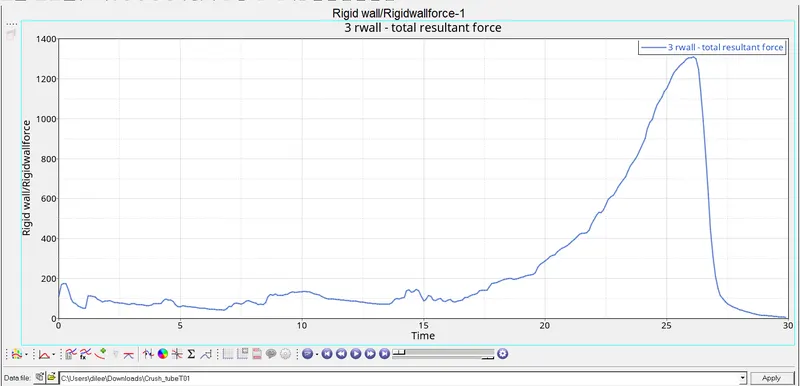
- Initially, rigid wall force starts from a lower value because initially there is no contact between the crush tube and the rigid wall. And then the graph goes on increasing because elements are getting deformed and once rigid wall force reached a peak. Then entire crush tube collides with a rigid wall.
- Then decrease in the plot indicates the entire component is at rest after Collison over a period of time.
6. Create a new notch in the middle, select the whole and run the simulation.
- For this case we have to create a new notch in the middle of the crash tube after importing the 0000.rad file
- To create a notch we camn align method by selecting the proper nodes at the middle of the section.>>Geometry>>Node edit>>Select 1st and 2nd nodes and then select the which are to be aligned.
- We ccreated a notch exactly at the middle of the crash tube by 2.5mm depression as shown .
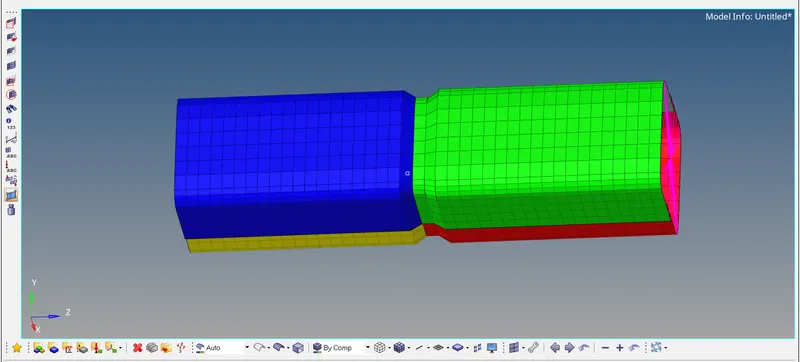
Notch created at the middle of the crash tube
- Now run the analysis and save the file in the new folder with connectors turned on and options as -nt4. and run the simulation as in the previous case.
- After the completion of the simulation, visualize the simulation in the hyper view tab
- In the next step, we have to carry out the energy and mass error analysis. For this, we have to 0001.out file in the notepad. Scrolling to the end we can see the energy error and mass error
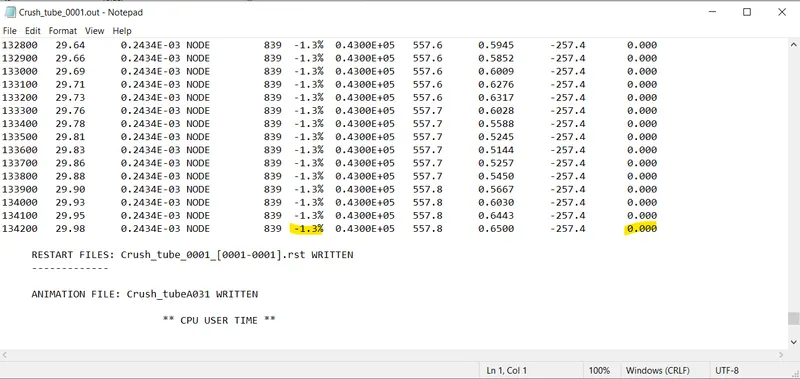
- The energy error is -1.3 % and the mass error is 0.00%. The acceptable range for error is -15% to 5% which is acceptable, we can go ahead to plot graphs in the hypergraph.
- Now we have to plot the graphs in the hypergraph tool and in hypergraph we have to import the.T01 file.
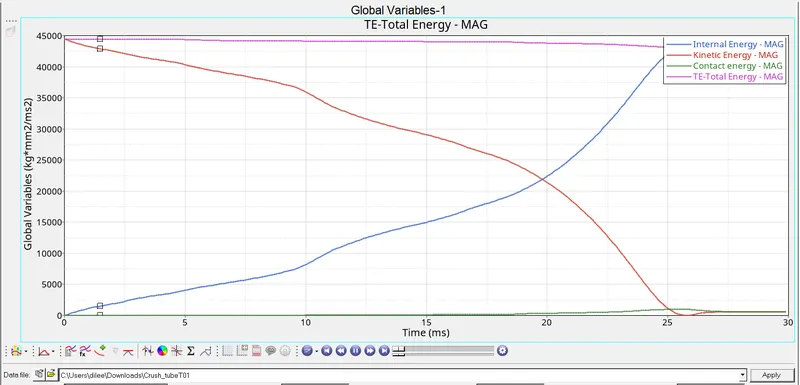
- As we can see from the above graph, the kinetic energy decreases to zero from starting time to the termination time. Because the displacement rate is decreased over a period of time. so the kinetic energy is reduced.
- As we know internal energy, there is no heat transfer in the system. So we only have to consider work done for calculating the internal energy. Work done is the product of force and displacement. Since a displacement is increasing over a period of time, work done will also increase. As a result of which internal energy will also increase.
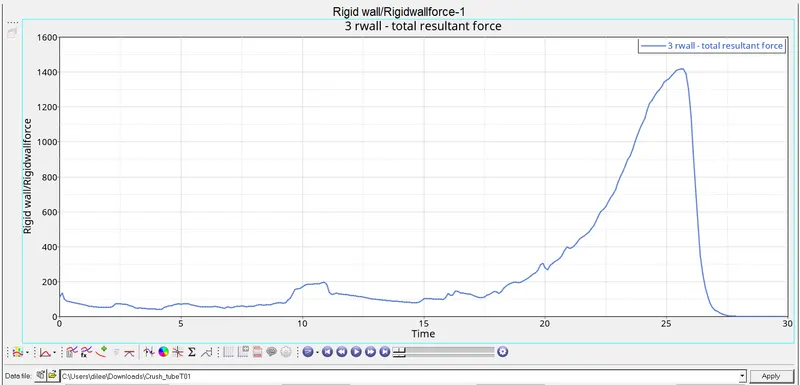
- Initially, rigid wall force starts from a lower value because initially there is no contact between the crush tube and the rigid wall. And then the graph goes on increasing because elements are getting deformed and once rigid wall force reached a peak. Then entire crush tube collides with a rigid wall.
- Then decrease in the plot indicates the entire component is at rest after Collison over a period of time.
7. Create a new notch with nodes only from 2 opposing faces and run the simulation.
- Import the 0000.rad file of the case 4 into the hyperworks slover deck
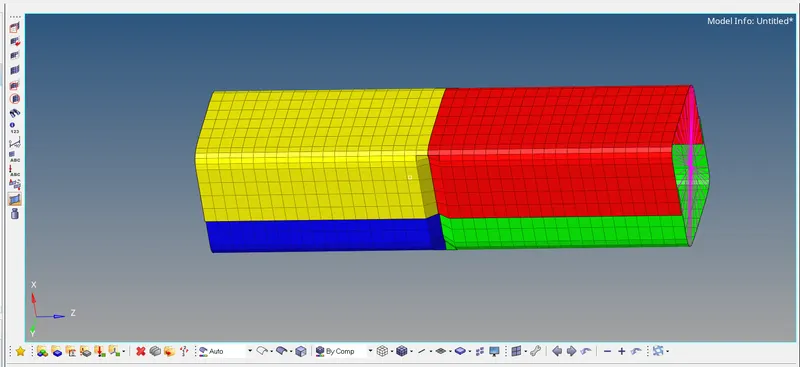
- In this case we have to create a notch only from 2 opposing faces. for this, we have to >>Geometry>>Node edit>>Select 1st and 2nd nodes and then select the which are to be aligned.
- We created a notch exactly at the middle of the crash tube by 2.5mm depression as shown on opposing faces.
- Now run the analysis and save the file in the new folder with connectors turned on and options as -nt4. and run the simulation as in the previous case.
- After the completion of the simulation, visualize the simulation in the hyper view tab
- In the next step, we have to carry out the energy and mass error analysis. For this, we have to 0001.out file in the notepad. Scrolling to the end we can see the energy error and mass error
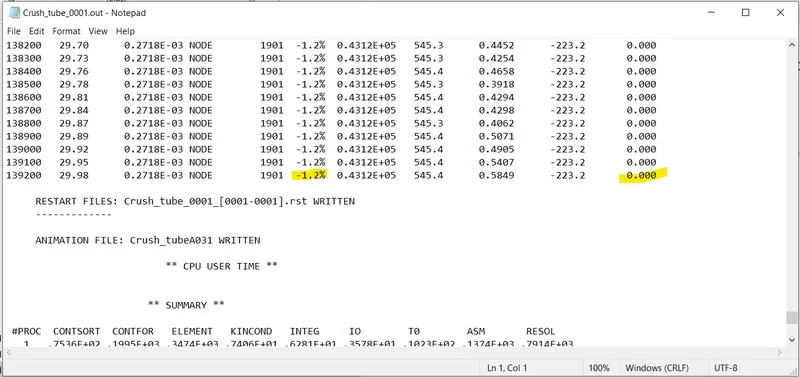
- The energy error is -1.5 % and the mass error is 0.00%. The acceptable range for error is -15% to 5% which is acceptable, we can go ahead to plot graphs in the hypergraph.
- Now we have to plot the graphs in the hypergraph tool and in hypergraph we have to import the.T01 file.
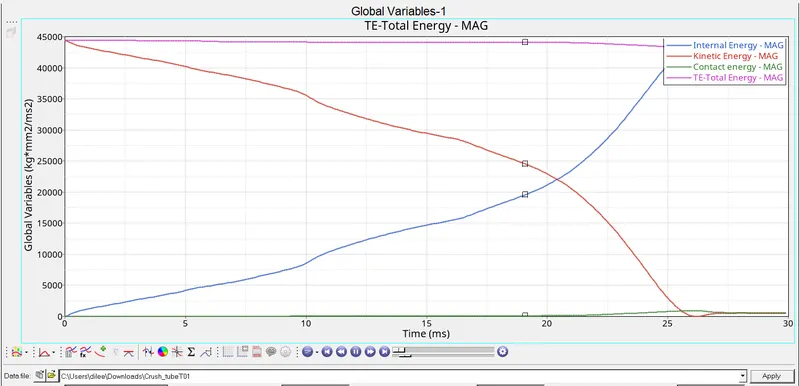
- As we can see from the above graph, the kinetic energy decreases to zero from starting time to the termination time. Because the displacement rate is decreased over a period of time. so the kinetic energy is reduced.
- As we know internal energy, there is no heat transfer in the system. So we only have to consider work done for calculating the internal energy. Work done is the product of force and displacement. Since a displacement is increasing over a period of time, work done will also increase. As a result of which internal energy will also increase.
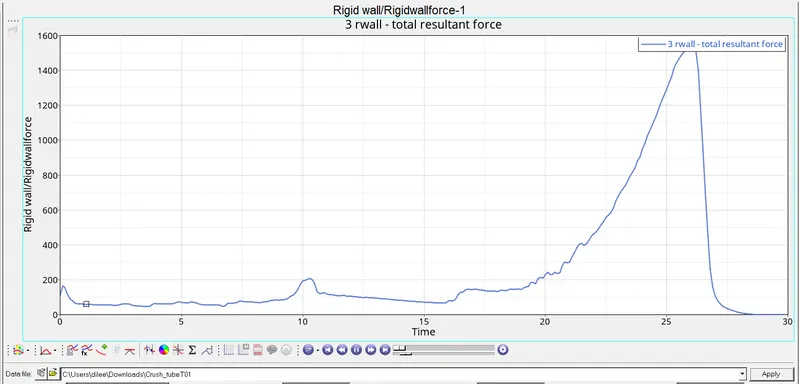
- Initially, rigid wall force starts from a lower value because initially there is no contact between the crush tube and the rigid wall. And then the graph goes on increasing because elements are getting deformed and once rigid wall force reached a peak. Then entire crush tube collides with a rigid wall.
- Then decrease in the plot indicates the entire component is at rest after Collison over a period of time.
NOTCH EFFECT ON THE RESULTS
- A notch is basically a region, where change in cross-section of the component happens. When we keep the notch uneven stress distribution and internal stress starts generating.
- As in above case, when we have not considered notch region in our component. Component will experience less concentration compared to all the cases.