Assignment 5-RADIOSS Interfaces & Study of Effect of Notches Challenge
Objective
We will use different interface types on the simulation and its effects for the results.
- Plot RWALL forces ,contact forces,internal energy and Create TH/PART for all parts and compare results for all cases.
- Comment your thought on why there is a change in the internal energies.
- How does the notch affect the results?
- Plot energies and note any difference.
Case 0: Create the mesh for bumper assembly,mesh size should be 6mm.
Case 1: Run the crash tube model as it is.
Case 2: Change the Inacti=6 and run.
Case 3: Create the type 11 contact and run.
Case 4: Remove both notches and remove boundary condition on rigid body node then run.
Case 5: Create a new notch in the middle, select the whole section and run.
Case 6: Create a new notch with nodes only from opposing 2 faces and run.
Case 0:
Step 1: Open Model> Bumper_System.hm
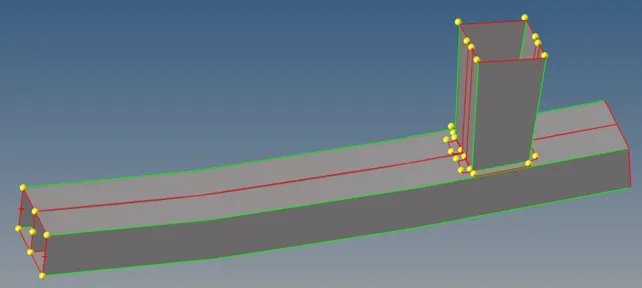
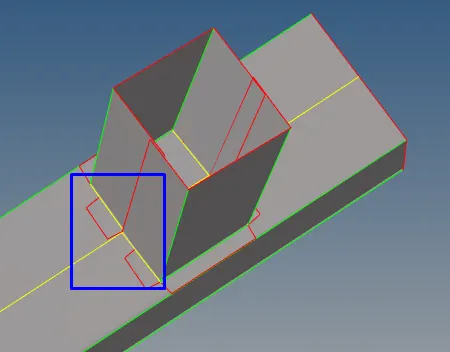
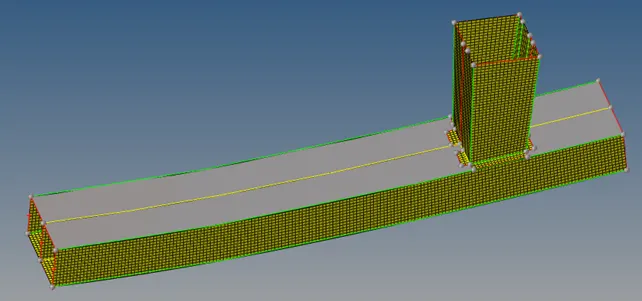
Step 2: Check free edges, missing surfaces and duplicate surfaces
Red color represents free edges, yellow color represents double surface and green color represents shared edges with two or more surfaces. There are some missing surfaces and free surfaces on the model (red rectangle). In addition, there are some duplicate surfaces (yellow rectangle)
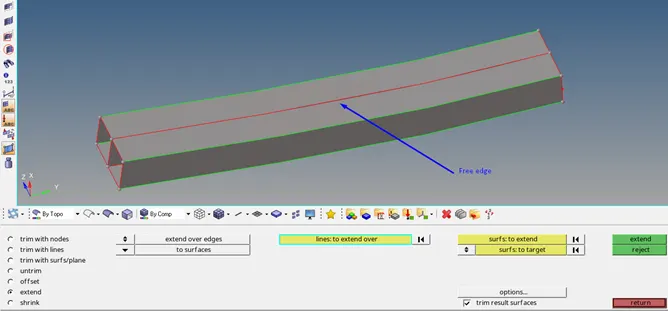
We use Geom panel area to clean up the geometry.


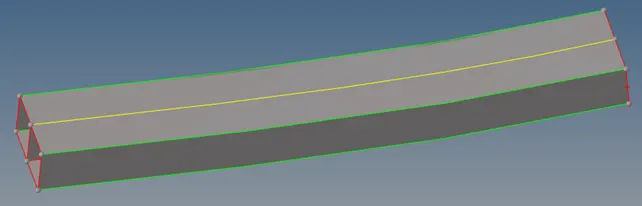
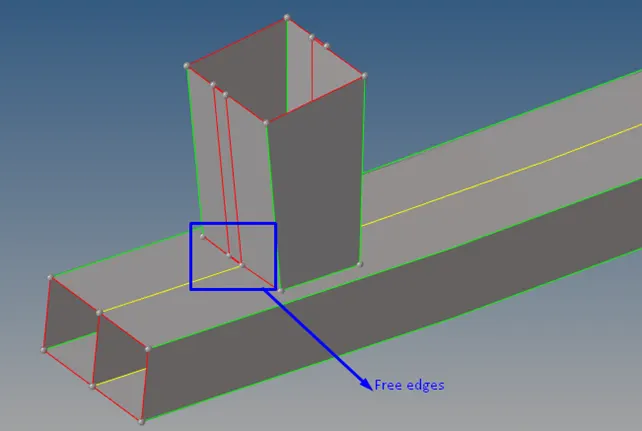
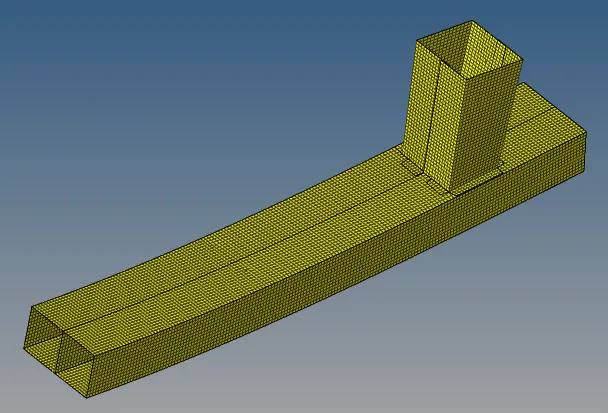
Step 4: To perform mesh the component
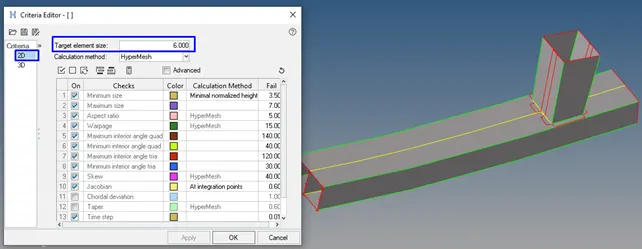
Before we will mesh the component, default values of element lengths in the Criteria Editor should be set to control mesh quality.
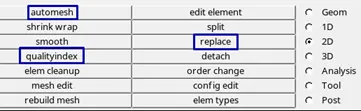
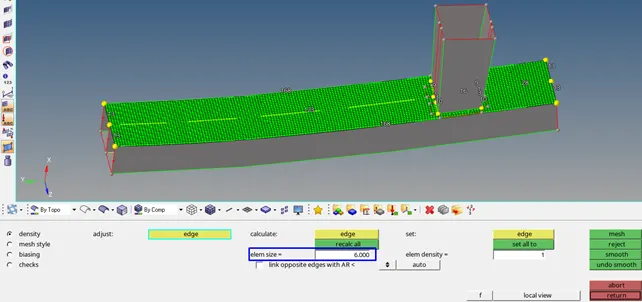
To mesh the component, several options under Geom and Tool Panel area are used


Case 1: Run the crash tube model as it is
We will import Radios starter file Crush_tube_0000.rad
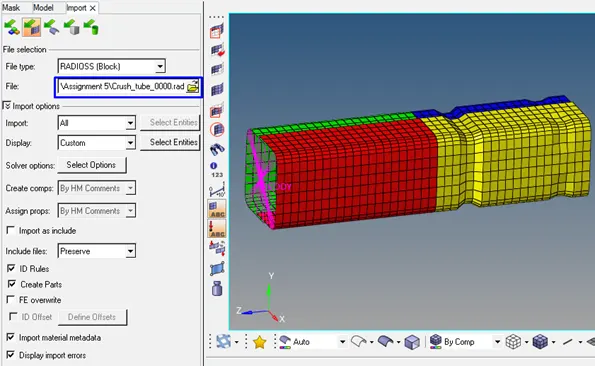
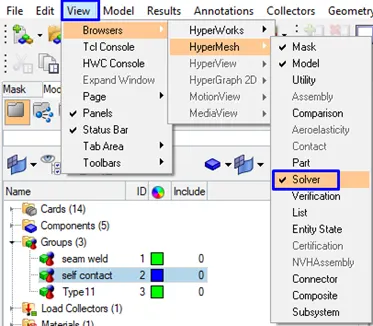
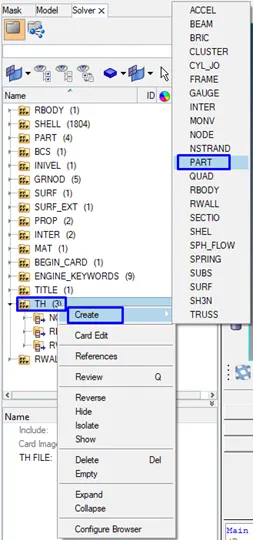
We will choose solver to create part.
We will create a part form TH which describes the time history for parts.
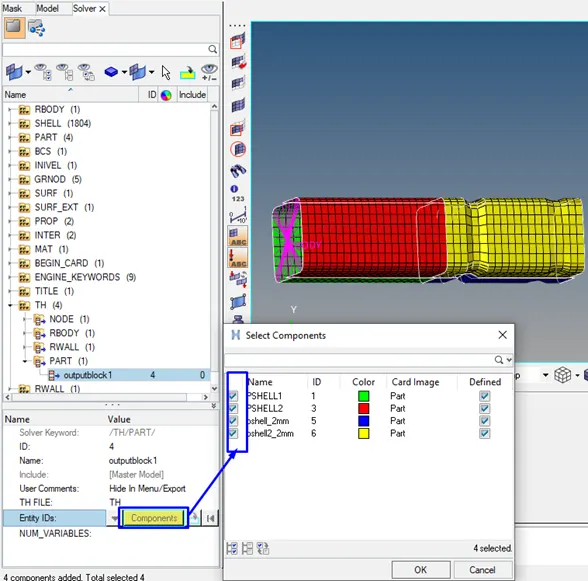
We will choose all of the parts in the Entity IDs.
Case 1.1: Plot RWALL forces, contact forces, internal energy
After the analysis completed, open Crush_tube_Case2_0001.out file.
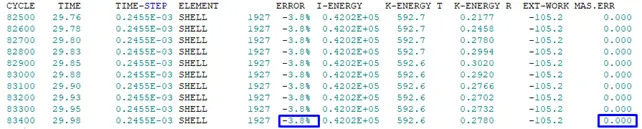
Figure 1
The error must be less than 15% at the end of the computation. The energy error is -3.8% and mass error is 0.000% at the end of the computation in the figure 1. The energy error is below the 15%. Therefore, the results are acceptable to plot energy graph.
The crush tube is deformed until 19 ms. After 20 ms total resultant force is dramatically increasing up to 1337 (at the 26.6ms) because of requiring more forces to deform.
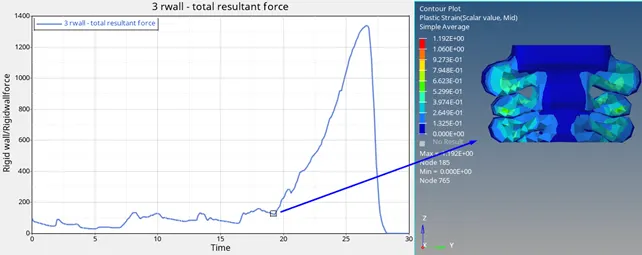
Figure 2: RWALL forces
Maximum Contact force is at 93.7
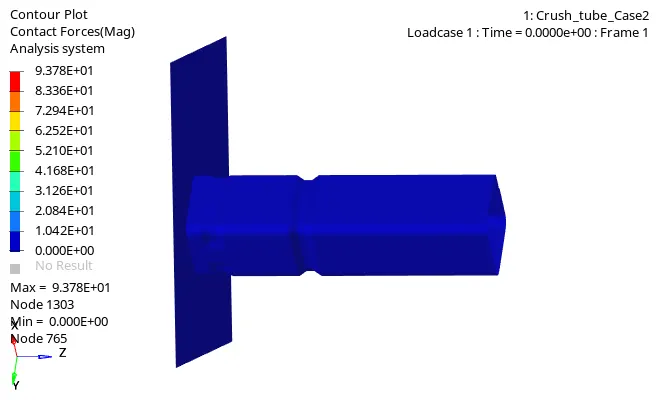
Figure 3: Contact Forces
The crush tube is crushed until 19-20 ms. After 20 ms, cruch tube tries to deform more. Therefore, elements are coming more closely each other which increases contact energy until to 2029 (26.7ms).
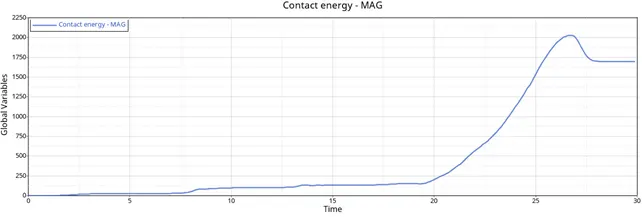
Figure 4: Contact Energy
Internal energy is increasing exponentially to a maximum value which is to a value of 42500.
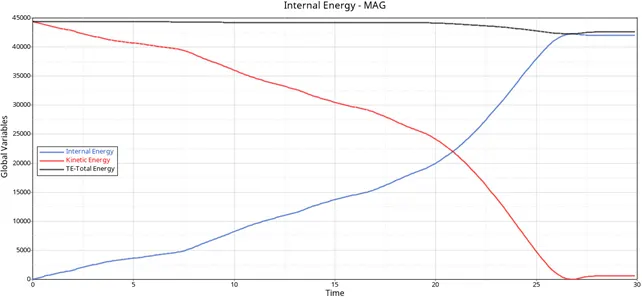
Figure 5: the counter of Energy
Case 2: Change the Inacti=6 and run
We will import Radios starter file Crush_tube_0000.rad
We will change Inacti to 6 in the INTER under Type7 in solver and /TH/PART is created.
/INTER/TYPE7: Interface TYPE7 is a multi-usage impact interface, modeling contact between a main surface and a group of secondary nodes. It is also possible to consider heat transfer and heat friction.
The main limitations of this interface are:
- Time step is reduced in case of high impact speed or contacts with small gap.
- It does not work properly if used with a rigid body at high impact speed or rigid body with small gap.
- It does not solve edge to edge contact (to solve this, /INTER/TYPE11 should be used along with TYPE7).
Interface Type 7 > Inacti=6 means „The gap is reduced and scaled“. Gap is variable with time but initial penetration is computed >> good accuracy
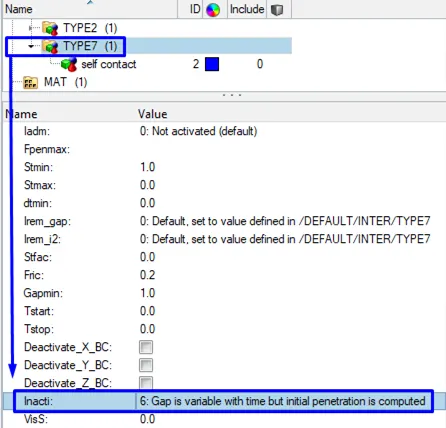
Figure 6: Interface Type 7 in Solver
Case 2.1: Plot RWALL forces, contact forces, internal energy
After the analysis completed, open Crush_tube_Case3_0001.out
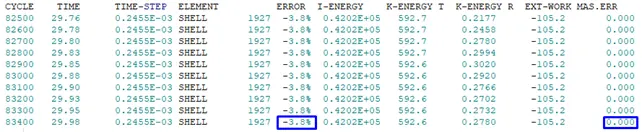
Figure 7
The error must be less than 15% at the end of the computation. The energy error is -3.8% and mass error is 0.000% at the end of the computation in the figure 7. The energy error is below the 15%. Therefore, the results are acceptable to plot energy graph.
In this case, the counter of total resultant force is the same as case 1. The crush tube is deformed until 19 ms. After 20 ms total resultant force is dramatically increasing up to 1337 (at the 26.6ms) because of requiring more forces to deform.
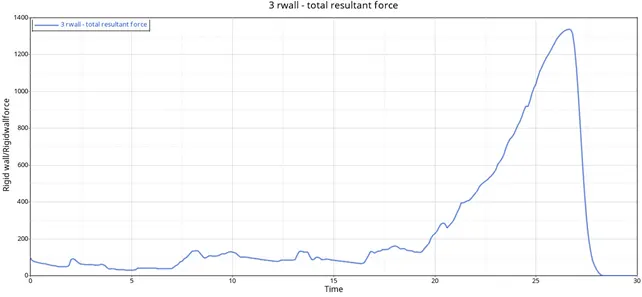
Figure 8: RWALL forces
Maximum Contact force is at 93.7
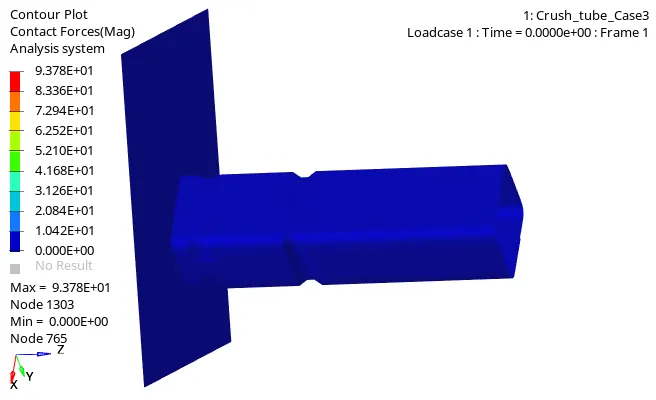
Figure 9: Contact Forces
The counter of contact energy is similar as Case1. After 20 ms, crush tube tries to deform more. Therefore, elements are coming more closely each other which increases contact energy until to 2029 (26.7ms). After 27 ms, crush tube loses its contact with the Rigid wall where the contact energy is decreasing and its contour becomes flat.
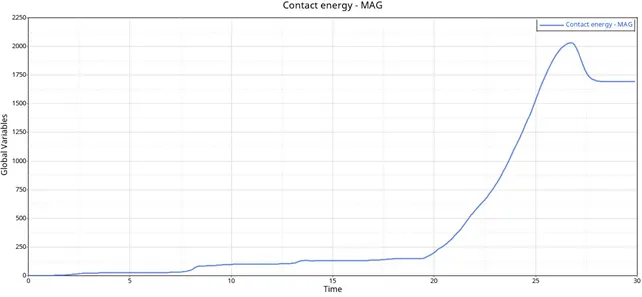
Figure 10: Contact Energy
Case 2 is the same values and graph as case 1.
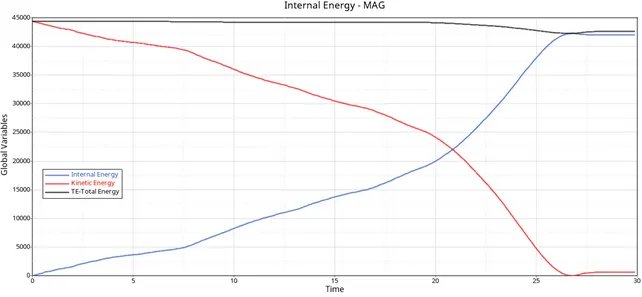
Figure 11: the counter of Energy
Case 3: Create the type 11 (Edge to Edge contact) contact and run
We will import Radios starter file Crush_tube_0000.rad.
We will create a new Interface Type 11 (Figure 13) with recommended properties (Figure 14) which are the same as that of the Type7 Interface.
/INTER/TYPE11: This interface simulates impact between edge to Edge or lines. A line can be a beam or truss element or a shell edge or spring elements. This interface can be used in addition to /INTER/TYPE7 to solve the edge to edge limitation of interface TYPE7. Therefore, we will change Inacti to 6 in the INTER under Type7 in solver (figure 12) and /TH/PART is created.
The interface (/INTER/TYPE11) properties are:
- Impacts occur between a main and a secondary line.
- A secondary line can impact on one or more main lines.
- A line can belong to the main and the secondary side. This allows self-impact.
- One of the drawbacks of type 7 contact is that it cannot remove the element intersection that is present in the model.
- To avoid that kind of issue and edge related intersections, Type 11 contact is preferred.
- Type 11 works very much simular to that of type7 but the search is for only the edges of the model.
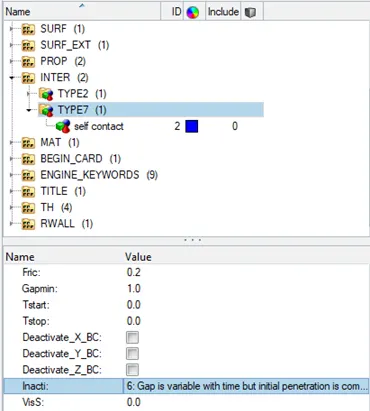
Figure 12
Important Interface Parameters
Igap: determines how the size of the gap is calculated
Gapmin: Minumum gap for activation of interface
Inacti: Action to take if initial penetrations exist
Istf: Affects how the stiffness of the interface is calculated
Iform: Friction formulation
Stmin: Minimum stiffness to use in the interface
Idel: what to do with slave nodes and master segments if element fails (deleted) that they are attached to
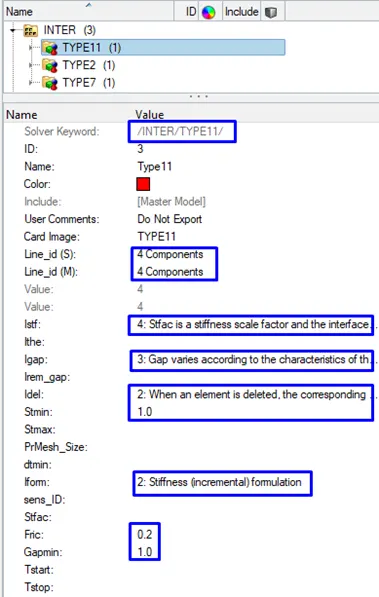
Figure 13: Interface Type11
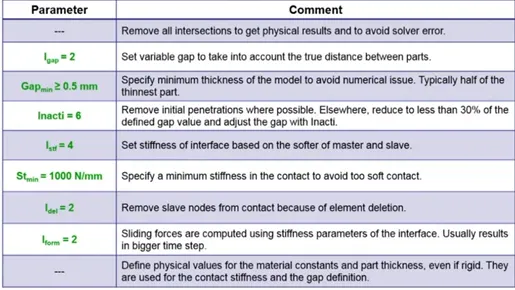
Figure 14: Recommendations for Crash Applications for Interface Type7 and Type11
Case 3.1: Plot RWALL forces, contact forces, internal energy
After the analysis completed, open Crush_tube_Case4_0001.out
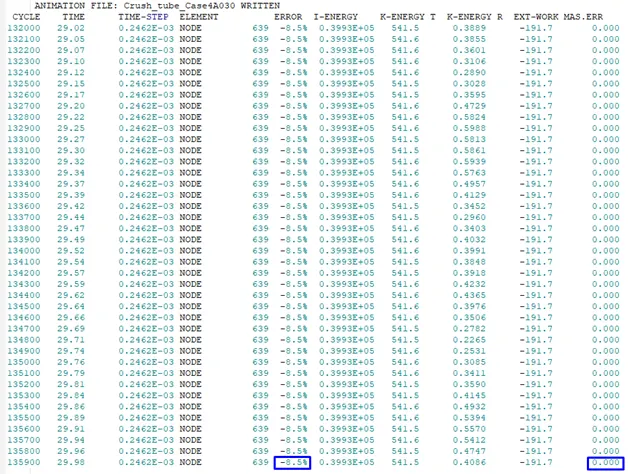
Figure 15
The error must be less than 15% at the end of the computation. The energy error is -8.5% and mass error is 0.000% at the end of the computation in the figure 15. The energy error is below the 15%. Therefore, the results are acceptable to plot energy graph.
In this case, the crush tube is deformed until 18ms. After 18 ms total resultant force is dramatically increasing up to 1535.8 more than case 1 and 2 (at the 25.3ms) because of requiring more forces to deform.
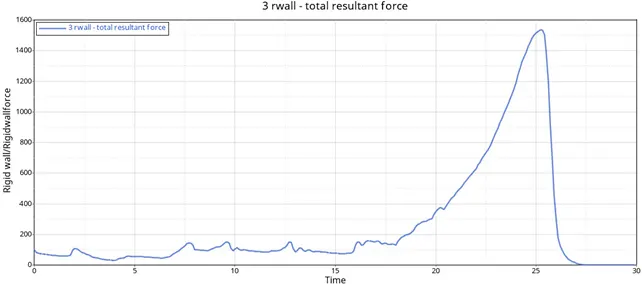
Figure 16: RWALL forces
Maximum Contact force is at 858.
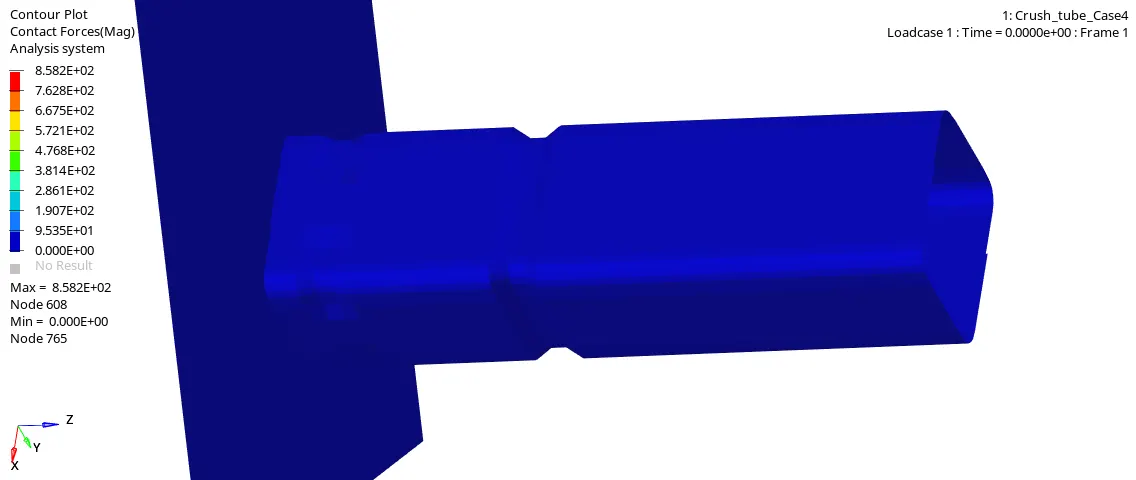
Figure 17: Contact Forces
After 20 ms, crush tube tries to deform more. Therefore, elements are coming more closely each other which increases contact energy until to 4039 (25.4ms) more than Case 1 and 2. After 26 ms, crush tube loses its contact with the Rigid wall where the contact energy is decreasing and its contour becomes flat.
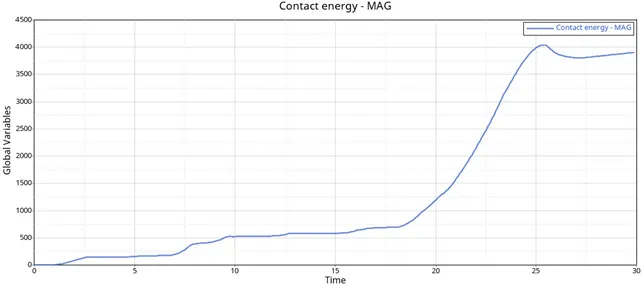
Figure 18: Contact Energy
The deformation of the crush tube is increasing, therefore the internal energy is increasing. After 25 ms, crush tube loses its contact with the Rigid wall where the contour of Internal energy becomes flat and stabel.
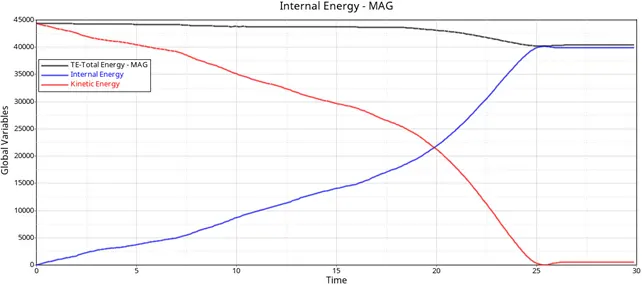
Figure 19: the counter of Energy
Case 4: Remove both notches and remove boundary condition on rigid body node then run
We will import Radios starter file Crush_tube_0000.rad. We will use again same Interface properties (/INTER/TYPE11 and /INTER/TYPE7) as case 3, but in this case boundary conditions and both notches are removed on the rigid body node (Figure 20-21).
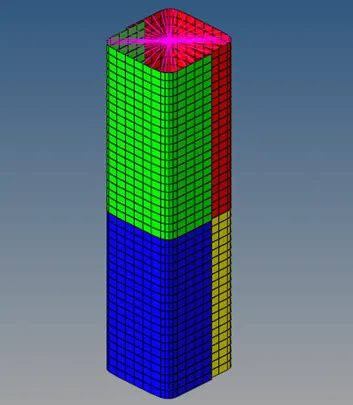
Figure 20: removed notched
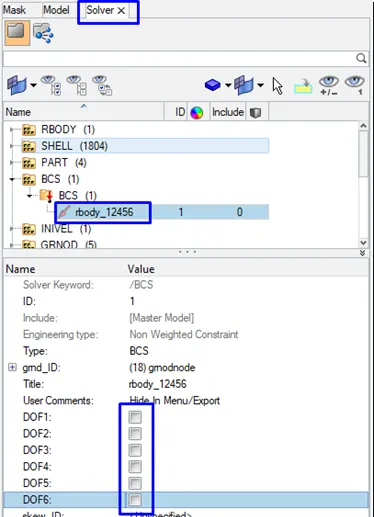
Figure 21
Case 4.1: Plot RWALL forces, contact forces, internal energy
After the analysis completed, open Crush_tub_Case5_0001.out

Figure 22
The error must be less than 15% at the end of the computation. The energy error is -9.2% and mass error is 0.000% at the end of the computation in the figure 20. The energy error is below the 15%. Therefore, the results are acceptable to plot energy graph.
In this case, the crush tube is deformed until 18ms. After 18 ms total resultant force is dramatically increasing up to 1144 little than case 1, 2 and 3 (at the 26.2ms) because of removing of the boundary conditions.
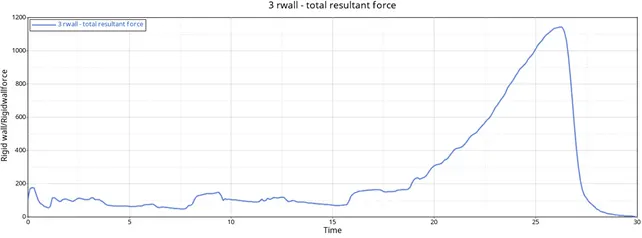
Figure 23: RWALL forces
Maximum Contact force is at 721.
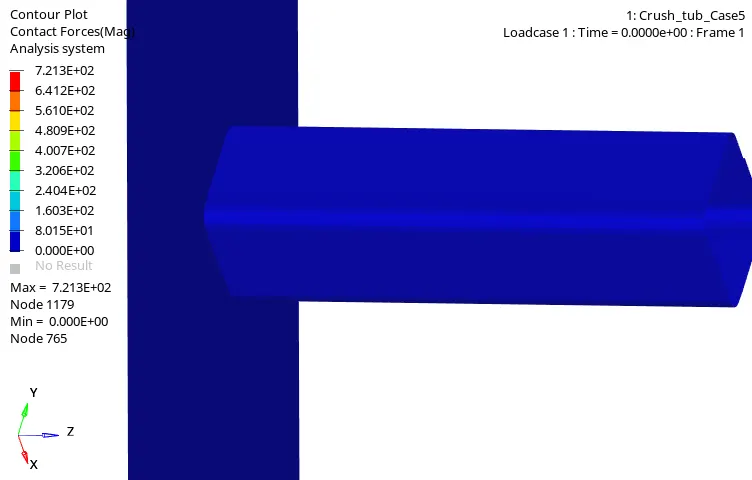
After 20 ms, crush tube tries to deform more. Therefore, elements are coming more closely each other which increases contact energy until to 4584 (26.3ms) more than other last cases. After 26 ms, crush tube loses its contact with the Rigid wall where the contact energy is decreasing and its contour becomes flat.
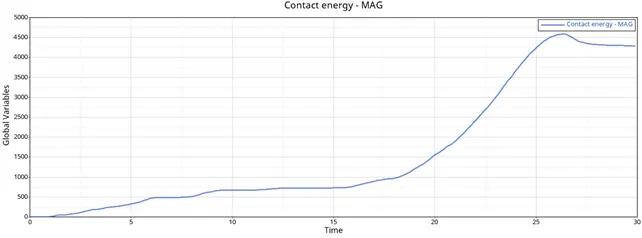
Figure 25: Contact Energy
The deformation of the crush tube is increasing, therefore the internal energy is increasing. After 25 ms, crush tube loses its contact with the Rigid wall where the contour of Internal energy becomes flat and stabel.
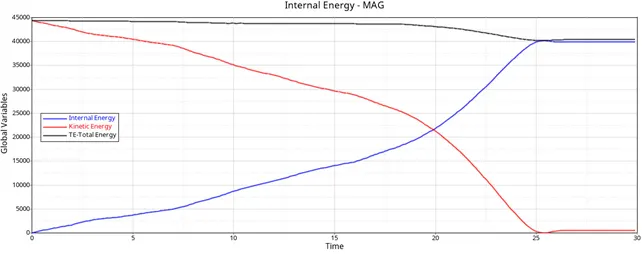
Figure 26: the counter of Energy
Case 5: Create a new notch in the middle, select the whole section and run
We will use again same model and Interface properties (/INTER/TYPE11 and /INTER/TYPE7) and boundary conditions as Case 4 (Crush_tub_Case5_0000.rad). But in this case, we create a new notch in the middle of the model (Figure 26).
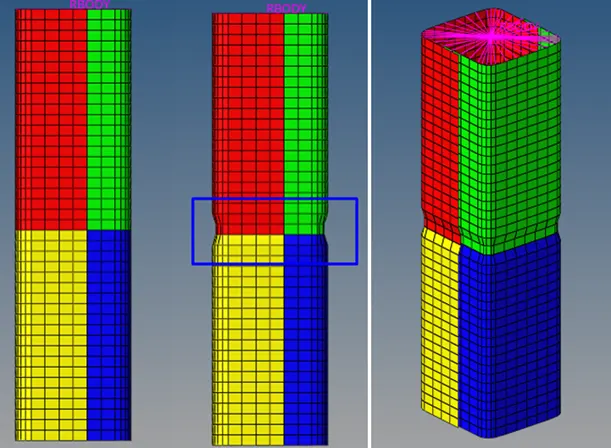
Figure 27: notch in the middle of the model
Case 5.1: Plot RWALL forces, contact forces, internal energy
After the analysis completed, open Crush_tub_Case6_0001.out

Figure 28
The error must be less than 15% at the end of the computation. The energy error is -10% and mass error is 0.000% at the end of the computation in the figure 25. The energy error is below the 15%. Therefore, the results are acceptable to plot energy graph.
Maximum total resultant force is 1389.2 at the time 25.3.
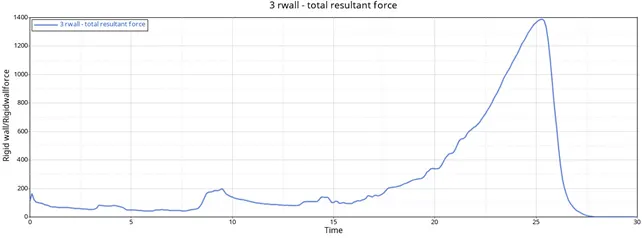
Figure 29: RWALL forces
Maximum Contact force is at 826.
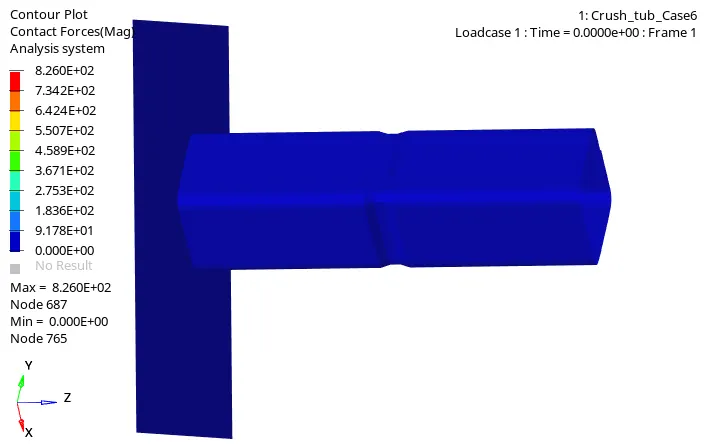
Figure 30: Contact Forces
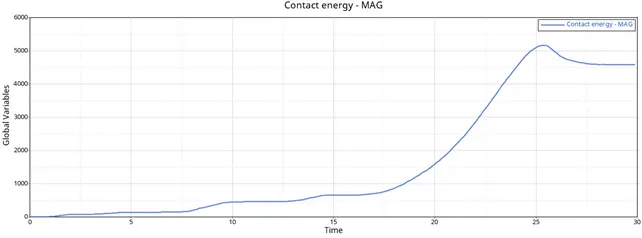
After 18 ms, crush tube tries to deform more. Therefore, elements are coming more closely each other which increases contact energy until to 5168 (25.4ms) more than other last cases. After 26 ms, crush tube loses its contact with the Rigid wall where the contact energy is decreasing and its contour becomes flat.
The deformation of the crush tube is increasing, therefore the internal energy is increasing. After 25 ms, crush tube loses its contact with the Rigid wall where the contour of Internal energy becomes flat and stabel.
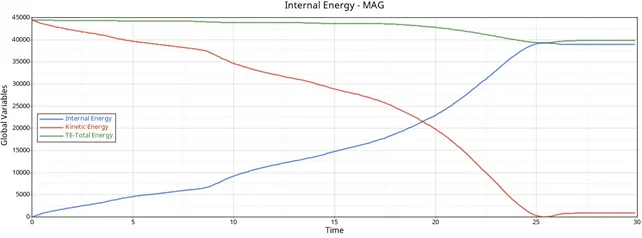
Figure 31: the counter of Energy
Case 6: Create a new notch with nodes only from opposing 2 faces and run
We will use again same model and Interface properties (/INTER/TYPE11 and /INTER/TYPE7) and boundary conditions as Case 5 (Crush_tub_Case6_0000.rad). But in this case, we create a new notch with nodes only from opposing 2 faces in the middle of the model (Figure 31 ).
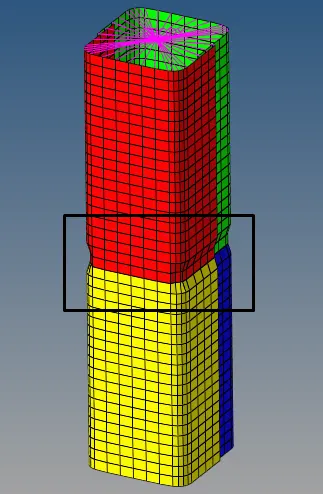
Figure 32: notch with nodes only from opposing 2 faces in the middle of the model
Case 6.1: Plot RWALL forces, contact forces, internal energy
After the analysis completed, open Crush_tub_Case7_0001.out
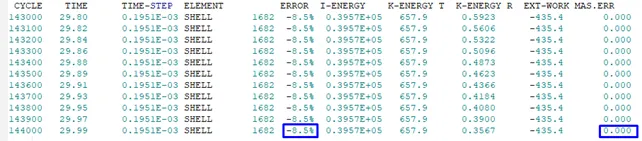
Figure 33:
The error must be less than 15% at the end of the computation. The energy error is -8.5% and mass error is 0.000% at the end of the computation in the figure 32. The energy error is below the 15%. Therefore, the results are acceptable to plot energy graph.
In this case, the crush tube is deformed until 18ms. After 18 ms total resultant force is dramatically increasing up to its maximum value to 1571 more than all of cases because of creating notchs only from opposing 2 faces.
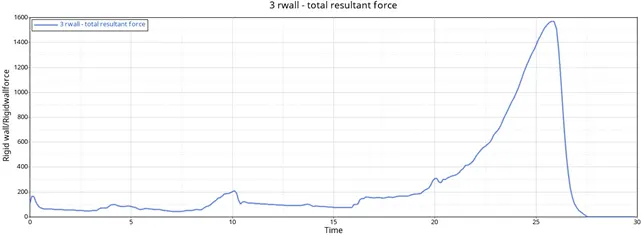
Figure 34: RWALL forces
Maximum Contact force is at 609
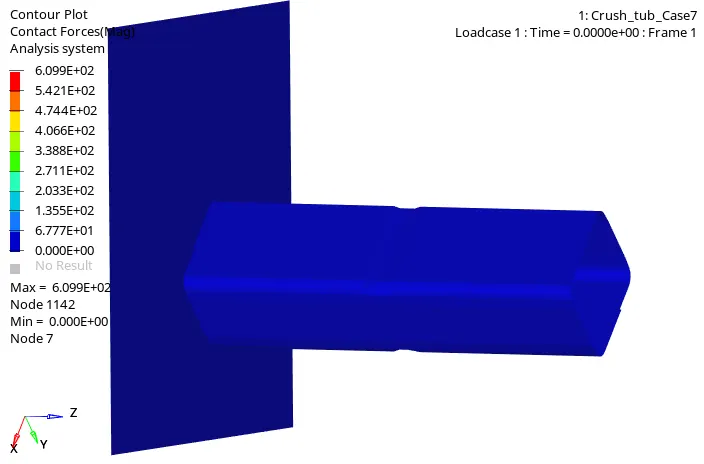
Figure 35: Contact Forces
After 18 ms, crush tube tries to deform more. Therefore, elements are coming more closely each other which increases contact energy until to 4236 (25.9ms) more than other first three cases. After 26 ms, crush tube loses its contact with the Rigid wall where the contact energy is decreasing and its contour becomes flat.
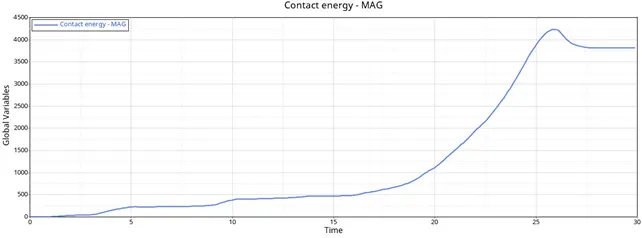
The deformation of the crush tube is increasing, therefore the internal energy is increasing. After 25 ms, crush tube loses its contact with the Rigid wall where the contour of Internal energy becomes flat and stabel.
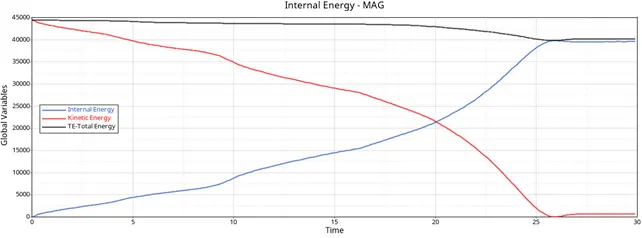
Figure 36:the counter of Energy
Conclusion
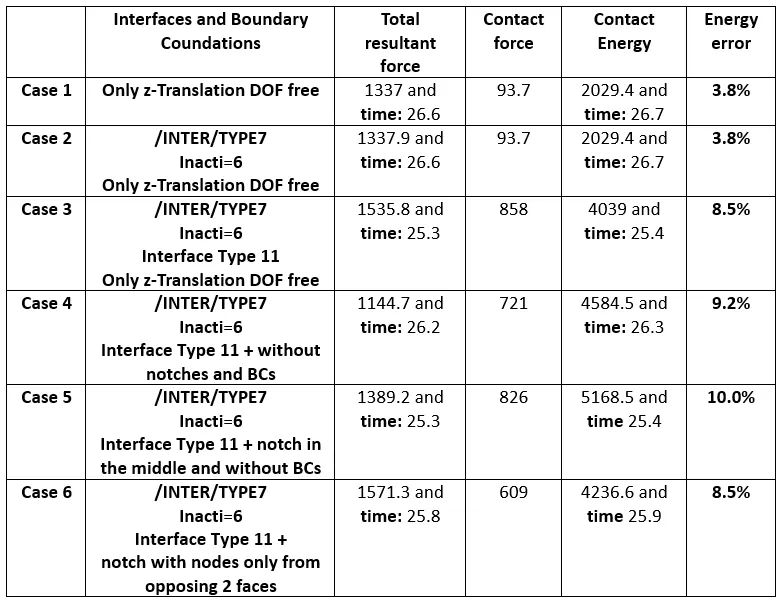
The last resultant force in the Case 6 is reached its maximum value to deform among the other cases. Case 1 and 3 have the same resultant force at the end of the simulation. Therefore, Case 6 provides best geomerical solution which has notches only from opposing 2 faces. Therefore It is more stiffer than other cases. The contact forces in the case 2 and 3 are the same value due to the same number of notches and BCs. After Interface type 11 is added, the contact forces increases.