Assignment 4-RADIOSS Material Laws Challenge
Objective
A rigid sphere is crashing to a metallic circular plate. We will use different failure models to simulate crack or rupture of the plate. There are 7 Cases in the below which are studied and compared with each other on this work.
Case 1: Law2_Eps_max_Failure
Case 2: Law2_Eps_max_Crack
Case 3: Law2_Eps_max_nofail
Case 4: Law2
Case 5: Law1
Case 6: Law27 (Plastic_Brit)
Case 7: Law36_Plast_tab
For each case, we will discuss and document the points which are seen in the below.
1. Total number of cycles, Energy error, mass error and simulation time.
2. Notice the animation of all 5 and describe the animations in brief on the
basis of whether the elements are being deleted or cracked.
3. Plot energies and notice any difference.
4. Based on all the results, which case would represent the on-field
scenario.
5. Prepare a ppt/docx and list down case by case result and your conclusion
as to why the failure happened.
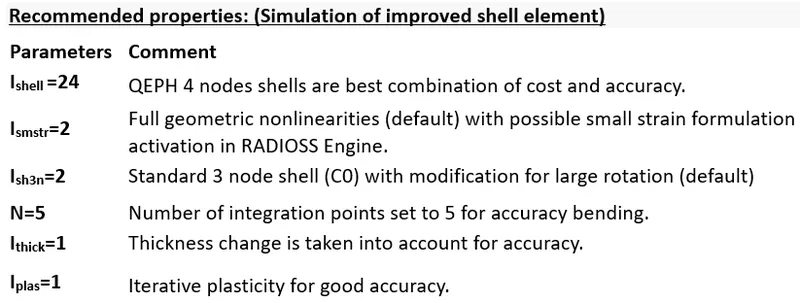
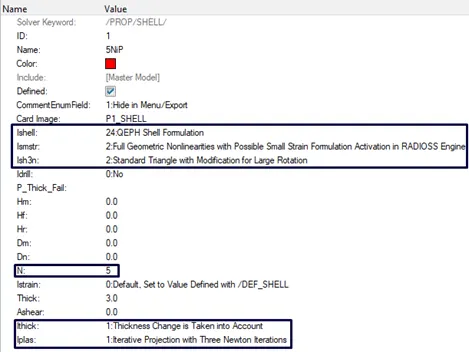
We will use same recommended properties of shell elements for each case as seen below.
Case 1: Law2_Eps_max_Failure
In this case, /MAT/LAW2 (PLAS_JOHNS) is used with Failure Johnson card (figure 2). The Law2 is an isotropic elasto-plastic material using the Johnson-Cook material model which expresses material stress as a function of strain, strain rate and temperature. In this material model, a built-in failure criterion based on the maximum plastic strain is available.
We will import Radios starter file FAILURE_JOHNSON_0000.rad
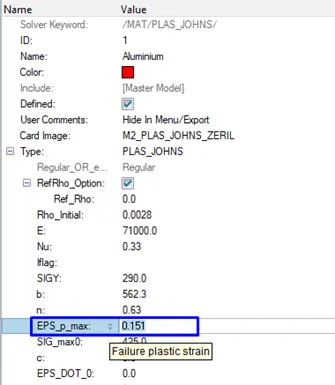
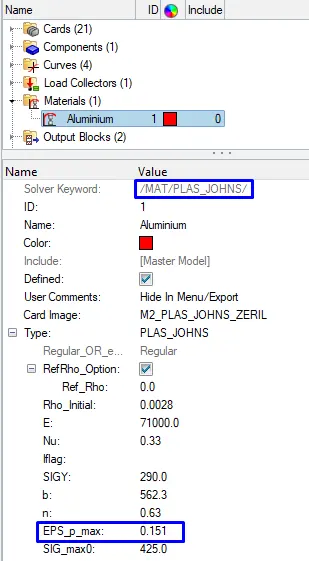
For the material failure criterion, max failure plastic strain (Eps_max_Failure) is given as EPS_p_max= 0.151 in the below figure 1.
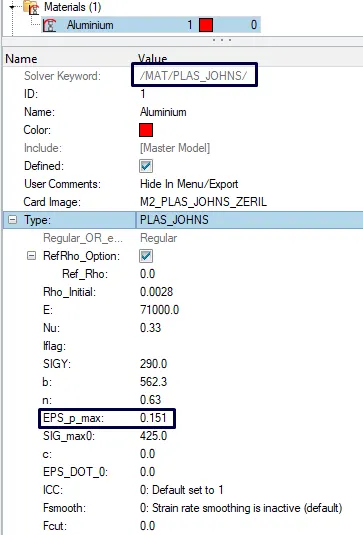
Figure 1: Max failure plastic strain
I_fail_sh=2, Shell failure flag. For each integration point, the stress tensor is set to zero when the plastic strain (eps_p) is equal to or greater than tensile failure strain value (eps_f). The shell is deleted or cracked when  for all integration points or layers.
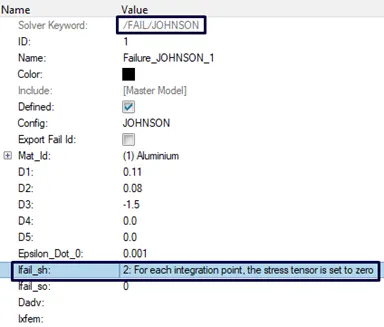
Figure 2: Failure Johnson card
Case 1.1: Total number of cycles, Energy error, mass error and simulation time
Case 1 file> FAILURE_JOHNSON_0001.out> open it with notepad
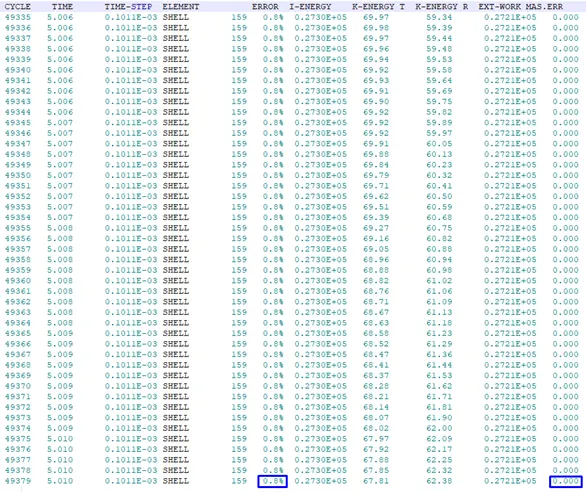
Figure 3: Energy and mass errors
- Energy Error: 0.8%
- Mass Error: 0%
The error must be less than 15% at the end of the computation. The energy error is 0.8% and mass error is 0.000% at the end of the computation in the figure 3. The energy error is below the 15%. Therefore, the results are acceptable to plot energy graph.
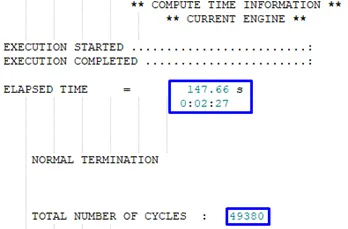
- Total number of cycles: 49380
- Compute time: 147.66s
Case 1.2: describe the animations in brief on the basis of whether the elements are being deleted or cracked
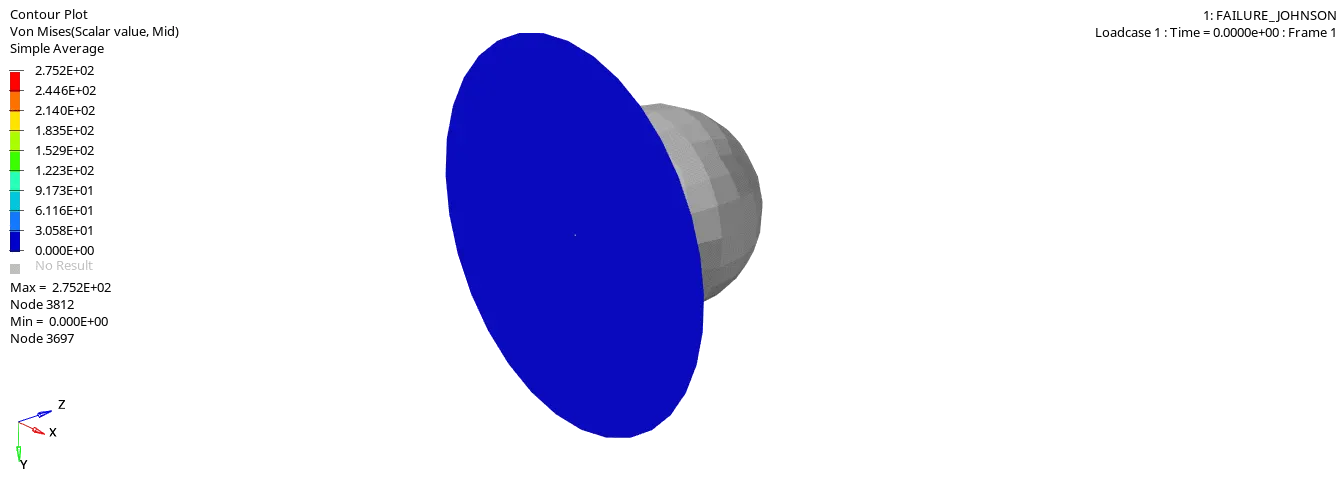
Figure 4: Animation LAW2 (PLAS_JOHNS) with Failure Johnson card
Total resultant force is increasing with the time (figure5). We can not observe any deleted or cracked element until maximum of total resultant force reaches at the time 3.76s (figure 5-6).
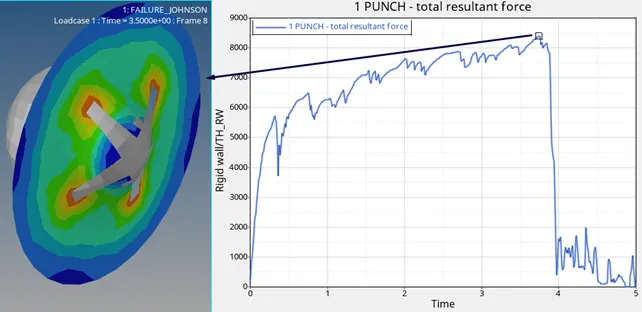
Figure 5: Total resultant force
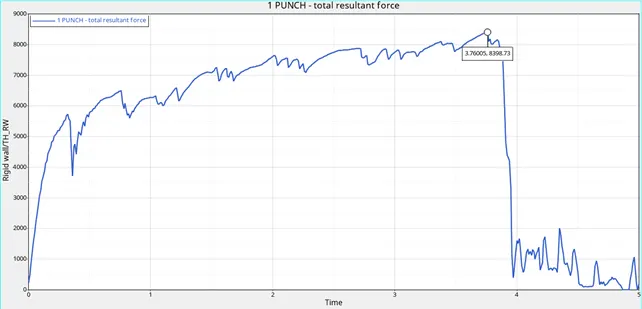
Figure 6: Time of maximum total resultant force
After 3.76 s, the elements are being deleted (removed). Because the maximum plastic strain values are reached for all integration points or layers. As a result of element deletion, total resultant force is suddenly decreasing (figure 7). As element failure criteria, we set Ixfem=0, therefore, we can not observe any crack propogation.
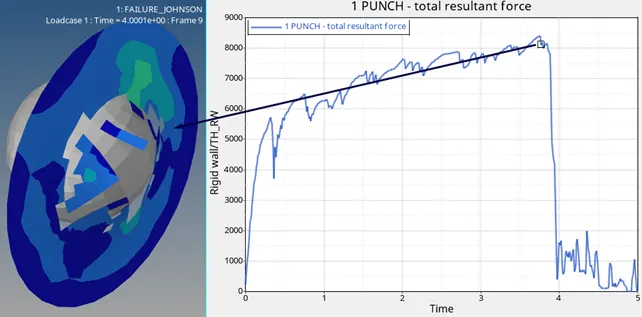
Figure 7
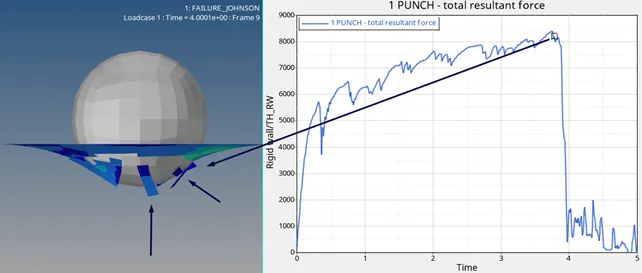
Case 1.3. Plot energies and notice any difference
The Internal energy is increasing until the elements are deleted at 3.76s
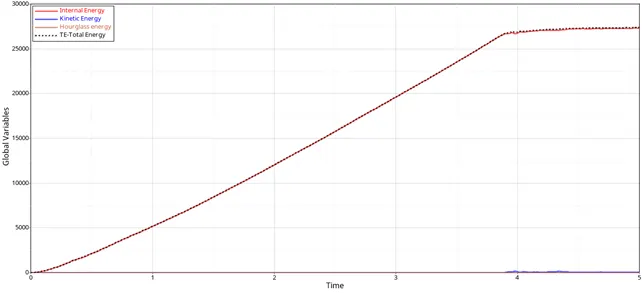
Case 2: Law 2 with EPS Max Crack
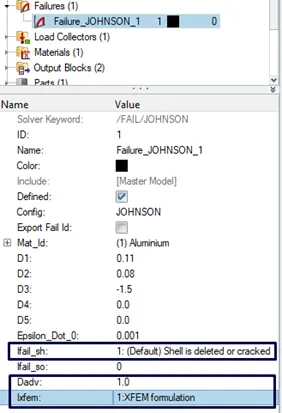
In this case, we will use again /MAT/LAW2 (PLAS_JOHNS) with /FAIL/JOHNSON criteria which consists of different parameters like Ifail_sh=1, Dadv=1 and Ixfem=1 compared to Case1.
- Ifail_sh (Shell failure flag) = 1, Shell is deleted or cracked when
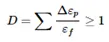 for one integration point or layer.
 - Ixfem=1 is activated, the failure criteria will lead to element cracking instead of element or layer deletion.
- Dadv =1.0 Criterion for the crack advancement. It is only active if with Ixfem =1. It is real number between 0 and 1. Then Dadv =1.0 is max accumulation damage value D, used for crack initiation.
Maximum plastic failure strain (EPS_p_max) is given as 0.151
Case 2.1:Total number of cycles, Energy error, mass error and simulation time
Case 2 file> FAILURE_JOHNSON_0001.out> open it with notepad
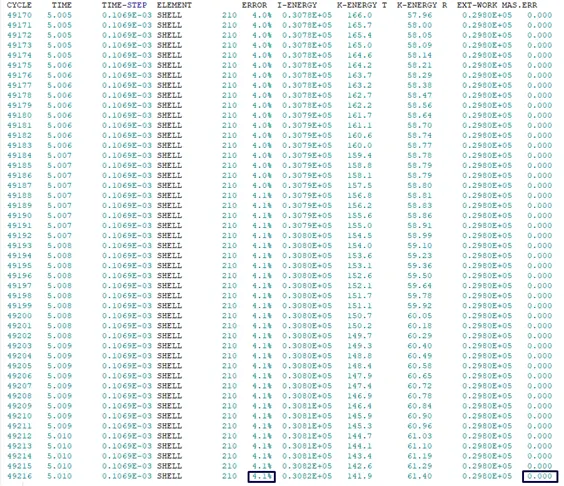
Figure 8: Energy and mass errors
- Energy Error: 4.1%
- Mass Error: 000%
The error must be less than 15% at the end of the computation. The energy error is 4.1% and mass error is 0.000% at the end of the computation in the figure 8. The energy error is below the 15%. Therefore, the results are acceptable to plot energy graph.
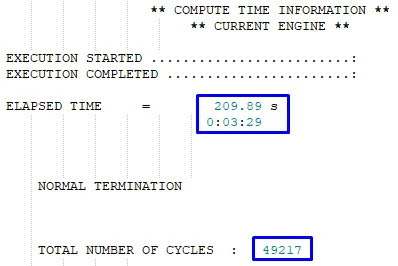
- TOTAL NUMBER OF CYCLES : 49217
- Compute time: 209.89s
Case 2.2: describe the animations in brief on the basis of whether the elements are being deleted or cracked.
In the below simulation (fig.9), we see the course of crack propagation and deletion of elements.
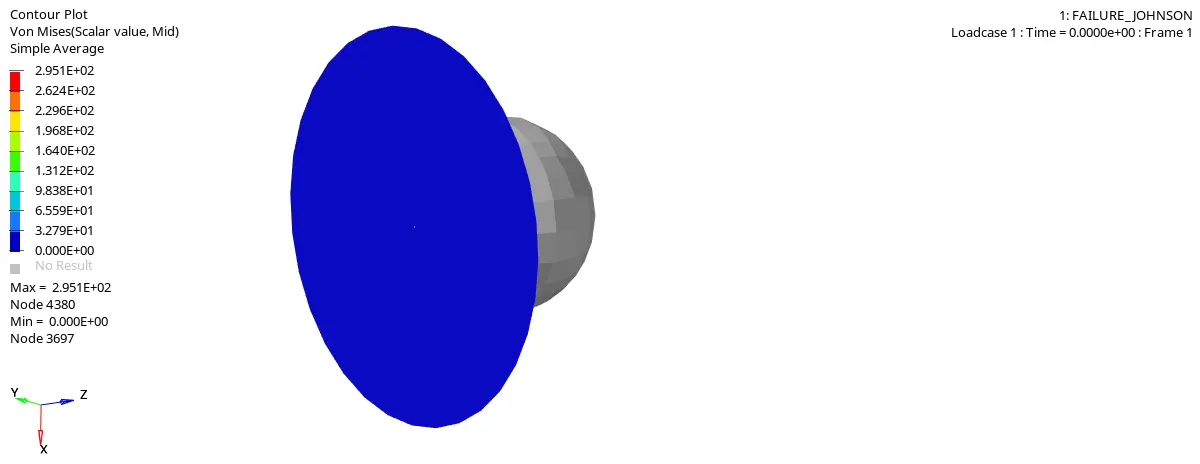
Figure 9: Animation Law2 with EPS-MAX_Crack
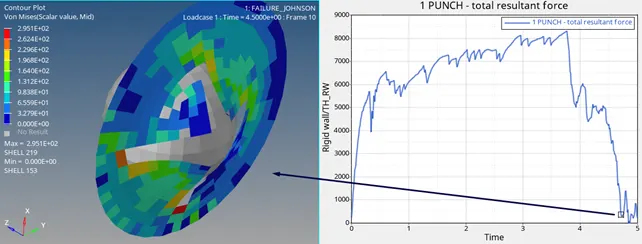
Figure 10: course of crack propagation
In this case, we use Ixfem=1, if the element cracked reaches the crack criteria. Therefore we can observe crack propagation (Fig. 10) up to 4.71 s (Fig. 10-11) before the elements are removed.
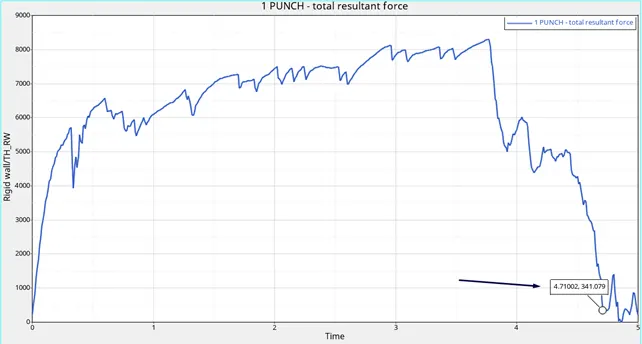
Figure 11
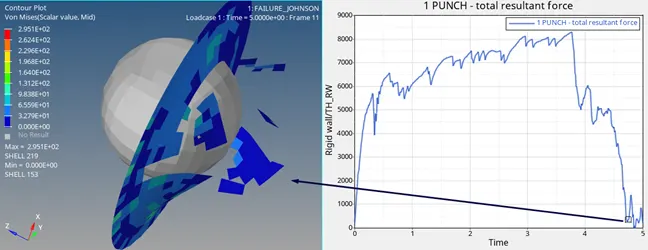
Figure 12: deletetion of the elements (Case 2)
At the 4.73 s (Fig.12-13), the element are deleted (Fig.12). In the Case 2, the time takes longer for deletion of the elements in comparision to Case 1
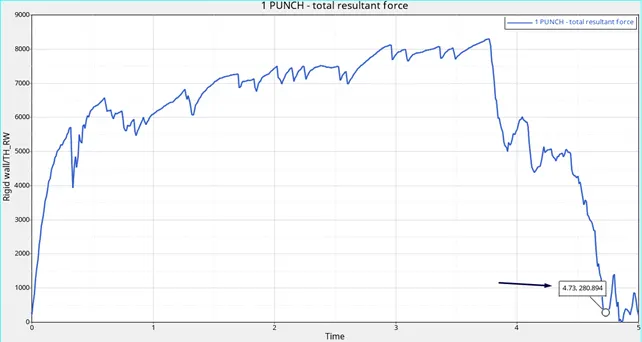
Figure 13
Case 2.3. Plot energies and notice any difference
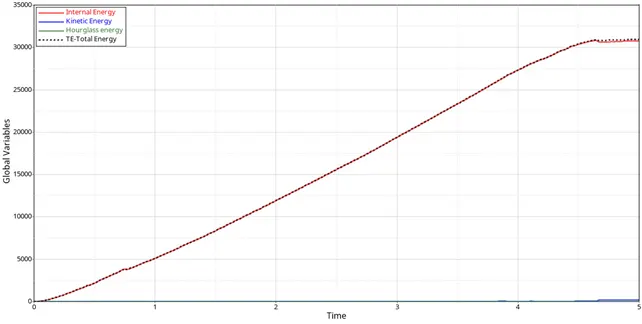
Energy plot shows that the internal energy reaches its maximum value at 4.7s. Because, we set Ifail_sh=1, Dadv=1 and Ixfem=1 for this case. These values allow for deletion of the elements after crack propagation.
Case 3: Law2 Eps max nofail
In this case, we will use again /MAT/LAW2 (PLAS_JOHNS) but /FAIL/JOHNSON card is deleted.
Maximum plastic failure strain (EPS_p_max) is given as 0.151 same as Case 1 and 2. For this material model, when the calculated plastic strain reaches the value of EPS_p_max in one integration point, then the corresponding shell element is deleted.
Case 3.1:Total number of cycles, Energy error, mass error and simulation time
Case 3 file> NOFAILURE_JOHNSON_0001.out> open it with notepad
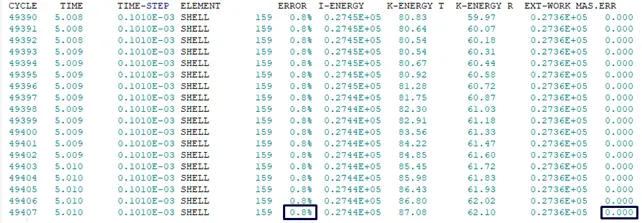
Figure 14: Energy and mass errors
- Energy Error: 0.8%
- Mass Error: 0%
The error must be less than 15% at the end of the computation. The energy error is 0.8% and mass error is 0.000% at the end of the computation in the figure 14. The energy error is below the 15%. Therefore, the results are acceptable to plot energy graph.
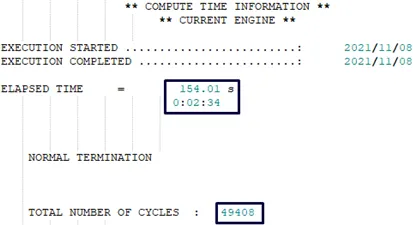
- Compute time:154.01s
- TOTAL NUMBER OF CYCLES : 49408
Case 3.2: describe the animations in brief on the basis of whether the elements are being deleted or cracked
In the below simulation (fig.9), we see how the elements are deleted.
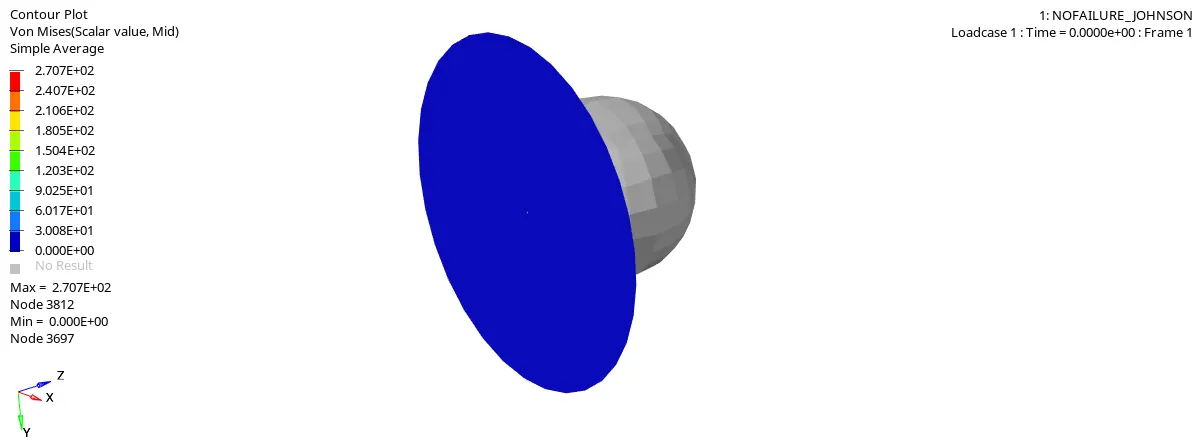
Figure 15: Simulation Case 3 ( Law2_eps_max_nofail)
We observe that the calculated plastic strain reaches the value of EPS_p_max (0.151) in one integration point, then the corresponding shell element is deleted (Fig.16).
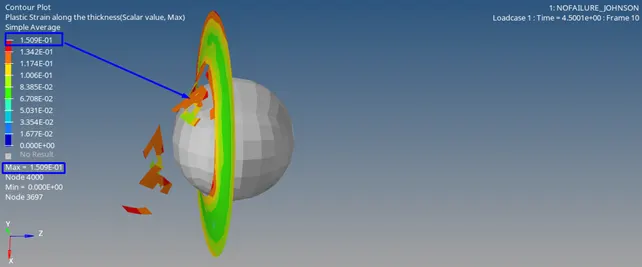
Figure 16: plastic strain along the thickness (deletetion of the elements for Case 3)
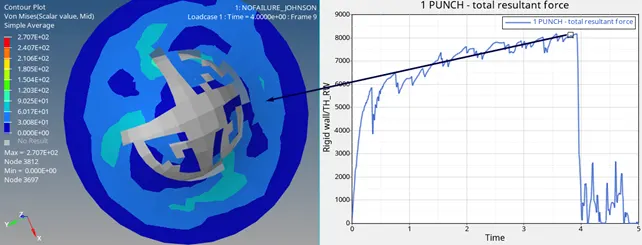
Figure 17: deletetion of the elements (Case 3)
At the 3.84 s (Fig.17-18), the element are deleted (Fig.17). In the Case 3, the time takes longer for deletion of the elements in comparision to Case 1 but it is faster than Case 2.
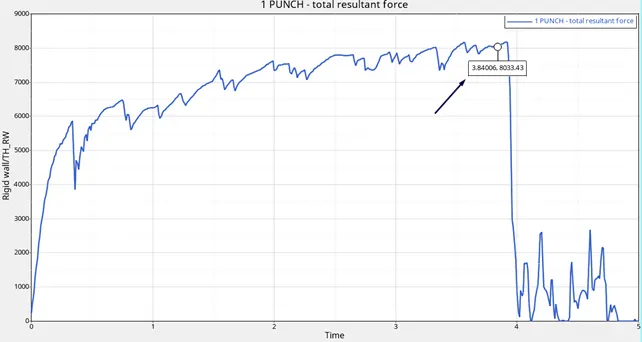
Figure 18
Case 3.3. Plot energies and notice any difference
The Internal energy is increasing until the elements are deleted at 3.84s. the counter of plot is almost same as in Case 1.
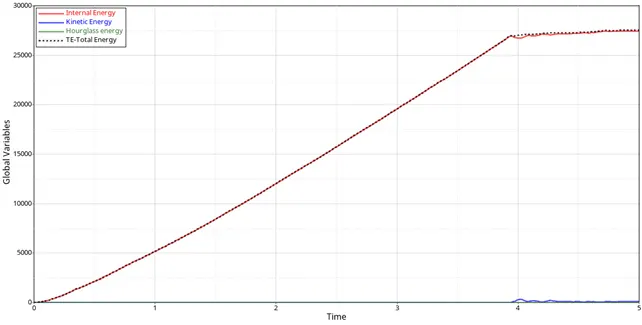
Figure 19
Case 4: Law 2 (PLAS_JOHNS)
In this case, we will use again /MAT/LAW2 (PLAS_JOHNS) as in Case 1-2 and 3. But, /FAIL/JOHNSON card and Maximum plastic failure strain (EPS_p_max=0.151) are deleted. This law represents an isotropic elasto-plastic material using the Johnson-Cook material model. This model expresses material stress as a function of strain, strain rate and temperature. A built-in failure criterion based on the maximum plastic strain is available.
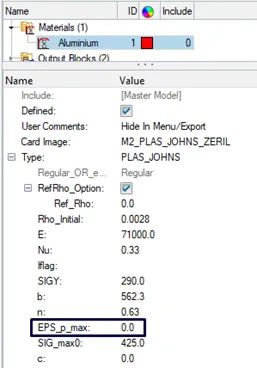
Figure 20: LAW2 (PLAS_JOHNS) without using /FAIL/JOHNSON and EPS_p_max
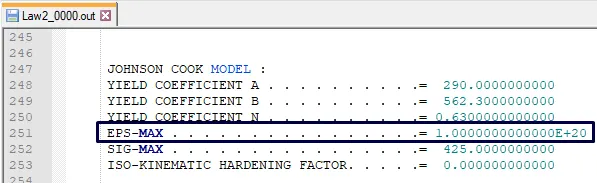
Since the failure card is been deleted, after analysis is completed, we will open Law2_0000.out with Notepad. As we see, the solver sets EPS_p_max (Eps-Max) value is 1E+20.
Case 4.1:Total number of cycles, Energy error, mass error and simulation time
Case 4 file> Law2_0001.out> open it with notepad

Figure 21: Energy and mass errors
- Energy Error: 3.0%
- Mass Error: 0%
The error must be less than 15% at the end of the computation. The energy error is 3.0% and mass error is 0.000% at the end of the computation in the figure 21. The energy error is below the 15%. Therefore, the results are acceptable to plot energy graph.
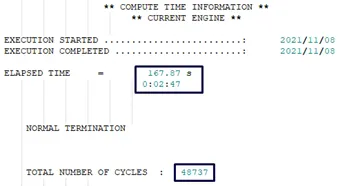
- Compute time: 167.87 s
- TOTAL NUMBER OF CYCLES : 48737
Case 4.2: describe the animations in brief on the basis of whether the elements are being deleted or cracked
Until the simulation completes, elements are not getting cracked or deleted. (fig.22-23-24)
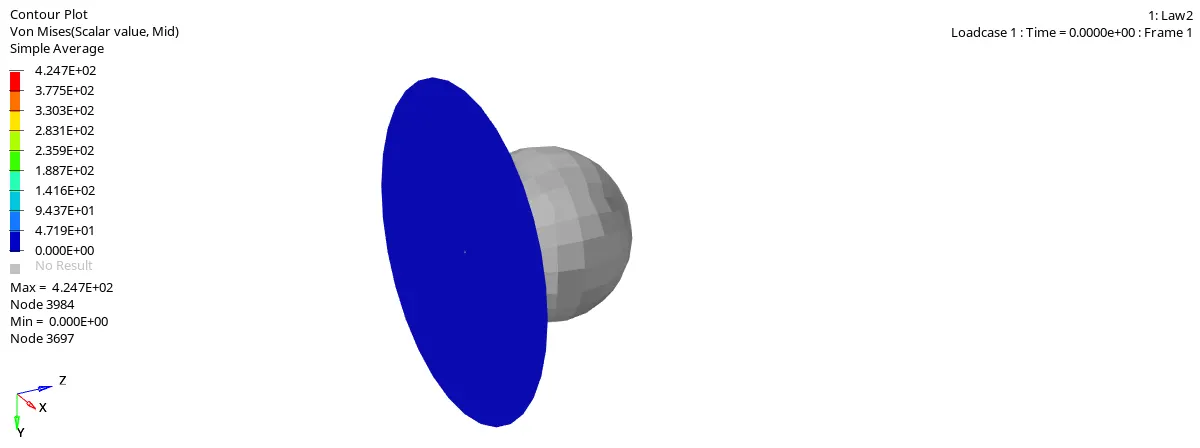
Figure 22. Simulation Law2_EPS_MAX=0
Because the solver sets Eps-Max value as 1E+20. Maximum plastic strain is 1.204 (fig.23), it is extremelly small value to compare with the value 1E+20 which is set by the solver.
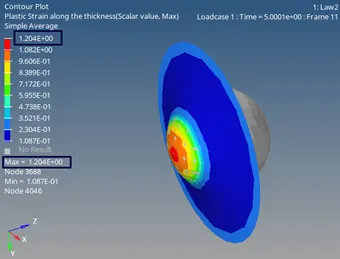
Figure 23: Maximum plastic strain
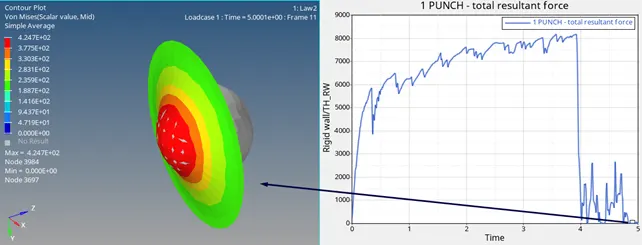
Figure 24
Therefore we can compare max von Mises stress value with stress values of the other Cases. Max von Mises stress value of the case 3 is 424Mpa which is higher than the Case 1-2-3.
Case 4.3. Plot energies and notice any difference
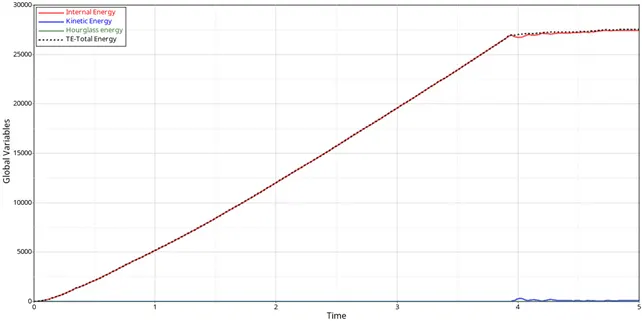
The Internal energy is increasing with the time and the counter of plot is quite same as in Case 3.
Case 5: Law1 elastic with same density, E, nu
/MAT/LAW1 (ELAST) defines an isotropic, linear elastic material using Hooke's law. This law represents a linear relationship between stress and strain. In this case, we will use same density, Young's modulus (E) and Poisson's ratio (nu) (fig.25).
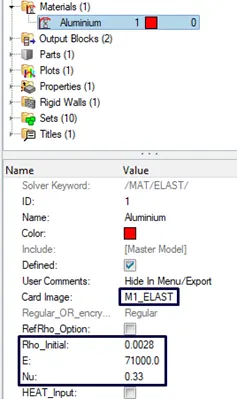
Figure 25:
Case 5.1:Total number of cycles, Energy error, mass error and simulation time
Case 5 file> Law1_0001.out> open it with notepad

Figure 26: Energy and mass errors
- Energy Error: 1.3%
- Mass Error: 0%
The energy error is 1.3% and mass error is 0.000% at the end of the computation in the figure 26. The energy error is below the 15%. Therefore, the results are acceptable to plot energy graph.
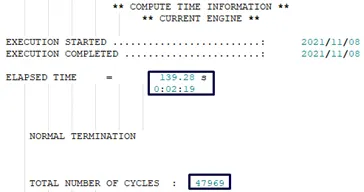
- Compute time:139.28 s
- TOTAL NUMBER OF CYCLES : 47969
Case 5.2: describe the animations in brief on the basis of whether the elements are being deleted or cracked
The circular plate shows elastic material behaviour due to the material law1 which is used. We can not observe any crack propagation or deleted elements.
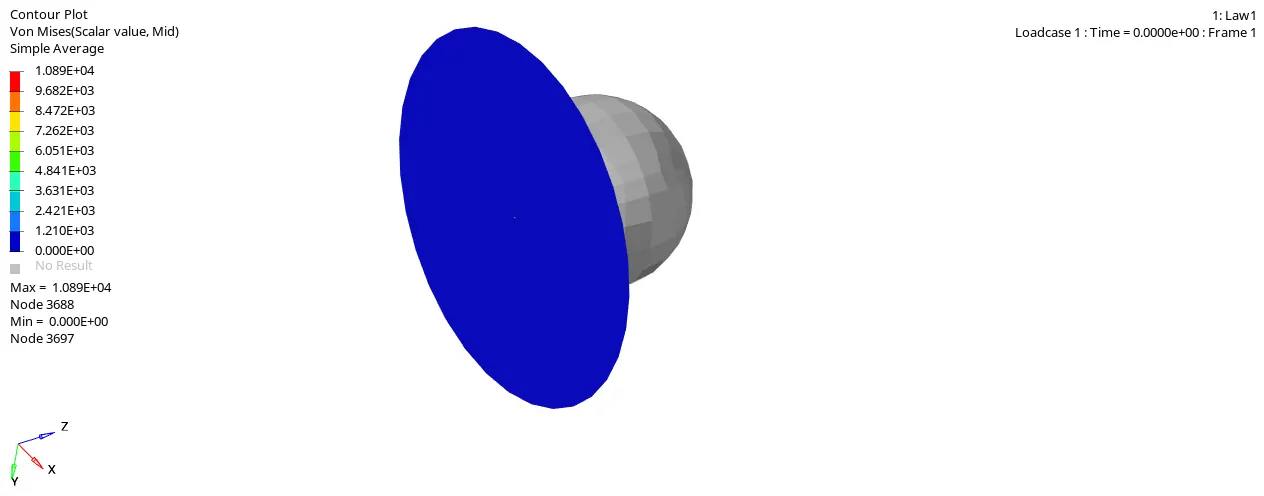
Figure 27: Simulation with /MAT/LAW1 (ELAST)
Total resultant force is increasing with the time during the simulation. Resultant force, Internal energy and von Mises stress are higher than other cases. (fig 28-29)
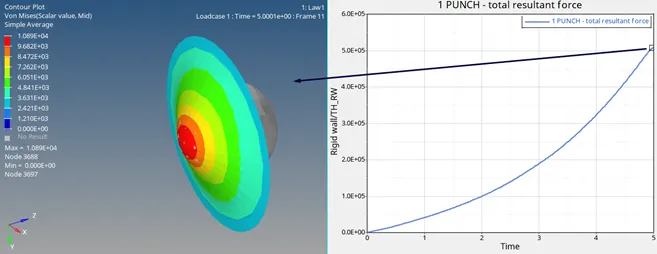
Figure 28:
Case 5.3. Plot energies and notice any difference
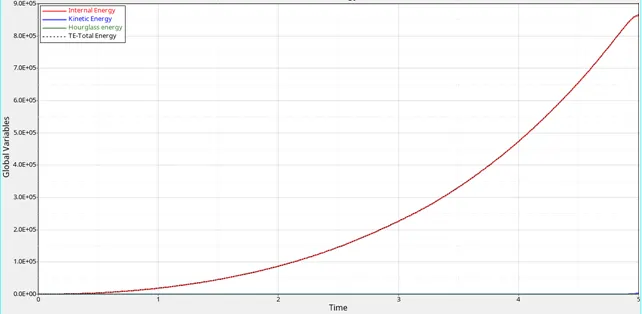
Figure 29
Case 6: Law 27 (PLAS_BRIT) with EPS based Failure
/MAT/LAW27 (PLAS_BRIT) combines an isotropic elasto-plastic Johnson-Cook material model with an orthotropic brittle failure model. Material damage is accounted for prior to failure. Failure and damage occur only in tension. This law is applicable only for shells.
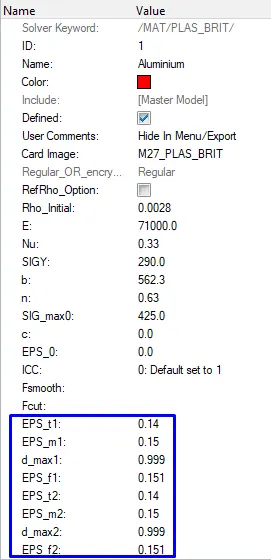
Figure 30: properties of the /MAT/LAW27
In /MAT/LAW27 (PLAS_BRIT), the material behaves as a linear-elastic material when the equivalent stress is lower than the plastic yield stress. For higher stress values, the material behavior is plastic. This law allows the modeling of material damage and brittle failure in two principal directions (1 and 2). If the tensile strain is reached to maximum tensile strain (EPS_f1 or EPS_f2), elements are deletet in principal strain direction 1 or 2.
Case 6.1:Total number of cycles, Energy error, mass error and simulation time
Case 6_Law27 (Plastic_Brit)>Open: LAW27_0001.out with Notepad

Figure 31: Energy and mass errors
- Energy Error: 0.8%
- Mass Error: 0%
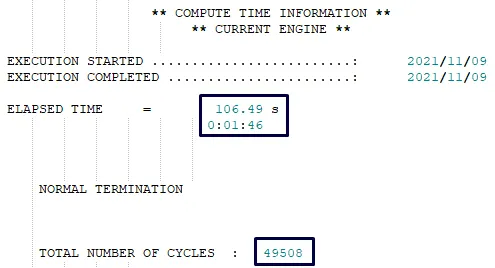
The error must be less than 15% at the end of the computation. The energy error is 0.8% and mass error is 0.000% at the end of the computation in the figure 31. The energy error is below the 15%. Therefore, the results are acceptable to plot energy graph.
- TOTAL NUMBER OF CYCLES : 49508
- Compute time:49 s
Case 6.2: describe the animations in brief on the basis of whether the elements are being deleted or cracked
The circular plate shows brittle behaviour due to the material LAW27 which is used. We can observe deleted elements which are broken in the below figure 32.
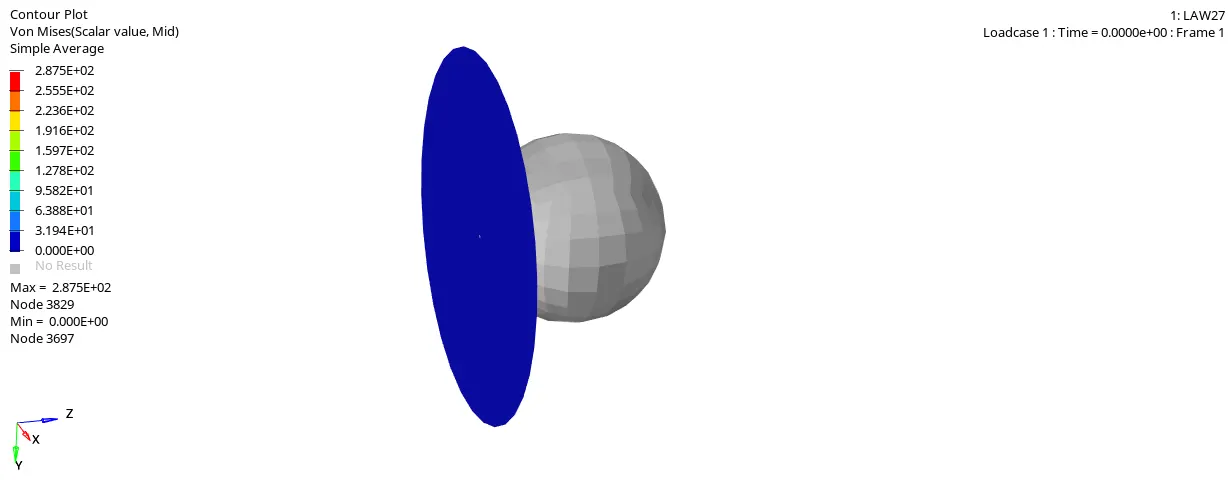
Figure 32: Simulation with /MAT/LAW27
We can observe that the circular plate breaks at the 4.3s (figure 33-34)
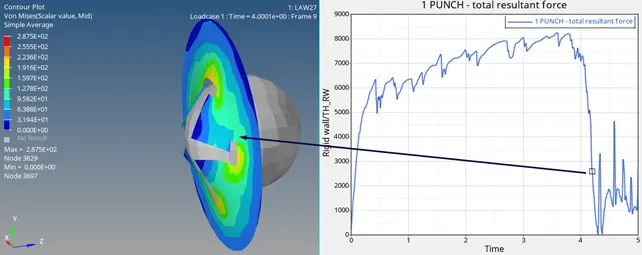
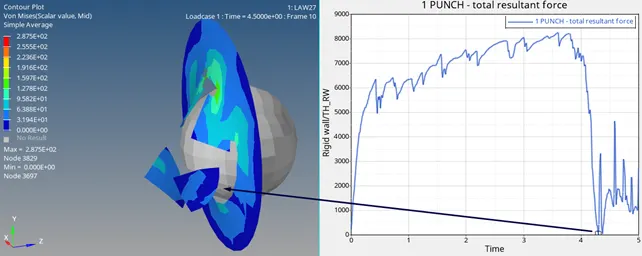
Figure 33: fracture of the circular plate at the time 4.3s
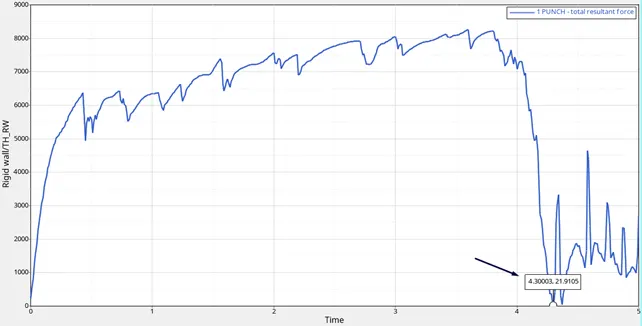
Figure 34: fracture time of the circular plate
Case 6.3: Plot energies and notice any difference
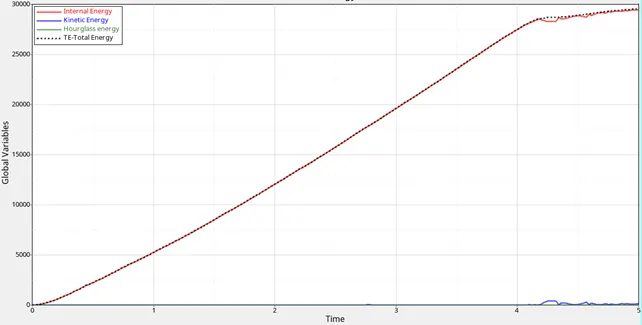
Internal energy is increasing with the time even after the elements are removed at the time 4.3s because of the strain energy is dissipated with breaking of the circular plate. Hourglass energy at the time 4.3s is increasing where the elements are removed.
Case 7: Law 36 Plast_TAB (Plastic-True-Stress-Strain Curve)
/MAT/LAW36 (PLAS_TAB): This law models an isotropic elasto-plastic material using user-defined functions for the work-hardening portion of the stress-strain curve (for example, stress vs. plastic strain) for different strain rates.
The first point of yield stress functions (plastic strain vs stress) should have a plastic strain value of zero. If the last point of the first (static) function equals 0 in stress, default value of ε_p_max is set to the corresponding value of ε_p. If ε_p (plastic strain) reaches ε_p_max in one integration point, the element is deleted.
The values of Plastic-True-Stress-Stain graph (Fig.35) is given in the class (Part7- Materials).
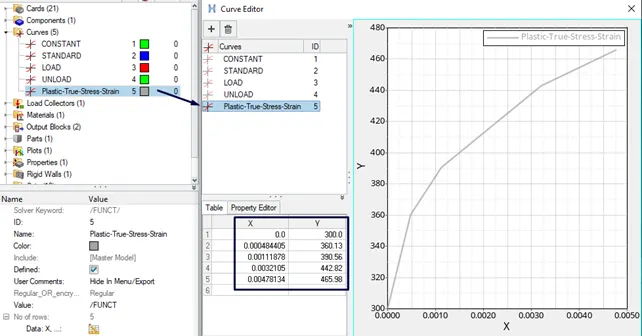
Figure 35: the curve of plastic stress strain
Case 7.1: Total number of cycles, Energy error, mass error and simulation time
Case7_Law36_Plast_tab > Law36_Plast_tab_0001.out open with Notepad

Figure 36: Energy and mass errors
- Energy Error: -1.7%
- Mass Error: 0%
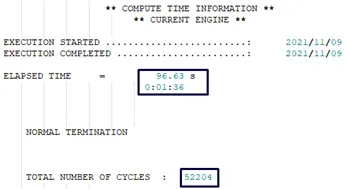
The error must be less than 15% at the end of the computation. The energy error is 1.7% and mass error is 0.000% at the end of the computation in the figure 36. The energy error is below the 15%. Therefore, the results are acceptable to plot energy graph.
- Compute time:96.63s
- TOTAL NUMBER OF CYCLES: 52204
Case 7.2: describe the animations in brief on the basis of whether the elements are being deleted or cracked
We can observe deleted elements which are broken in the below figure 37.
Maximum Plastic strain (EPS_p_max=0.00478134) from plastic stress-strain curve (Fig.35) in case 7 is quite smaller than maximum tensile failure strain in principal strain (Eps_m1=0.15, Eps_m2=0.15) direction 1 and 2 in case 6.
Therefore, the circular plate shows more brittle behaviour than Case 6 due to the material LAW36 which is used.
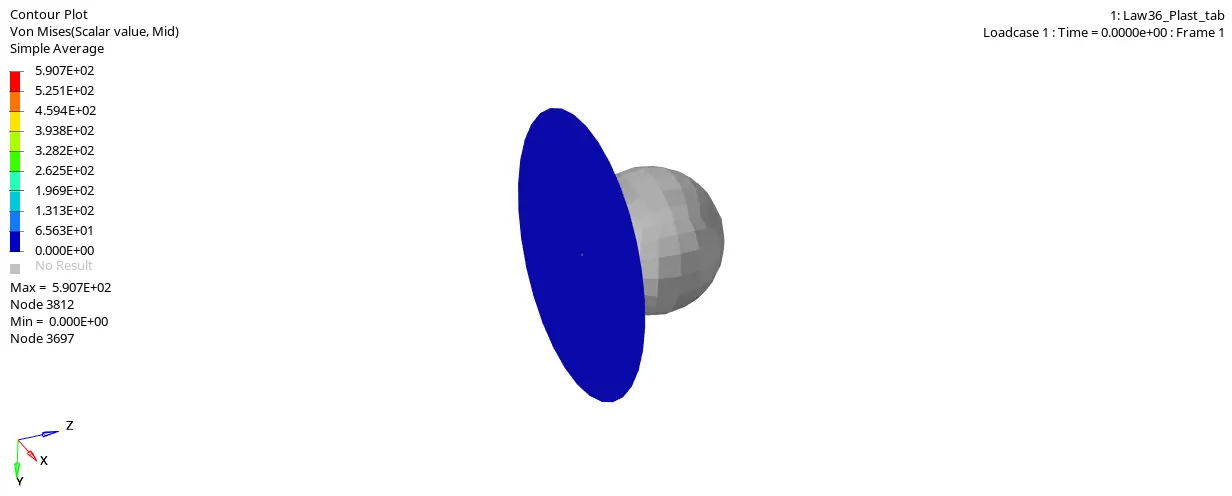
Figure 37: Simulation with /MAT/LAW36 (PLAS_TAB)
Total resultant force is increasing with the time (figure 38). We can not observe any deleted or cracked element up to 3.25s (Figure 38-39).
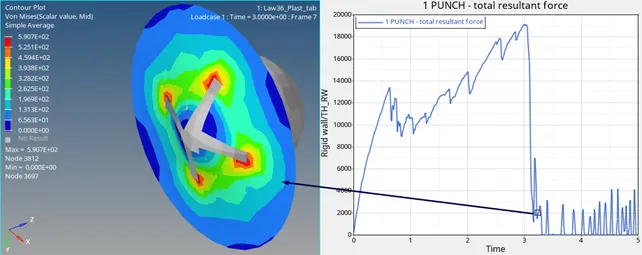
Figure 38
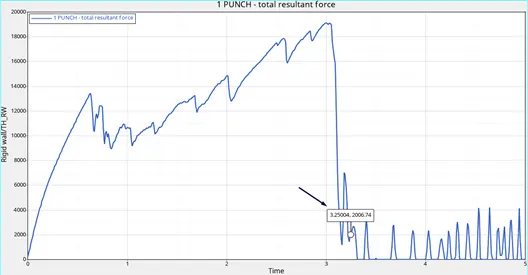
Figure 39
After 3.27s, the elements are being deleted (removed) in the below Fig.40. Because the maximum plastic strain values are exceeded. The resultant force decreases earlier compared to other six cases due to fragility of the material behaviour (Fig.40).
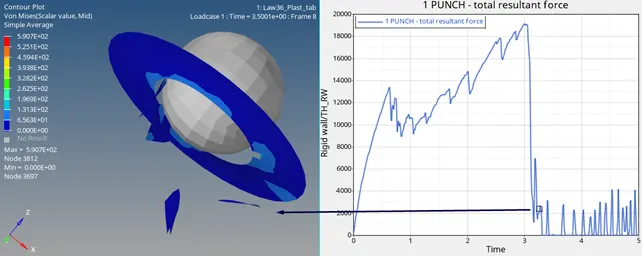
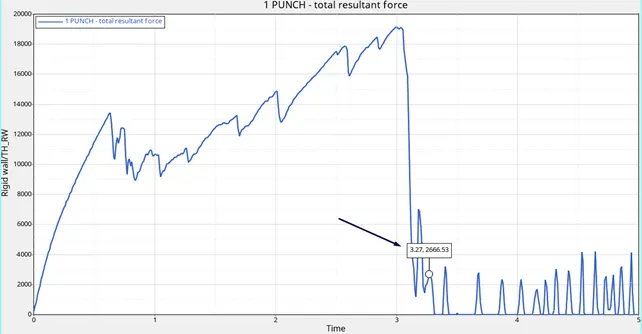
Figure 40
Case 7.3: Plot energies and notice any difference
In this case, the behaviour of the internal energy is same as the resultant force. It decreases earlier compared to other six cases due to fragility of the material behaviour (Fig.41).
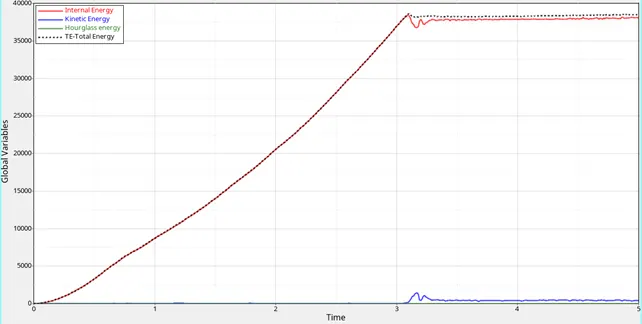
Figure 41
Conclusion
As seen in the figure 42 above, seven different simulation are performed with different material as Law1, Law2, Law27 and Law36. Energy and mass erros are acceptable. Case 7 displays more brittle behaviour than other six cases due to its small plastic strain value. It breaks earlier than case 6. Case 7 (Law36_Plast_tab) is most commonly used material model, but it can be used only with data from lab test. Case6 (Law27(Plastic_Brit)) is the best choice to define fracture behaviour of the material.
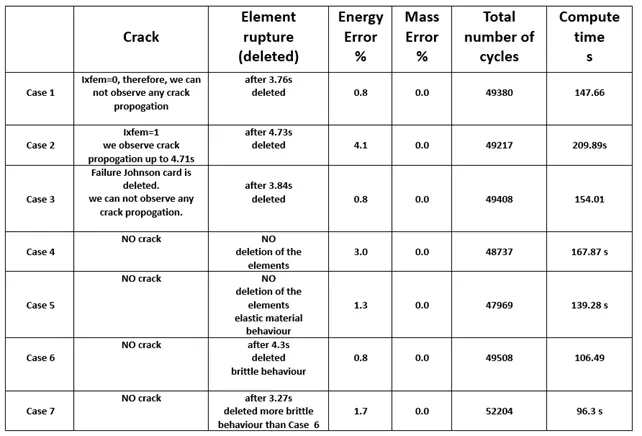
Figure 42: comparison of the results