Assignment 3-2D Element Formulation Challenge
Assignment 3-Comparison of results with base simulation and improved shell element properties
Objective:
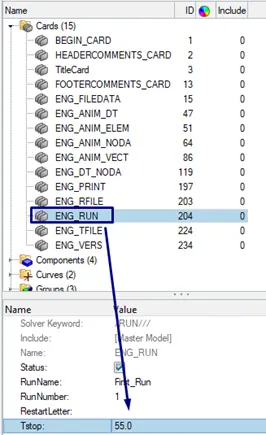
- To use the crash beam file from the previous assignment, change the run time to 55 ms.
- To change the number of animation steps during simulation to a minimum of 25 and maximum of 60.
- To run the base simulation without any modification to element properties.
- To provide the energy error and mass error at the end of the simulation checks and determine whether results would be acceptable.
- If acceptable, Plot rigid wall forces, internal energy, hourglass energy, contact energy, total energy of the simulations.
- To change all the shell elements properties to recommended properties, save this as separate, rad files and run the simulation.
- Follow steps 4 and 5.
- To create a brief report comparing all the results from steps 5 and 6 for both simulations.
- To Comment whether there is any change in the results and why there is any change in the result.
1. To use the crash beam file from the previous assignment, change the run time to 55 ms
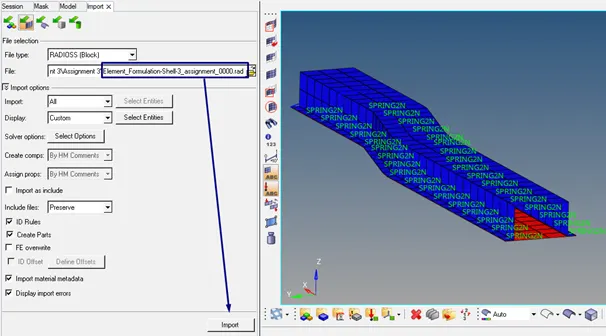
We will import the crash beam starter file which is given as Element_Formulation-Shell-3_assignment_0000.rad
We have the information about the run time to set 55 ms. To change the run time, we will use ENG_RUN Card in model Browser in the figure below.
2. To change the number of animation steps during simulation to a minimum of 25ms and maximum of 60ms
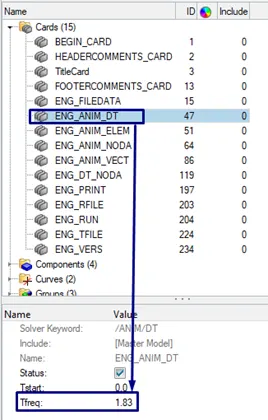
We can select time anywhere between 25ms and 60ms to set animation frequency. We will select 30ms. Animation frequency =Analysis stop time (Tstop)/30ms= 1.83. To set the animation frequency, we will use ENG_ANIM_DT Card in model Browser in the figure below.
Case 1:
3-4. To run the base simulation without any modification to element properties and at the end of the simulation, do the energy error and mass error checks and determine whether results would be acceptable
We will run the simulation without any modification to element properties (Base simulation). After running the simulation, we will open Element_Formulation-Shell-3_assignment_0001.out file with using Notepad to control the energy error and mass error whether results would be acceptable.
The energy error must be negative and decreasing. The error must be less than 15% at the end of the computation. The energy error is 10.3% and mass error is 0.1659E-03 at the end of the computation in the figure 1. The energy error is below the 15%. Therefore, the results are acceptable to plot energy graph.
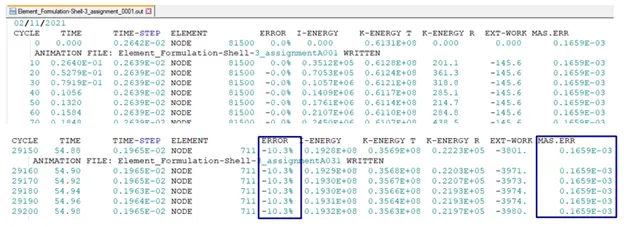
Figure 1: Energy and mass error
5. If acceptable, plot rigid wall forces, internal energy, hourglass energy, contact energy, total energy of the simulations
The course of total resultant force and resultant normal force is quite similar and they are decreasing and increasing with time. Rigid wall force at the beginning of the crash is 1.17E+5. The course of the resultant tangent force increases with time in the below figure 2.
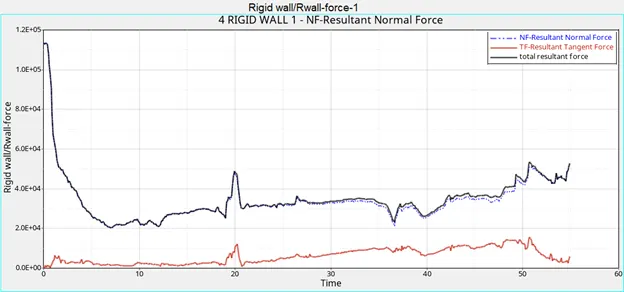
Figure 2: Rigid wall forces
Figure 3 shows how the internal Energy in the crash beam increases with time during crash process. Its maximum value is about 1.97E+07.
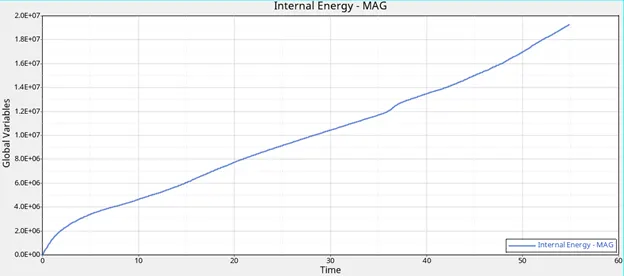
Figure 3: Internal energy during crash proces
The Kinetic Energy of the crash beam decreases logically with time during crash process. Its maximum value is about 6.1E+07. Minimum value is close to 3.5E+07
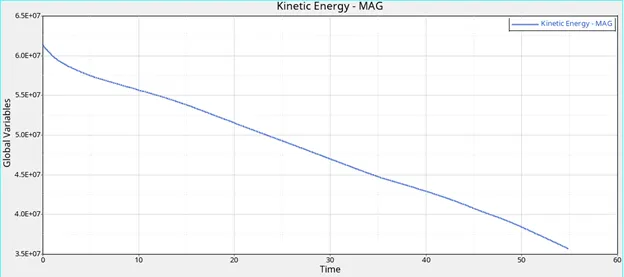
Figure 4: Kinetic energy
Figure 5 shows how the Hourglass Energy in the crash beam increases with time during crash process. Its maximum value is about 6.25E+06.
Hourglass is weird modes of deformation that occur in reduced integrated elements and no stresses will be produced. This can affect solution accuracy by varying the structure’s true response. This leads to inaccurate stress, strain and deflection results. For a reduced integrated element, displacements and forces may exist for each node of the element. If sum of all these forces and displacements give null strain and stress on the integration point of the element then that element fails to calculate stiffness for certain mode of deformation. At this stage we say element has entered into hourglass. Soon after this as element failed to calculate stiffness the element will behave weirdly. There are ways to control hourglassing and in the subsequent case 2 we will discuss on it.
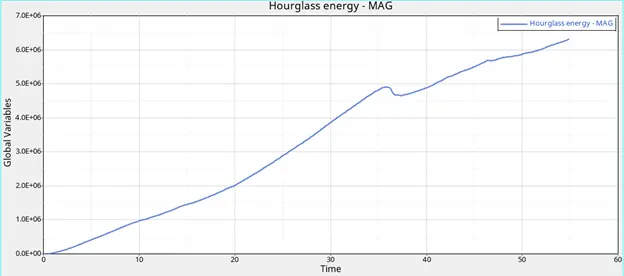
Figure 5: Hourglass energy
The Total Energy of the crash beam decreases logically with time during crash process. Its maximum value is about 6.15E+07 in the below figure 6. Minimum value is 5.5E+07
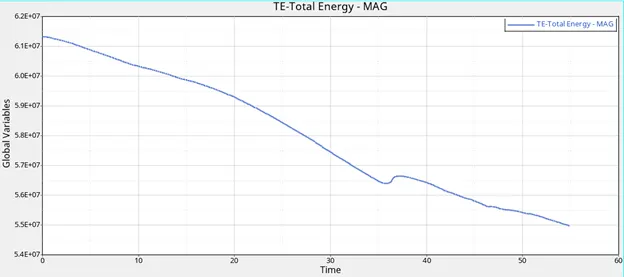
Figure 6: Total energy
Figure 7 shows again all energy behavior relative to each other. As the kinetic energy decreases, the internal energy increases.
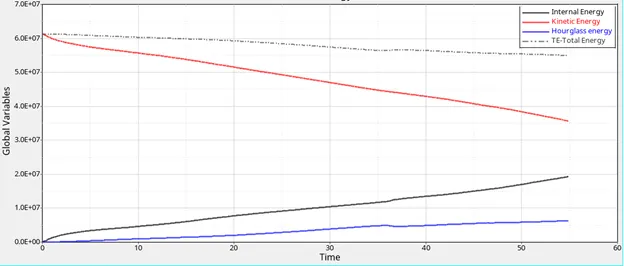
Figure 7
Contact Energy
At the beginning of the simulation (time=0ms), there is no contact and therefore no contact energy is available.
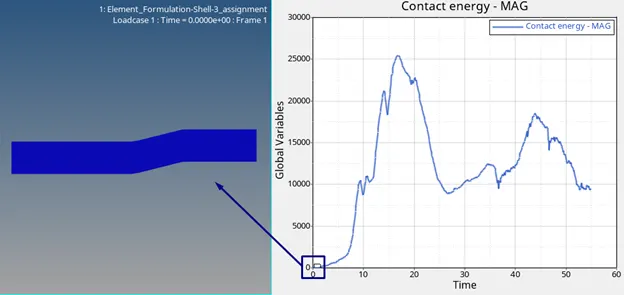
At the time 16.4 ms, crash beam is being crushed which reaches its maximum contact energy. The yellow regions show new contact situation because of crushing. It is a reason why the contact energy increases.
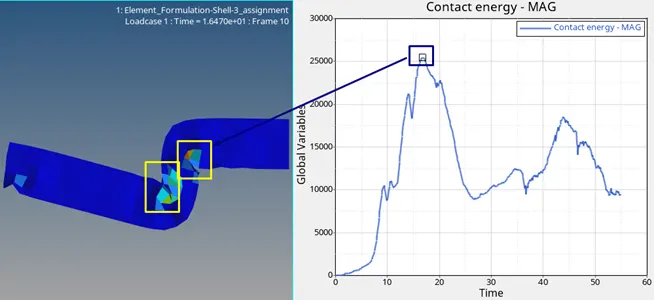
After contact energy reached its maximum value, no new contact situation is occurred until time 27.4ms, therefore the amount of contact energy decreases until the new contact situation starts.
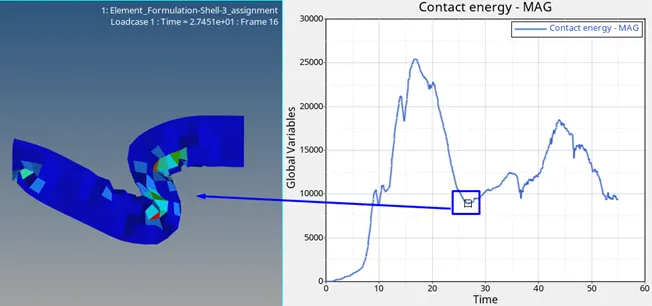
The yellow region shows new contact situation by the crushing with time.
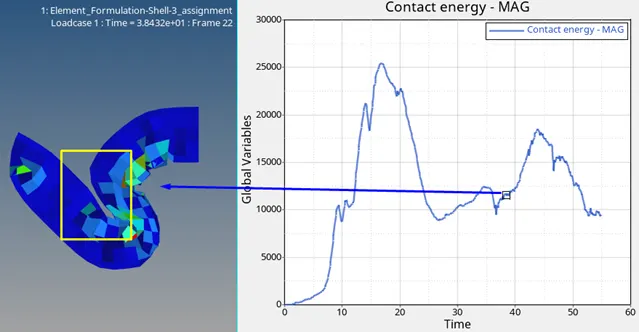
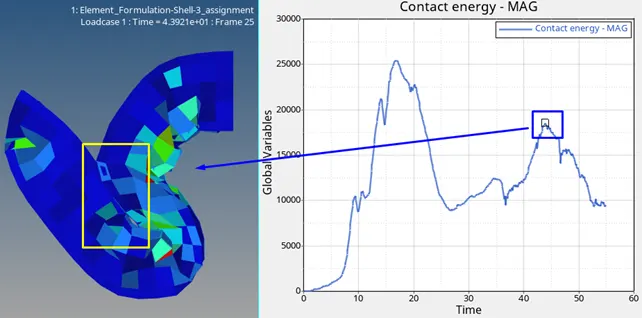
At the time 43.9 ms, crash beam is being again crushed which reaches its second maximum contact energy. The yellow regions show new contact situation because of crushing. After this time point, contact energy decreases again with time.
Case 2: Simulation of improved shell element
6. To change all the shell elements properties to recommended properties, save this as separate, rad files and run the simulation
Recommended properties:
|
Parameters |
|
Comment |
|
Ishell =24 |
|
QEPH 4 nodes shells are best combination of cost and accuracy. |
|
Ismstr=2 |
|
Full geometric nonlinearities (default) with possible small strain formulation activation in RADIOSS Engine. |
|
Ish3n=2 |
|
Standard 3 node shell (C0) with modification for large rotation (default) |
|
N=5 |
|
Number of integration points set to 5 for accuracy bending. |
|
Ithick=1 |
|
Thickness change is taken into account for accuracy. |
|
Iplas=1 |
|
Iterative plasticity for good accuracy. |
We will set recommended properties in the properties of the parts which are called Hat-Section and Close-Out Panel in the below figures 8-9
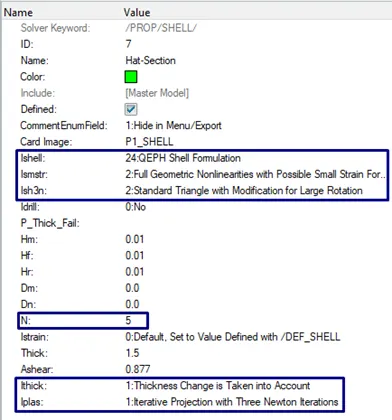
Figure 8: Recommendations For Crash Applications
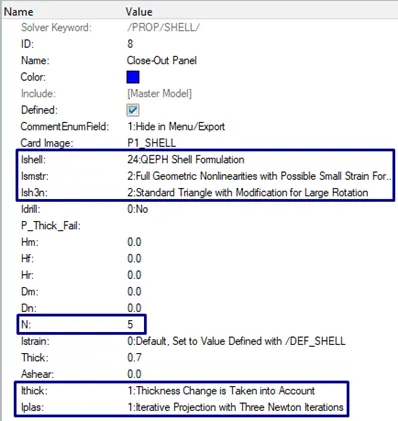
Figure 9: Recommendations For Crash Applications
7. To provide the energy error and mass error at the end of the simulation checks and determine whether results would be acceptable. (Follow steps 4 and 5)
After running the simulation with recommended properties, we will open Element_Formulation-Shell-3_assignment_0001.out file with using Notepad to control the energy error and mass error whether results would be acceptable.
Maximum energy error in this case is -0.1% in the below figure 10. The error should be at most -15%. It is better to have closer to 0%. For QEPH shell formulation or fully integrated elements which is used for this case, the Energy error can be slightly positive since there is no Hourglass energy and the computation is much more accurate. An error of 1 or 2% will be acceptable. For this reason, the calculated errors for case 2 is acceptable to plot error graph.
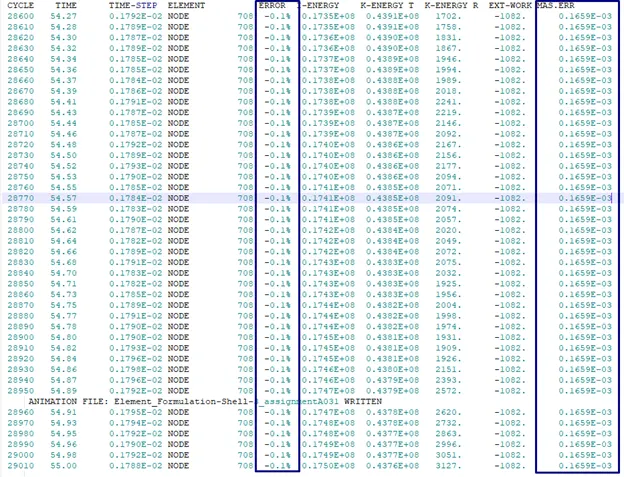
Figure 10: Energy Error with using recommended properties
The course of total resultant force and resultant normal force is quite similar and they are decreasing with time. The energy value at the beginning of the crash is 1.17E+5. The course of the resultant tangent force increases slightly with time in the below figure 11.
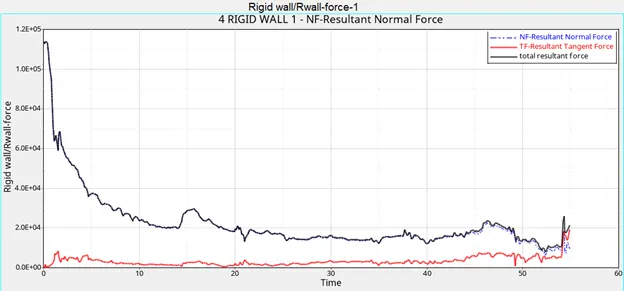
Figure 11: Rigid wall forces
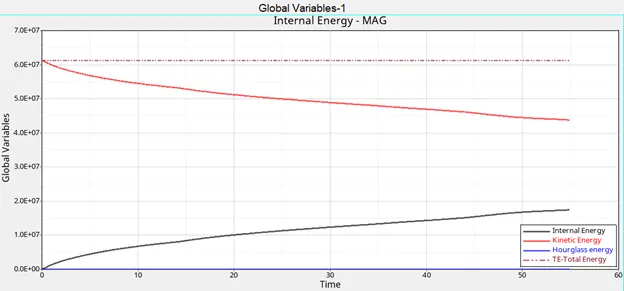
Figure 12 shows how the internal Energy in the crash beam increases with time during crash process. Its maximum value is about 1.75E+07.
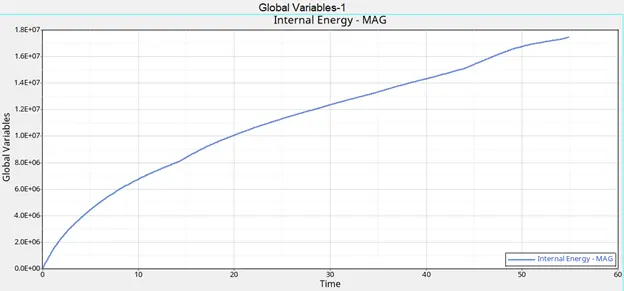
Figure 12
The Kinetic Energy of the crash beam decreases logically with time during crash process. Its maximum value is about 6.1E+07. Minimum value is close to 4.4E+7.
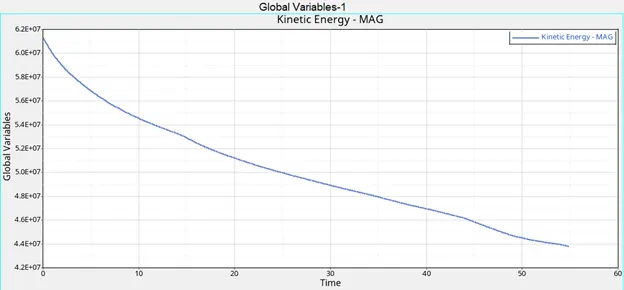
Figure 13 shows that Hourglass Energy in the crash beam is constant with value 0 during crash process. This is a sign that the computation is much more accurate than case 1 (Base simulation).
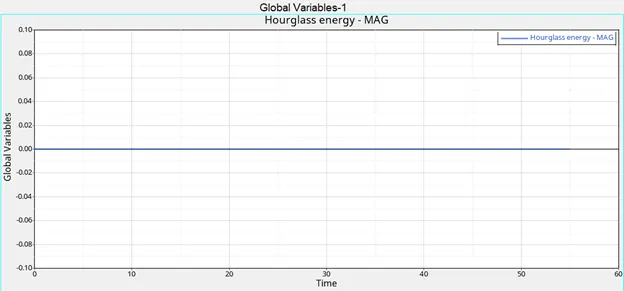
Figure 13
The Total Energy of the crash beam decreases very slightly with time during crash process. Its maximum value is about 6.1315E+07 and minimum value is close to 6.126E+7 in the below figure 14. Therefore, it can be accepted as constant.
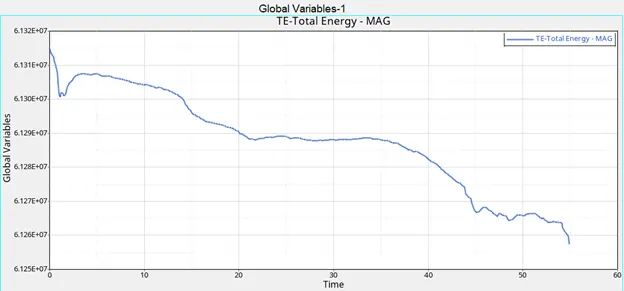
Figure 14: The Total Energy of the crash beam
8. To create a brief report comparing all the results from steps 5 and 6 for both simulations.
The amount of contact energy decreases extremely by using Improved shell element as seen in figure 15.
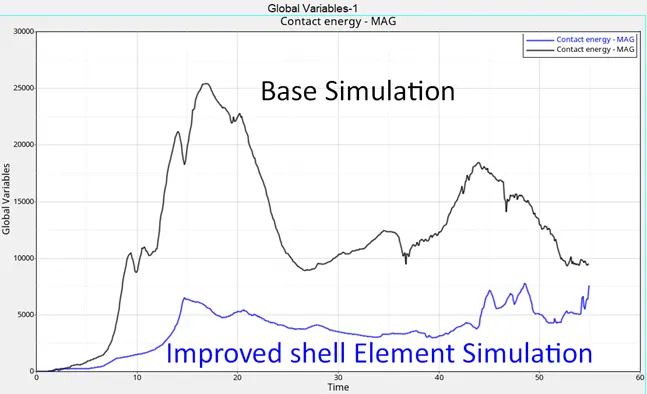
Figure 15 comparing of contact energy
9. To Comment whether there is any change in the results and why there is any change in the result.
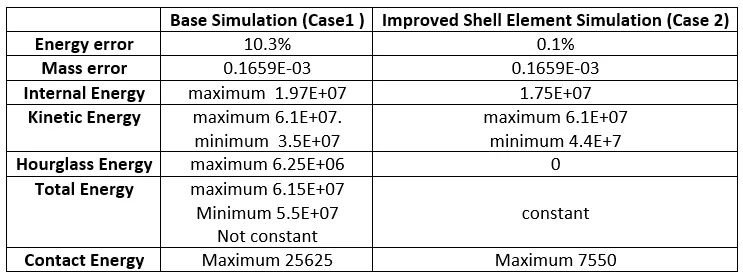
Energy error 0.1% with Improved Shell Element Simulation is very good result in comparison to energy error 10.3% which is found in base simulation. In addition, hourglass energy is zero by using Improved Shell Element Simulation, where Total energy remains constant. Contact Energy increases approximately 70% from Base simulation to Improved Shell Element Simulation.