Assignment 5
Objective :
1) To mesh the given component according to givrn quality criteria .
2)
a)To Run the crash tube model as it is
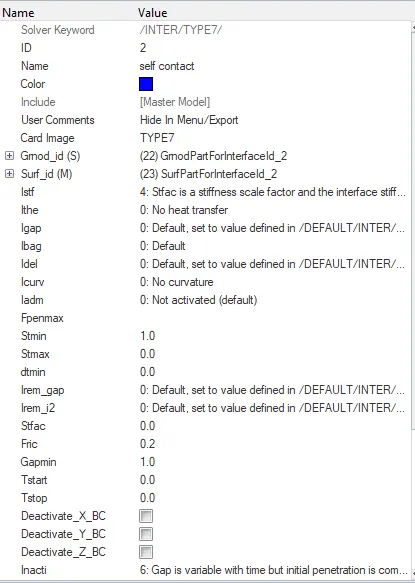
b) The change Inacti to 6 and run the model .
c) To create type 11 contact and run the model.
d) Remove both notch and remove the boundary condition on rigid body and then run the model .
e) To create a new notch in the middle and run the model.
f) To create notch on only opposite sides and then run the model.
g)
i)To plot rigid wall forces , contact forces , internal energy , create TH/PART for all parts and compare results.
ii) Comment on change in internal energies .
iii) Variation in results due to variation of notches .
Procedure :
1)
The model was imported and visually inspected for surface deformations .
The geometry color mode was changed to by topo .
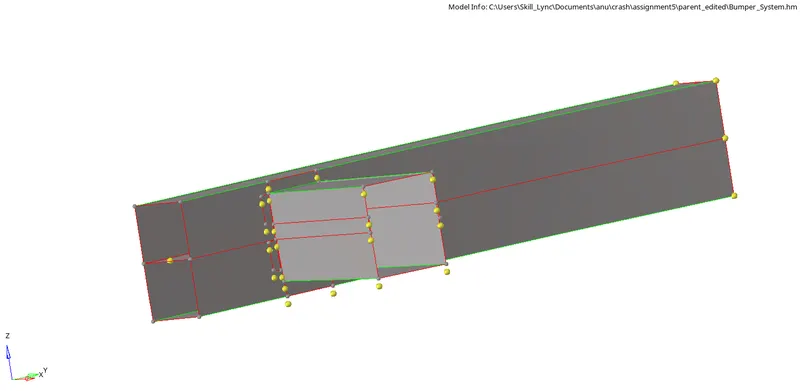
The 4 surfaces were translated using translate function from tools module to match the temp nodes .
Unwanted free edges were toggles using edge edit function from geometry module .
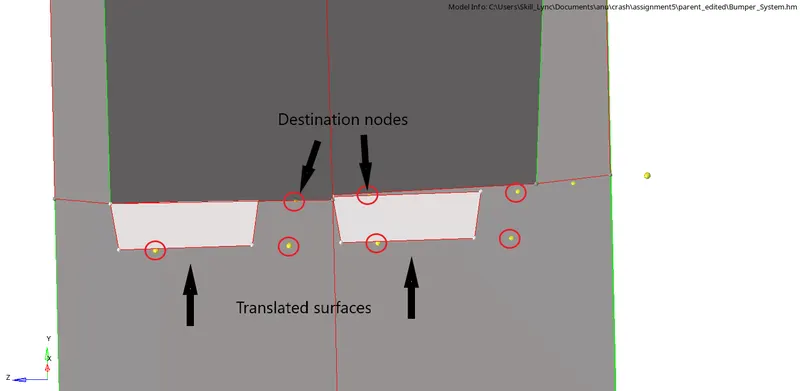
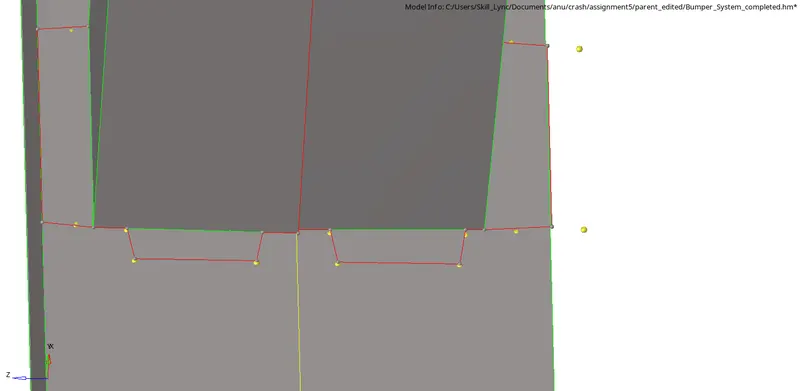


The free edges were extended to surfaces using surface edit option from geometry module.
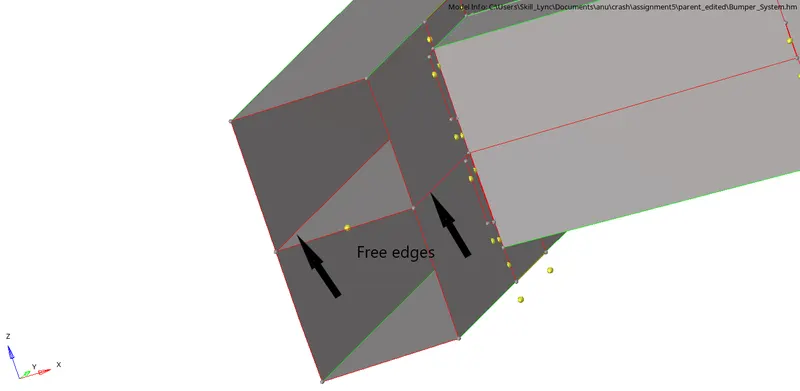
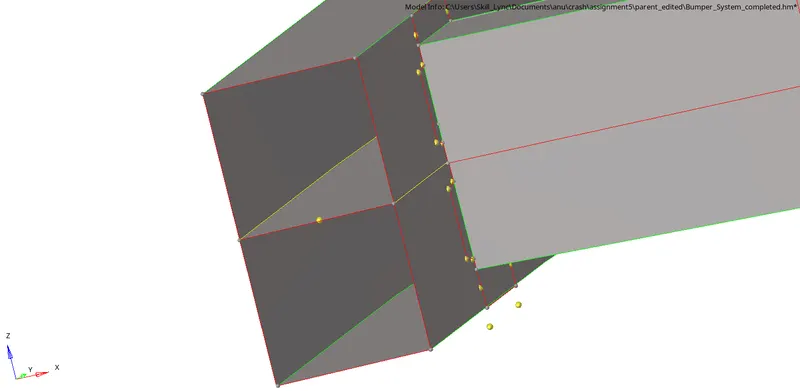

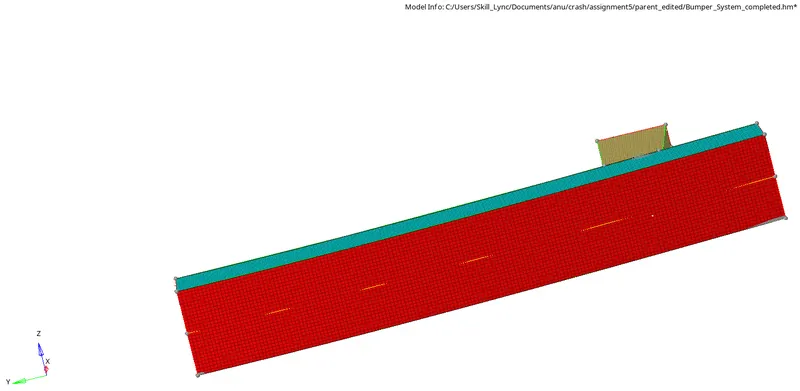
The surfaces were meshed according to given element criteria of target element length of 6 using automesh option from 2D module .

Gaps between surfaces were connected using Rigids option (RBE2 elements) from 1D module .
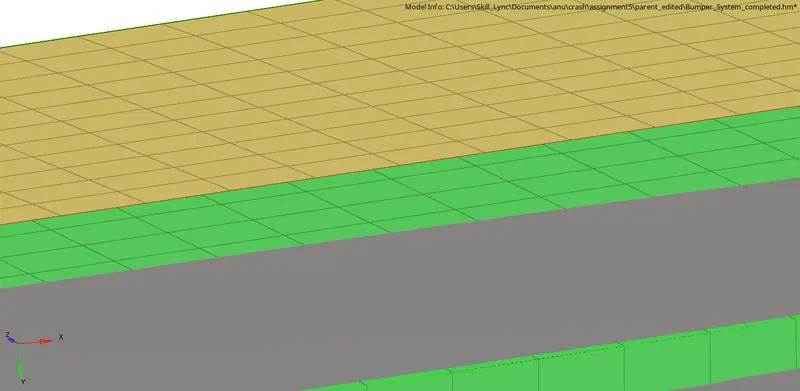
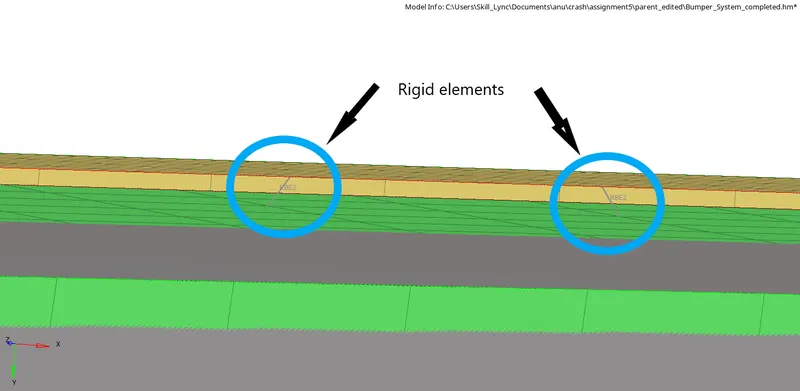
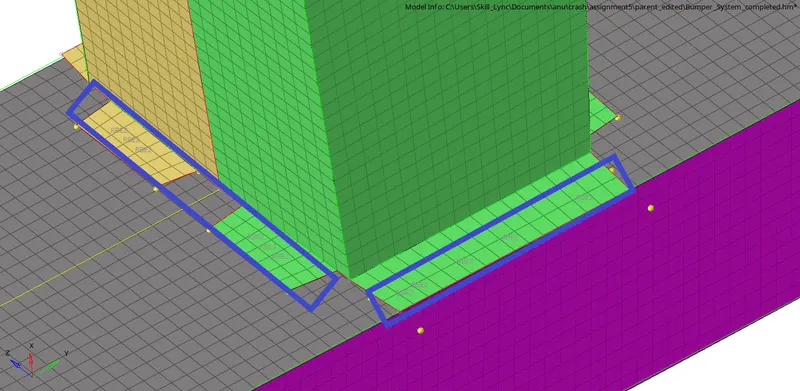

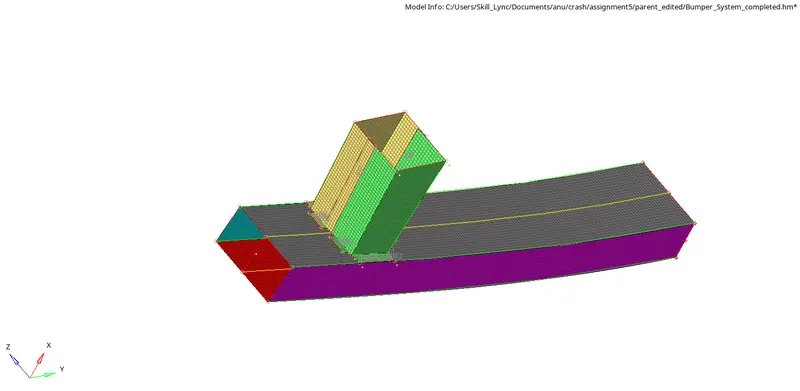
Hence the given model was meshed according to given quality criteria .
2)
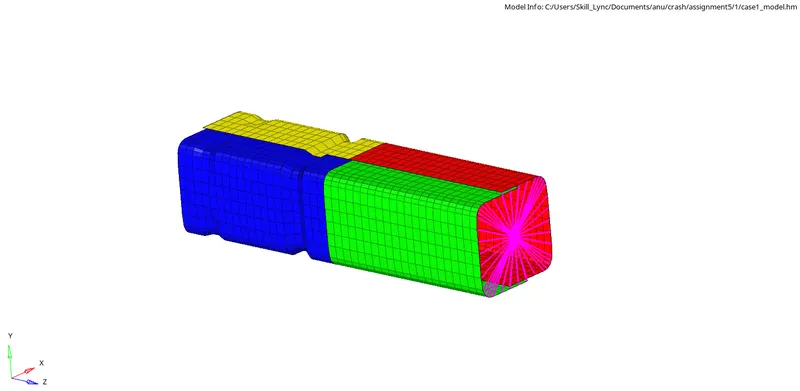
Case 1 : The given model was run as it is .
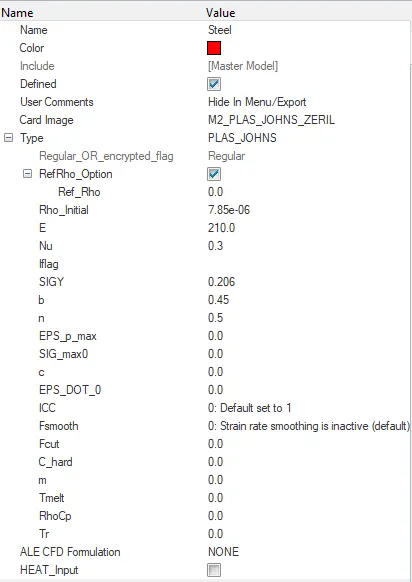
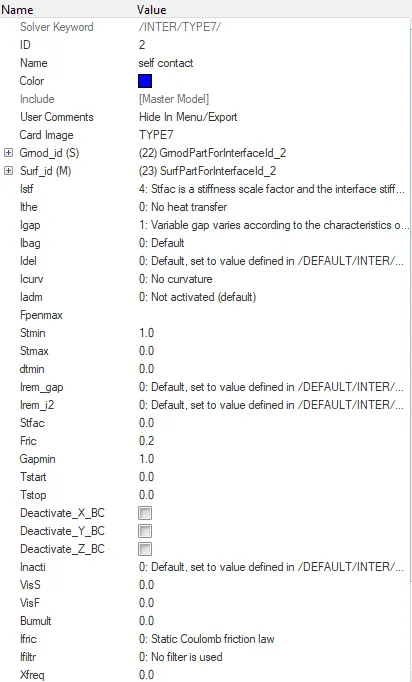
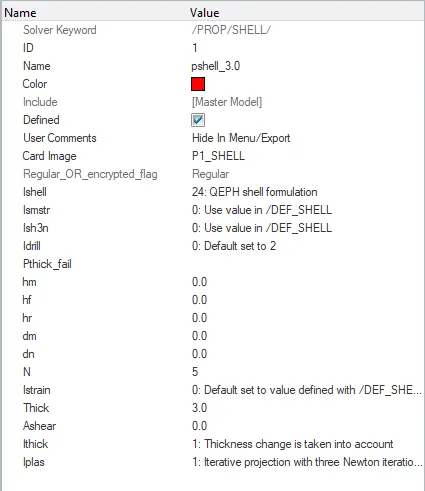
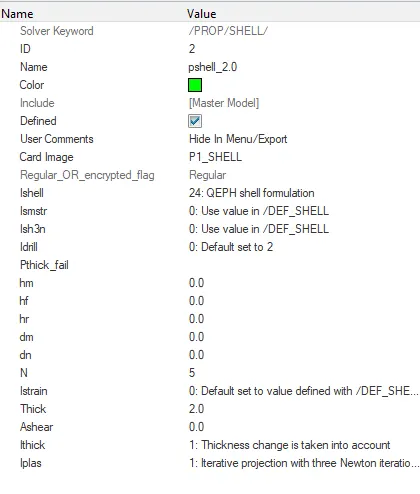
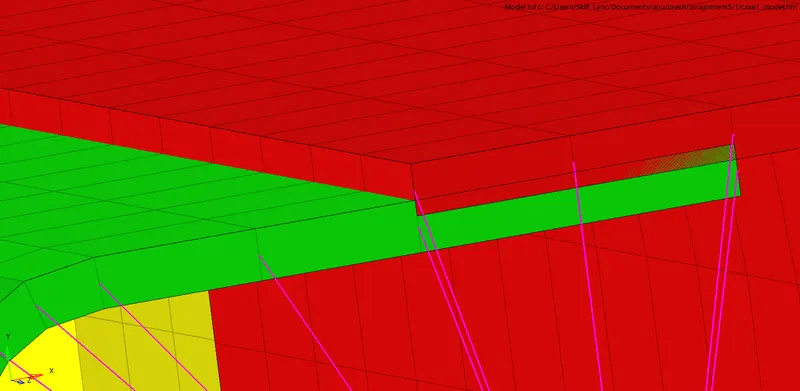
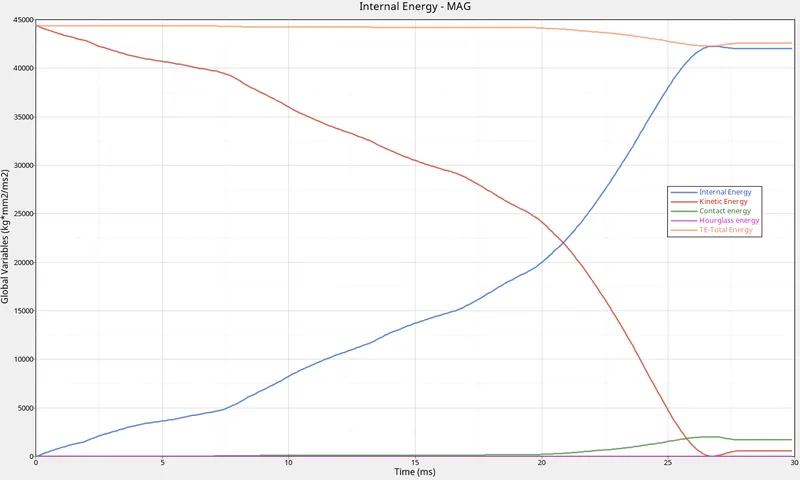
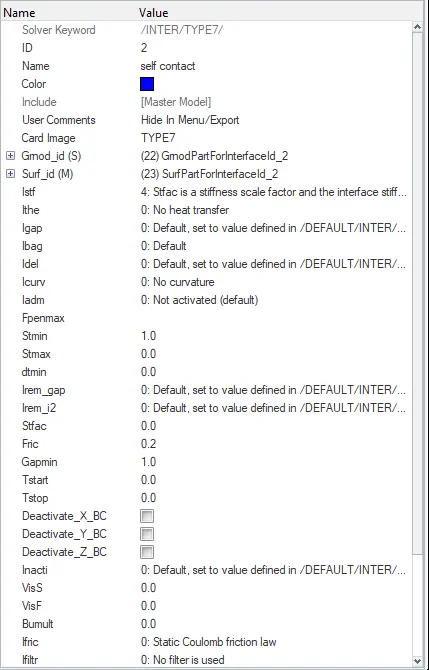
Here we can observe that as Igap = 0 and Gapmin=1 , the penalty formulation is thus avoided as distance between the 2 nodes are 2.1 mm .
Here we can observe that , the kinetic energy decreases as it is being converted into internal energy . Hence the internal energy rises and comes to a constant value as the kinetic energy is completely dissipated/converted . We can also notice that there is a drop in total energy towards the end of run time as this is because of the formation of contact energy which is formed due to penetration of elements . Since contact energy represents energy dissipated from the system , the total energy is coming down .
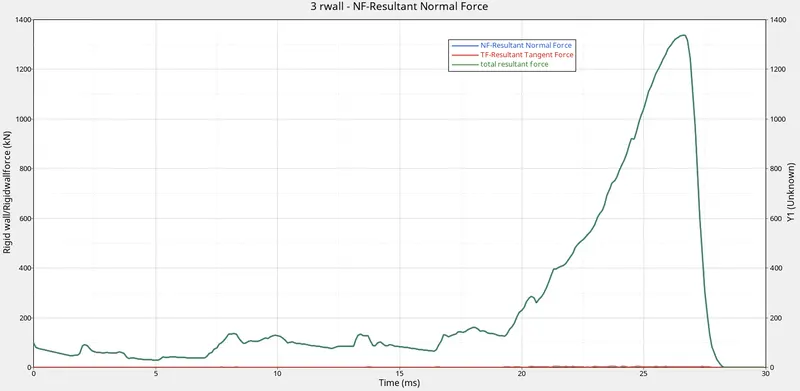
Here we can observe that , resultant normal force and total resultant force are on the same curve , indicating very low error in calculation . We can see that there is a spike in the resultant normal and total resultant force toward the end because the component is already very deformed and force needed to further deform the material is very high .
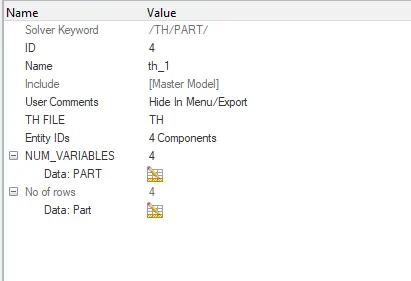
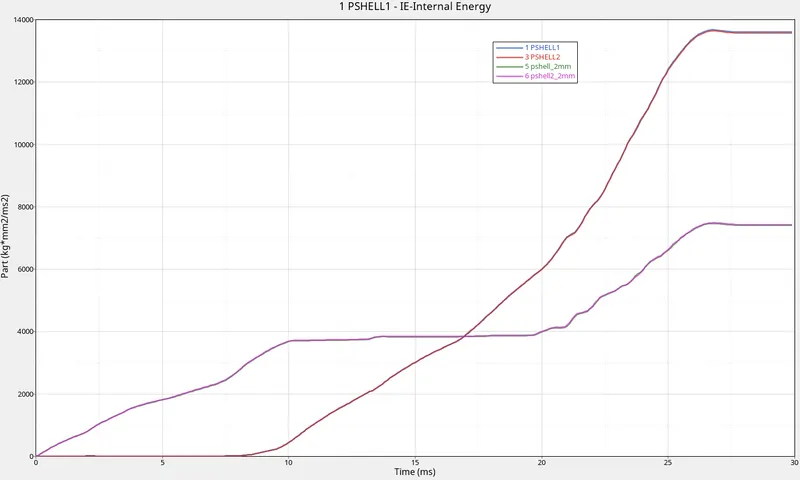
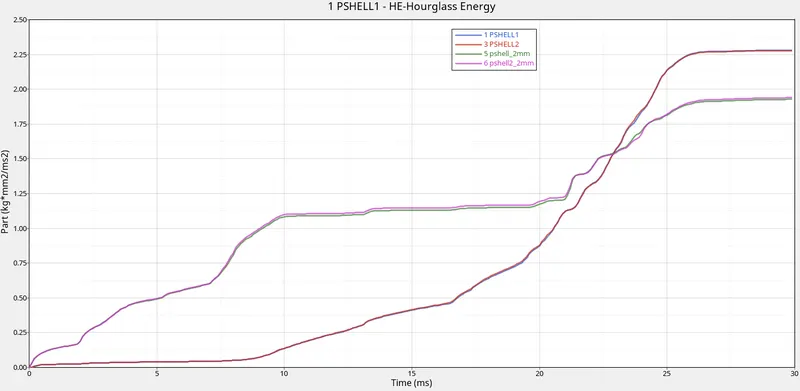
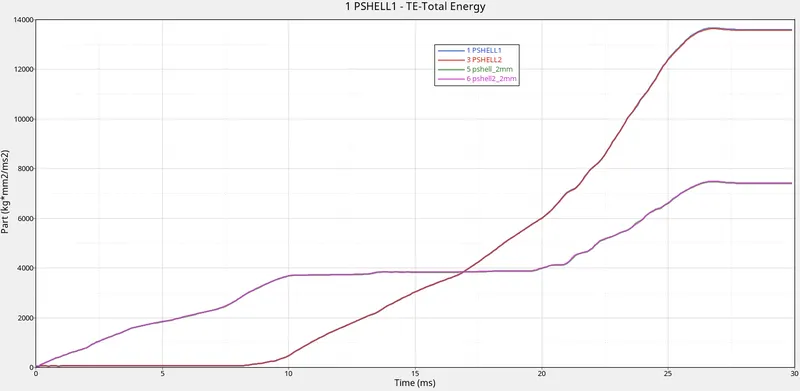
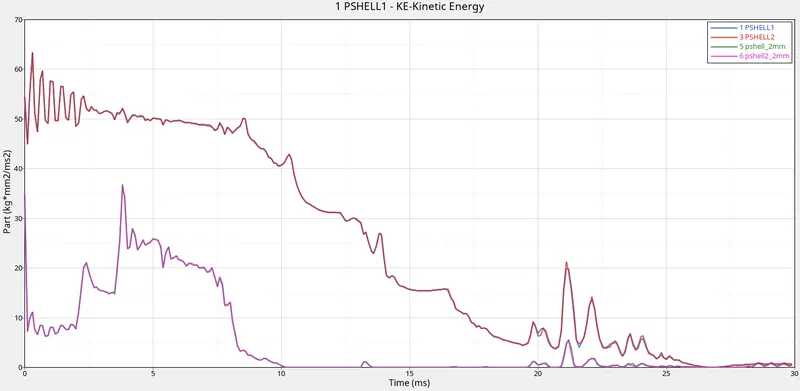
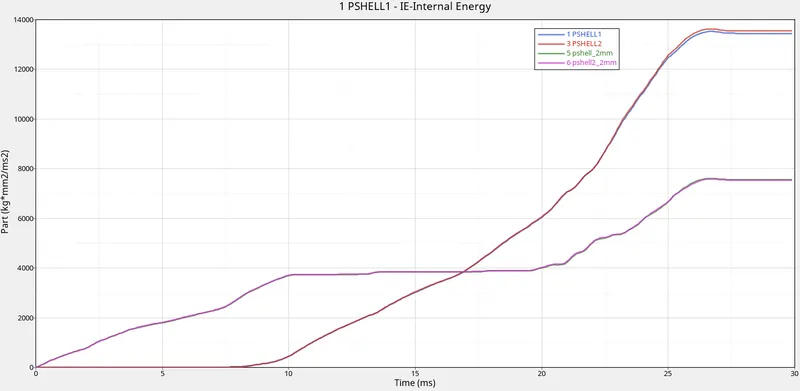
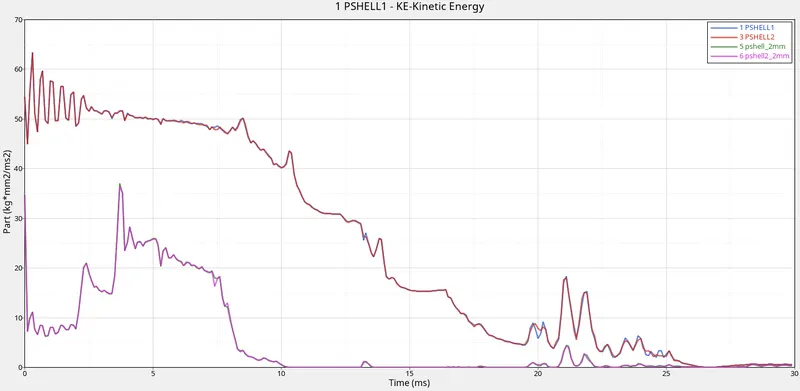
The TH/Part values for the 4 components are plotted below .
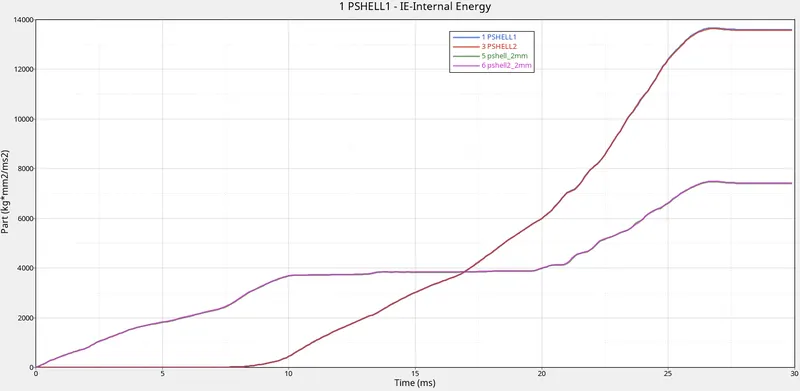
case 2 : In this case , the inacti value is changed from 0 to 6 . All other input parameters remains the same .
Since the Igap value and Gapmin value remains the same , the penalty formulation is avoided . Hence changing the inacti value does not make any difference ,since inacti is used to avoid initial penetrations . So the values in Energy graphs and resultant forces graphs remains same as that of case 1 .
From the animation , we understand that the deformation begins from elements just below the higher notch . Hence we can conclude that this was the weakest point of the model . This is same for case 1 as there is no difference between these 2 models .
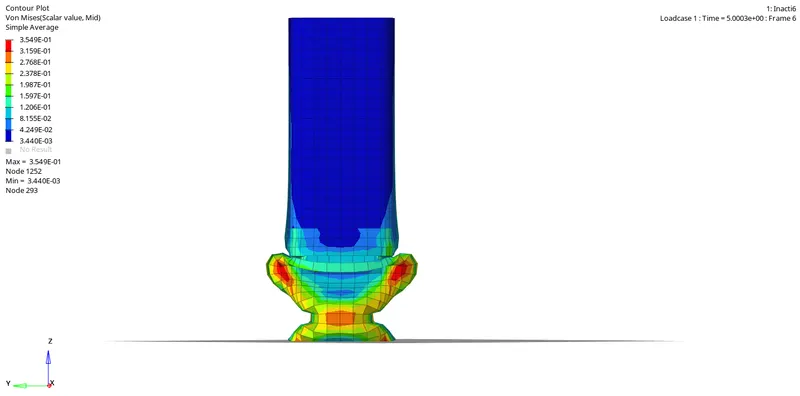
Here we can observe that , the kinetic energy decreases as it is being converted into internal energy . Hence the internal energy rises and comes to a constant value as the kinetic energy is completely dissipated/converted . We can also notice that there is a drop in total energy towards the end of run time as this is because of the formation of contact energy which is formed due to penetration of elements . Since contact energy represents energy dissipated from the system , the total energy is coming down .
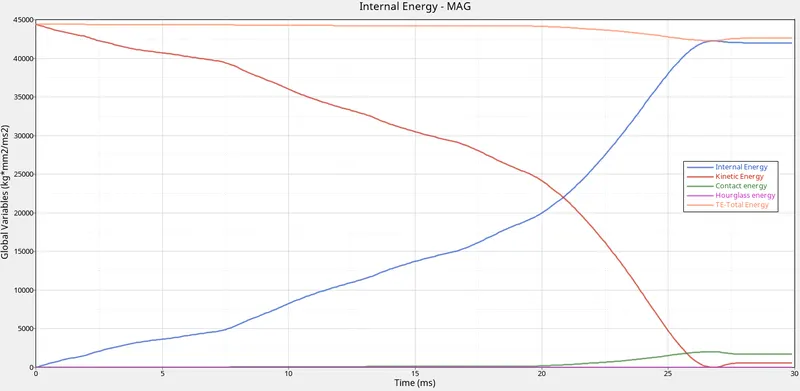
Here we can observe that , resultant normal force and total resultant force are on the same curve , indicating very low error in calculation . We can see that there is a spike in the resultant normal and total resultant force toward the end because the component is already very deformed and force needed to further deform the material is very high . We
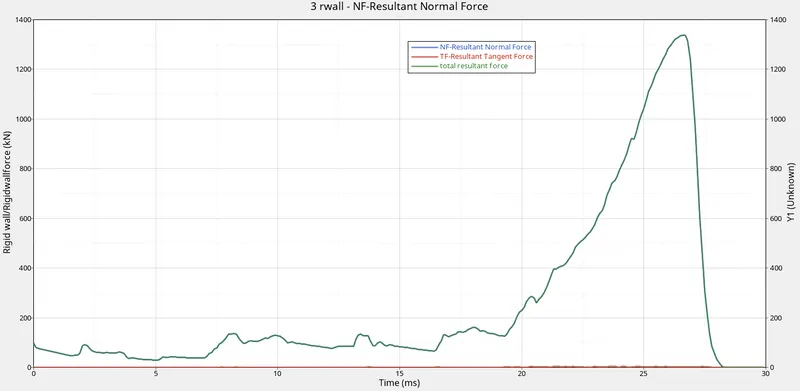
The TH/Part values for the 4 components are plotted below .
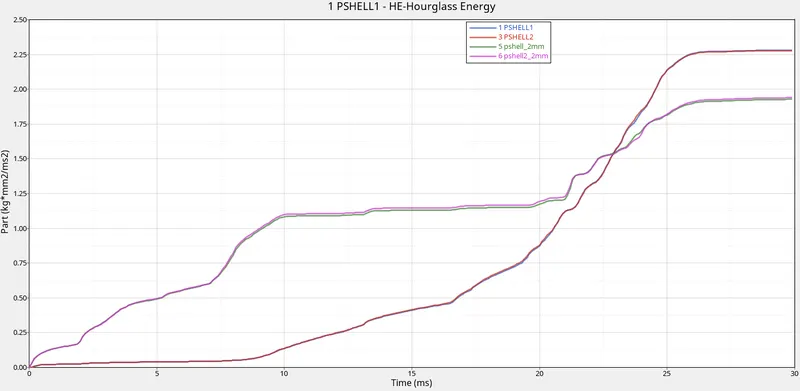
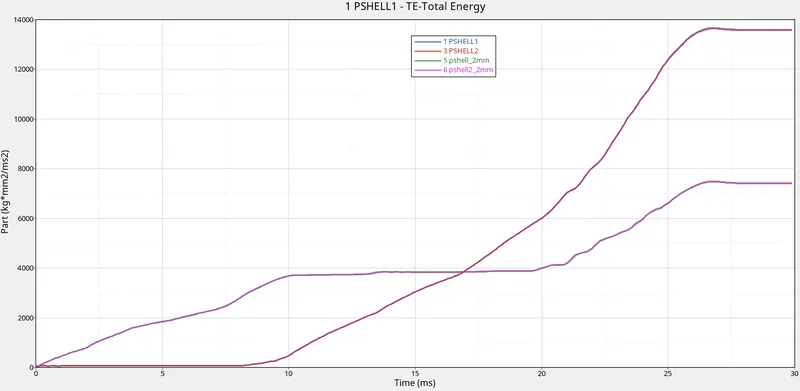
case 3: In this case , we have created a card for type 11 and ran the model .
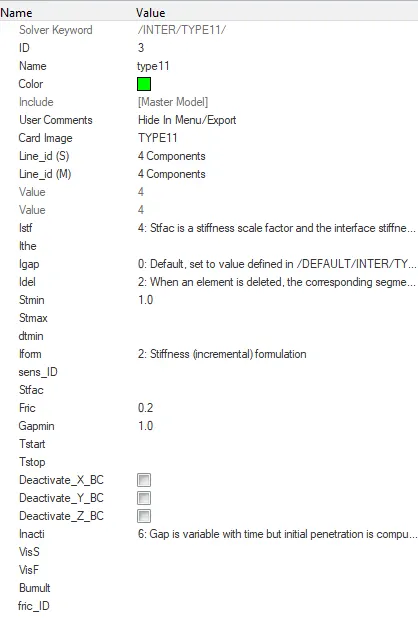
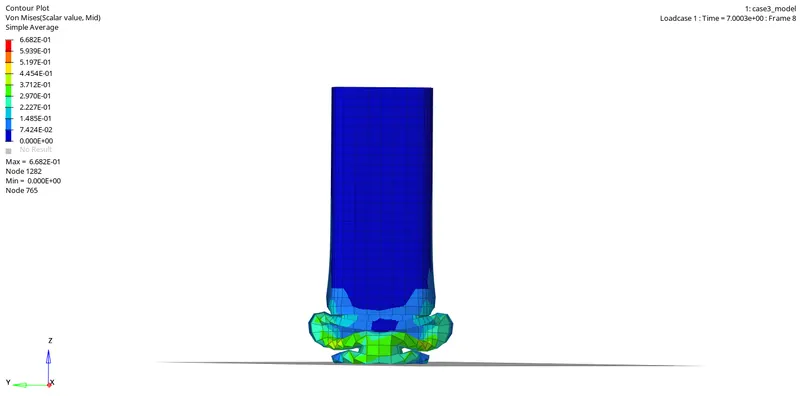
From the animation , we understand that the deformation begins from elements just below the higher notch . Hence we can conclude that this was the weakest point of the model . This is same for case 1 and 2 as there is no difference between these 3 models.
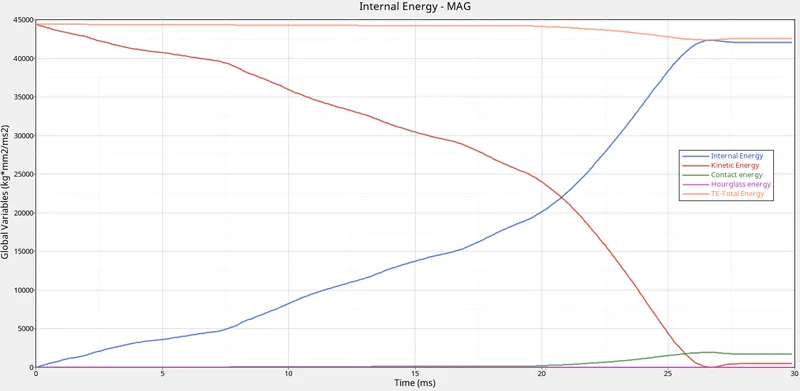
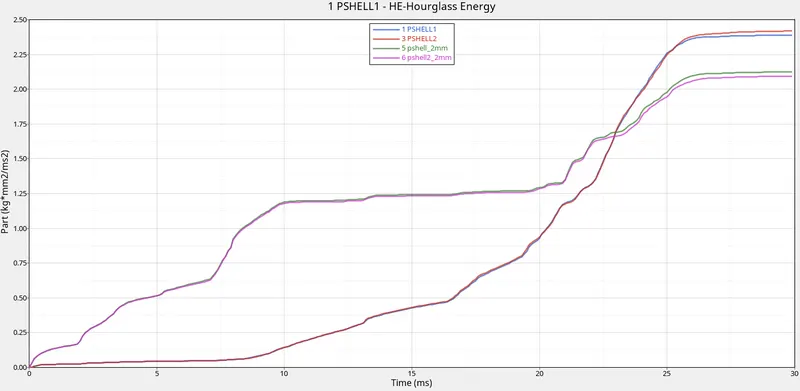
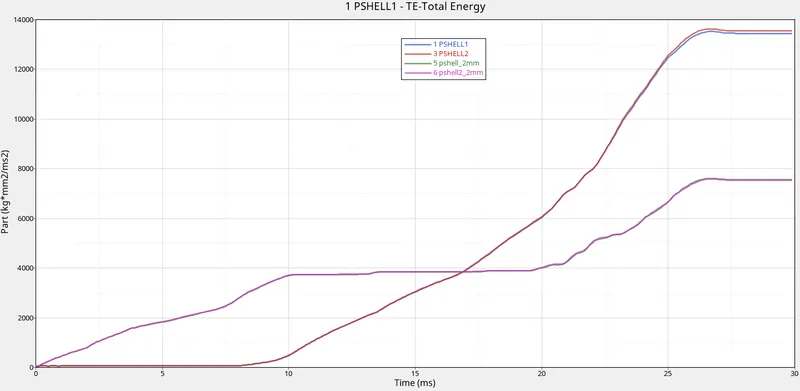
Here too the energy curves are very similar to that of case 1 and 2 . There is a slight increase in value of internal energy beacuse of introduction of type 11 card . The type 11 card takes into account the edge to edge penetrations also . Hence there is a slight change from values of case 1 and 2 .
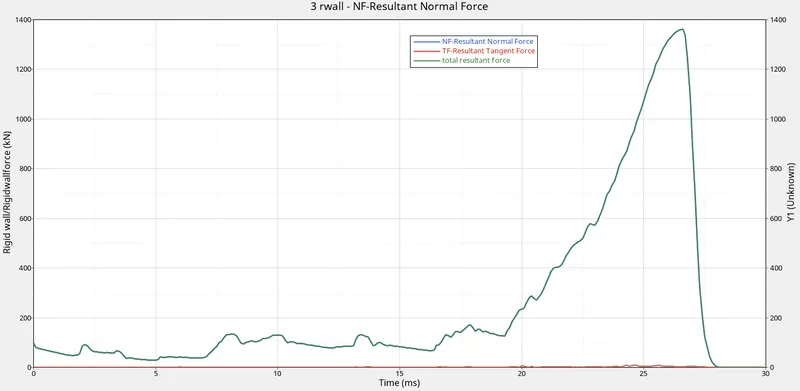
From the energy graphs , we understand that the peak value of total resultant force is around 1350kN around 26 ms .
case 4 :
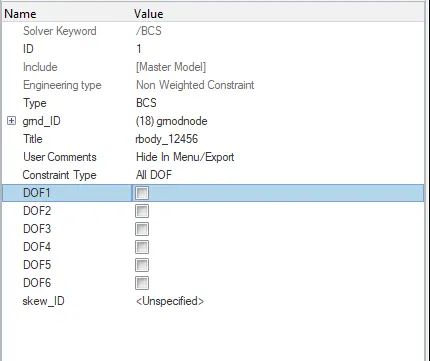
In this case , we have removed the notch and removed the boundary conditions and ran the model .
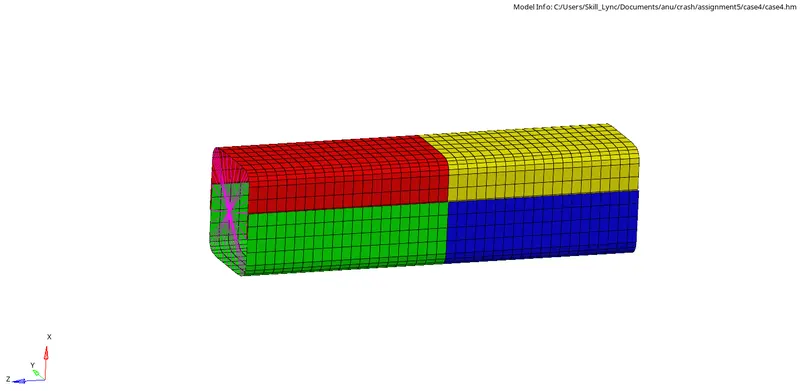
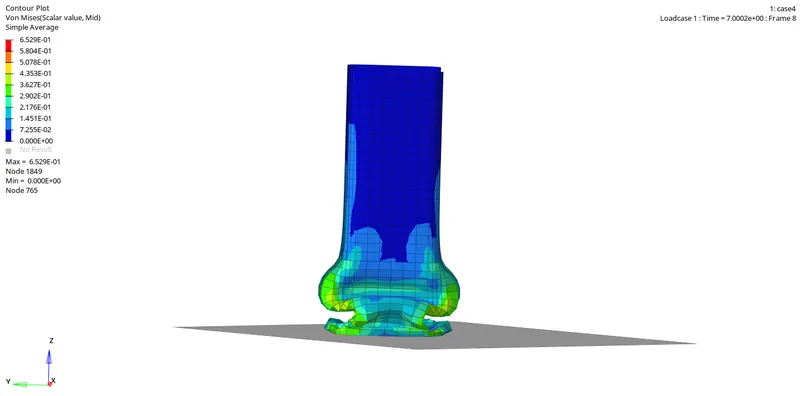
From the animation , we understand that the deformation occurs from the bottom of the model unlike cases 1,2 and 3 . This is beacuse there are no notches present in the model . This conveys that there are no weak points in the model unlike earlier cases . We can also observe that the von mises stress value is around 65.29 GPa , which is amlost twice as that of above cases which implies that the stifness of the model has been increased by almost twice the value .
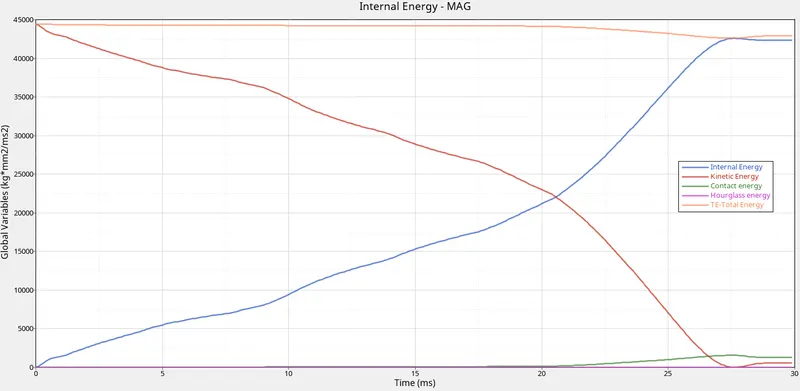
From the energy graphs we understand that eventhough the values are very similar to that of above 3 cases , the time at which peak internal energy value is reached is delayed by almost 1ms (approx at 27.5 ms ) , which is considered better than above 3 cases .
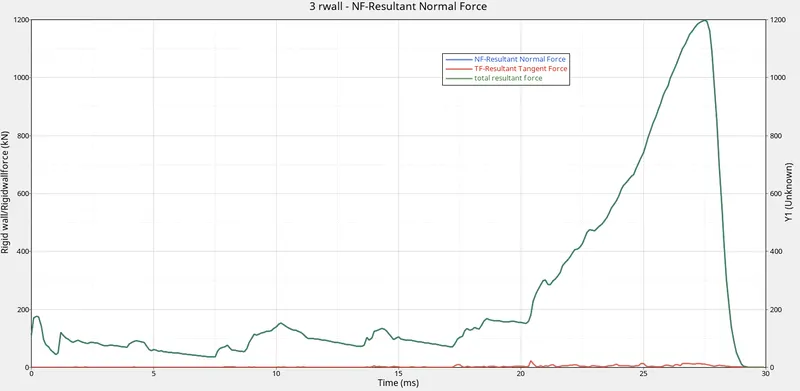
From the forces graph , we understand that the peak value of total resultant force reached is around 1200kN at around 27 ms . This value is lesser than that of above 3 cases , where the peak value of net resultant force is approximately 1350 kN .
The TH/PART for all components have been created.
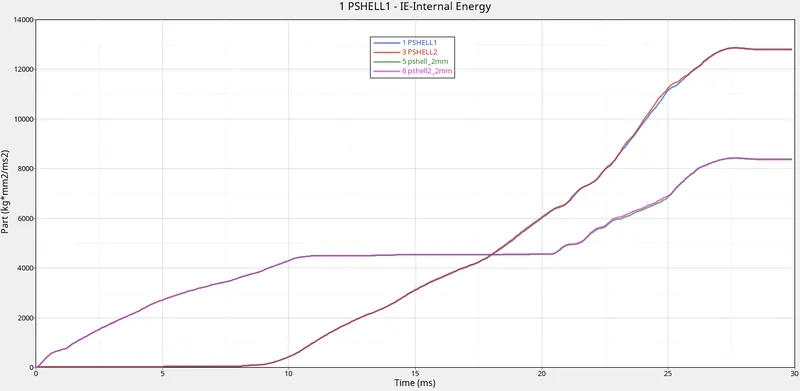
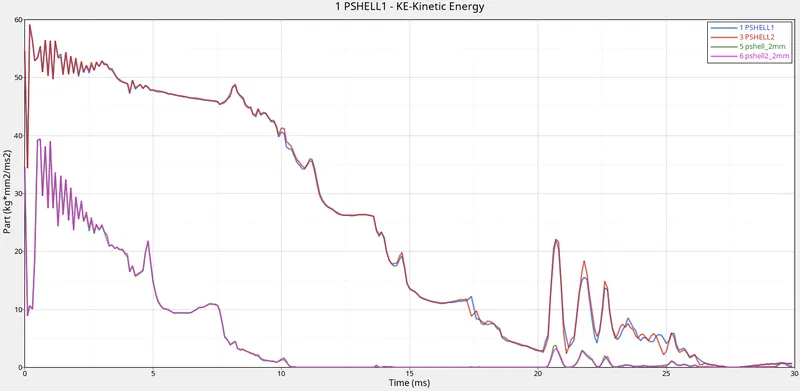
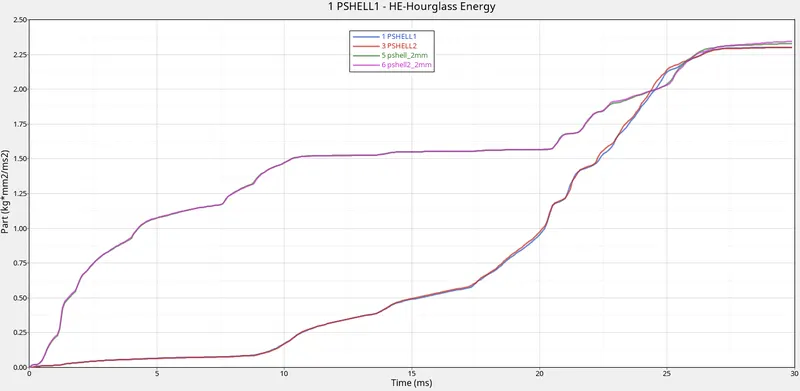
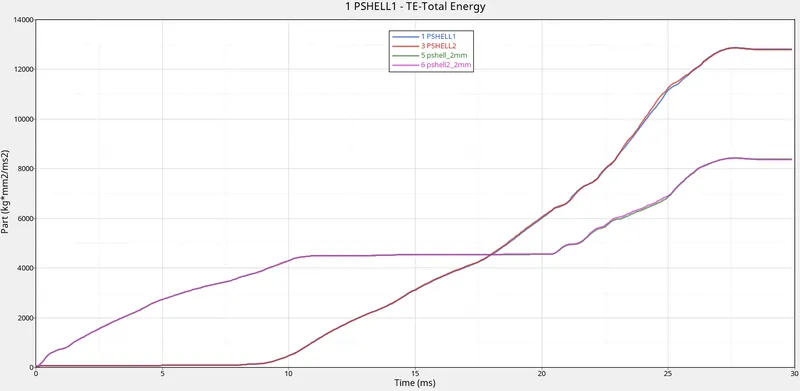
Case 5 : In this case , we have created a notch at the center of the model .
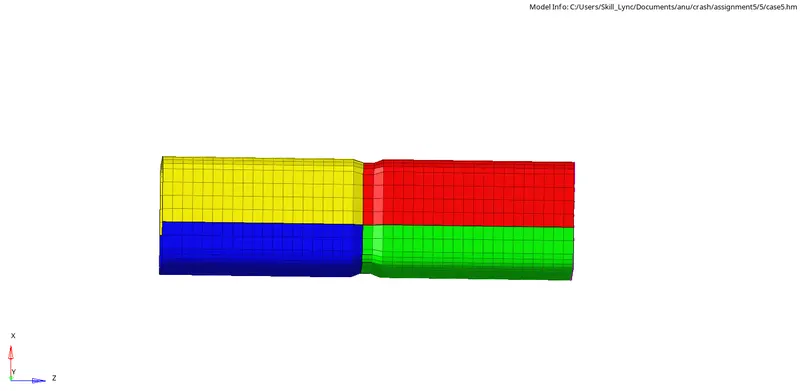
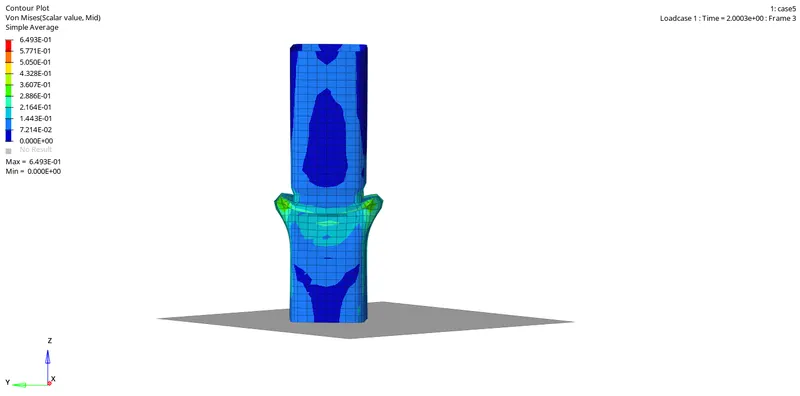
From the animation , we understand that the deformation begins to occur from the bottom of the notch just like in case 1,2 and 3 . The peak von mises stress value is around 64.93 GPa , which is slightly lower than case 4 .
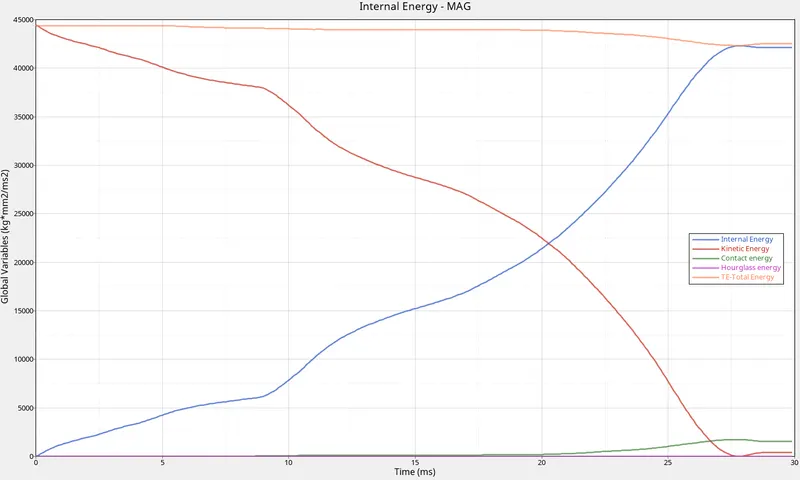
From the energy graph , we understand that the curves are almost very similar to that of case 4 , including time of peak internal energy (approx 27.5 ms ).
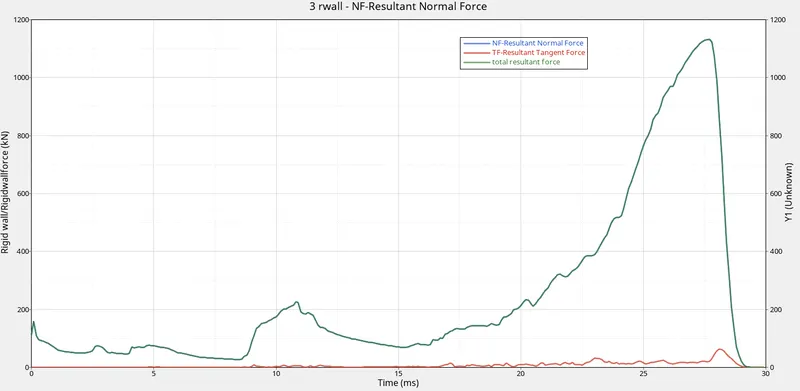
From forces graph , we understand that peak value of net resultant force is approximately 1120 kN , which is slightly lower than case 4 . The peak value is reached at approximately 27.5ms .
The TH/PART for each component have been plotted .
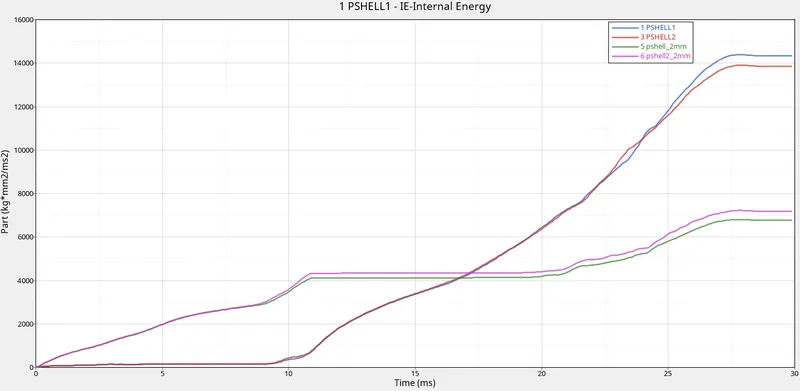
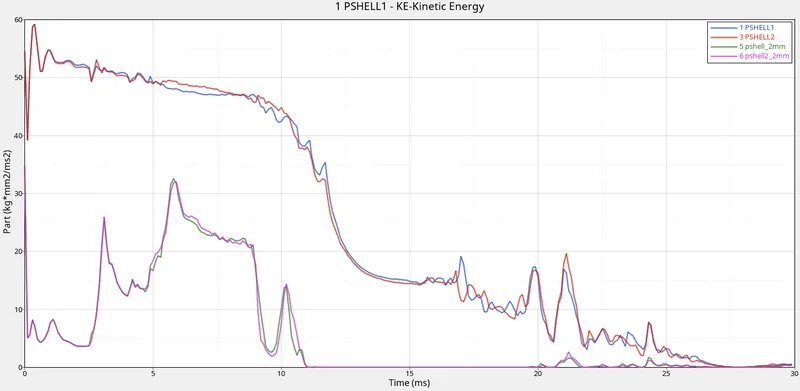
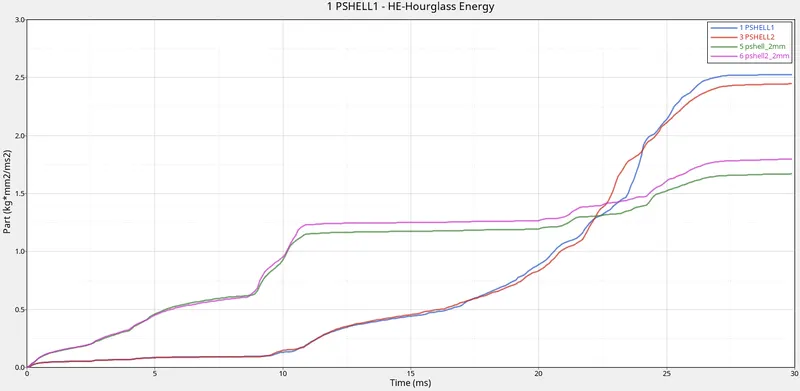
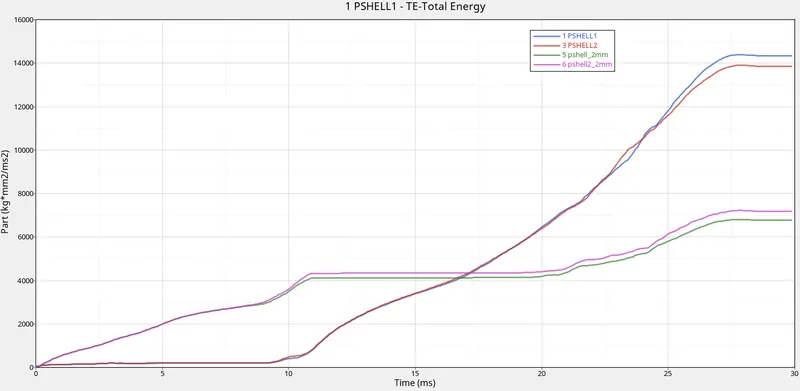
Case 6 : In this case , a notch is created on 2 opposing sides .
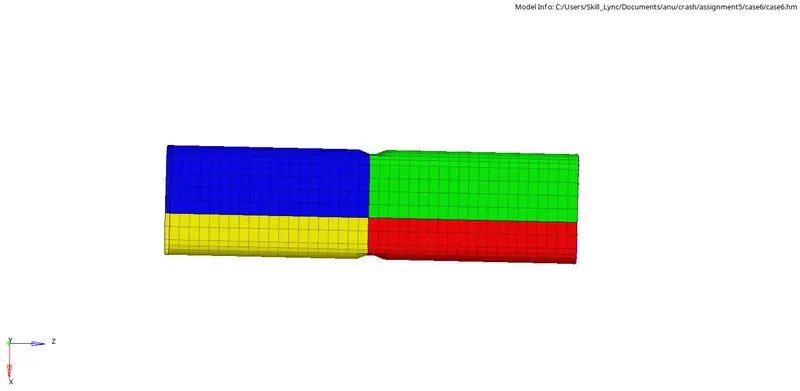
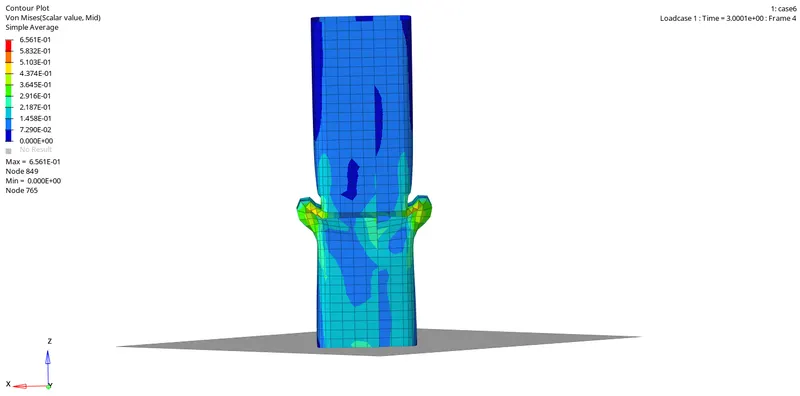
From the animation , we understand that the deformation begins to occur from just below the notch , like in cases 1,2,3 and 5 . The peak value of Von mises stress is 65.61 GPa . which is the highest .
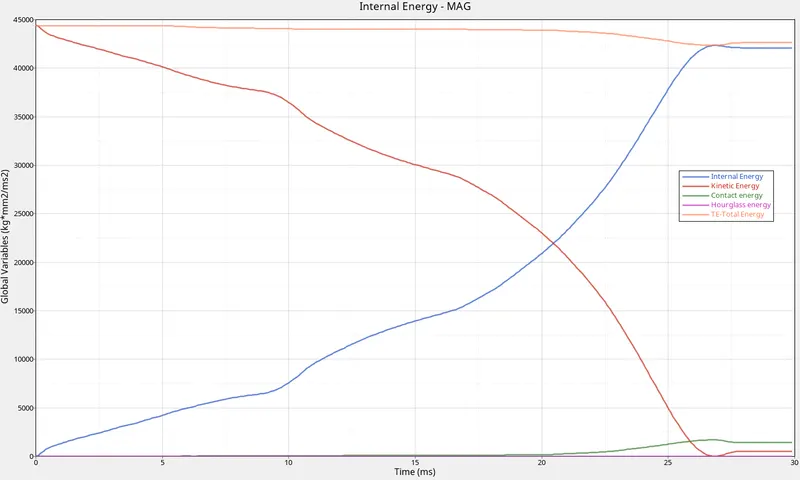
From the energy graphs , we understand that the curves are very similar to that of case 5 , however the time at which peak value of internal energy is reached is around 1ms earlier than that of case 5 .
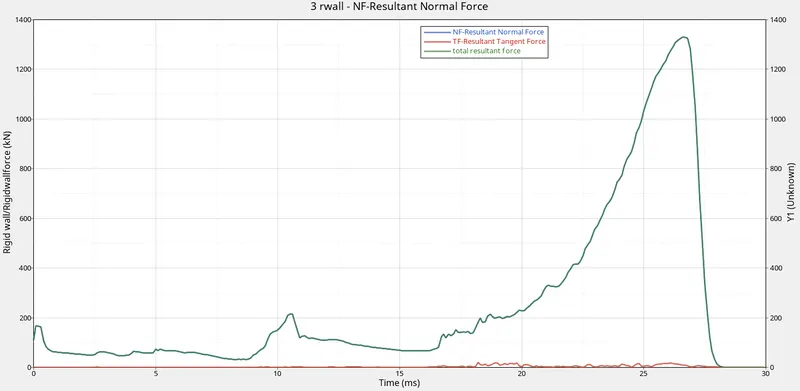
From the forces graph , we understand that the peak value of total resultant force is around 1350 kN . It is reached just after 25ms .
The TH/PART for all components have been created .
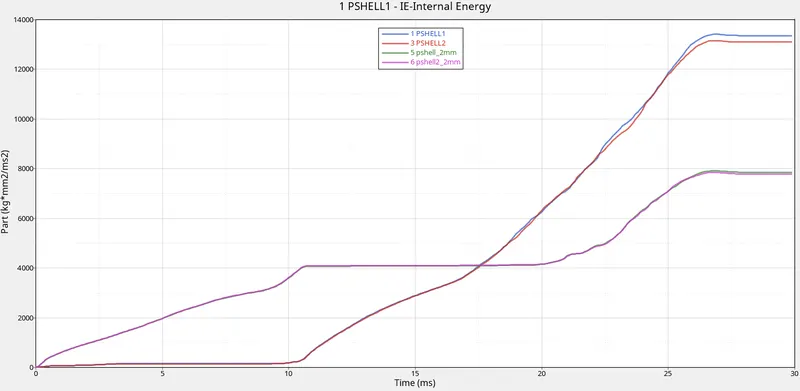
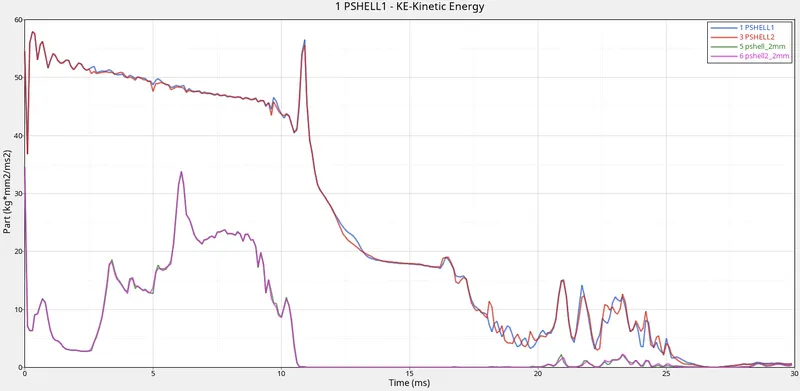
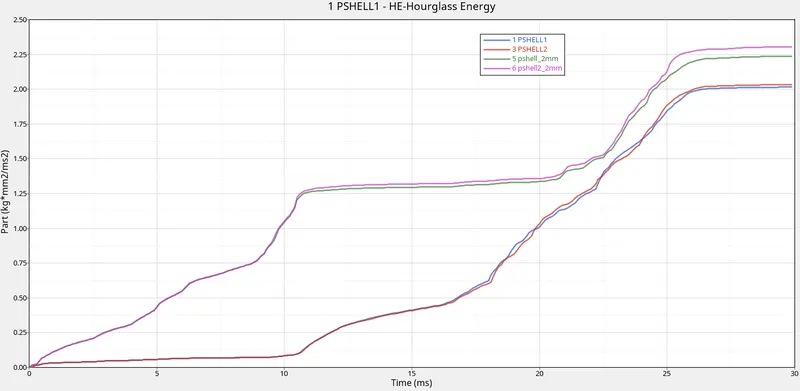
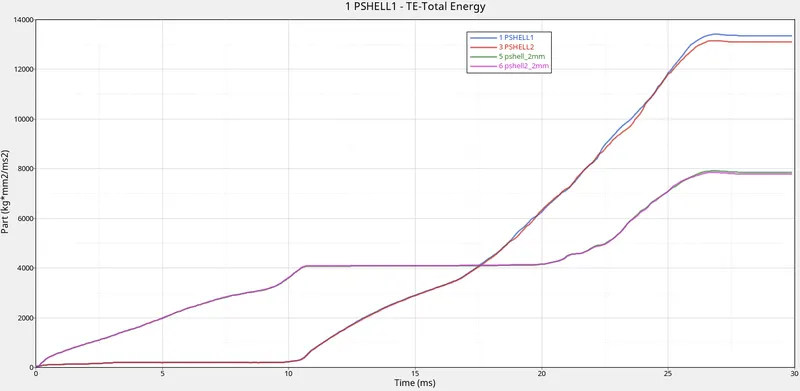
Conclusion : From the given graphs , we can conclude that case 4 represents the ideal scenario because
a) The time at which peak internal energy is reached is maximum when compared to all other cases , except case 5 .
b) Von mises stress value is slightly less than case 5 .