Assignment 5
Aim : To analyze and compare different cases with various contact types and different parameters as well as notch position and compare the result for the same boundary conditions.
Crash_tube_000.rad
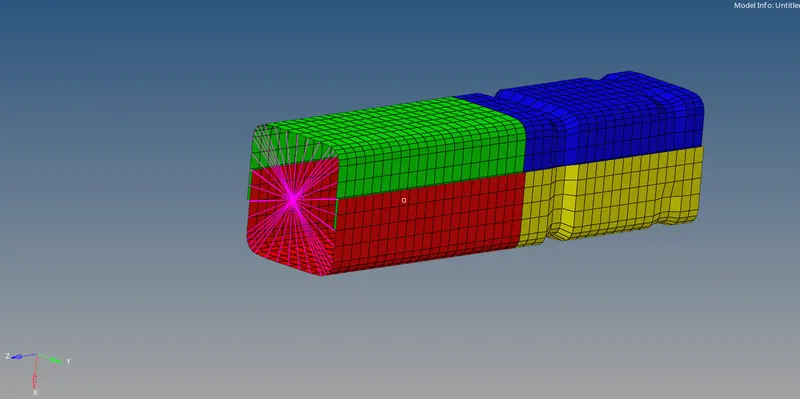
The model is the crash tube with hollow square configuration meshed with all qaud QEPH 24
shell elements. Two halves of the tube are joined with a welded contact.The face of the tube has several notches placed symmetrically.An initial velocity of about 50kmph is applied at top of the tube with the help of rigid body translation in 'Z axis'.
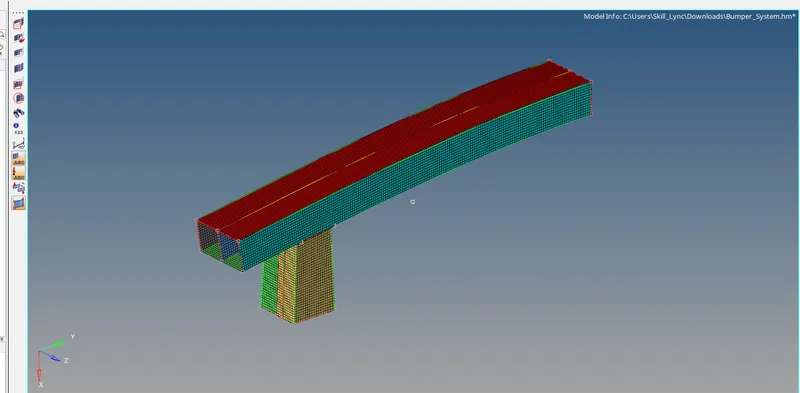
Creating the mesh for bumper assembly, mesh size should be 6mm .
Case 1:Run the Crash tube model as it is
The Crash tube model is run as it is. Default parameter for the contacts. Type 7 contact defined as to prevent penetration (due to crushing).
Contact interface
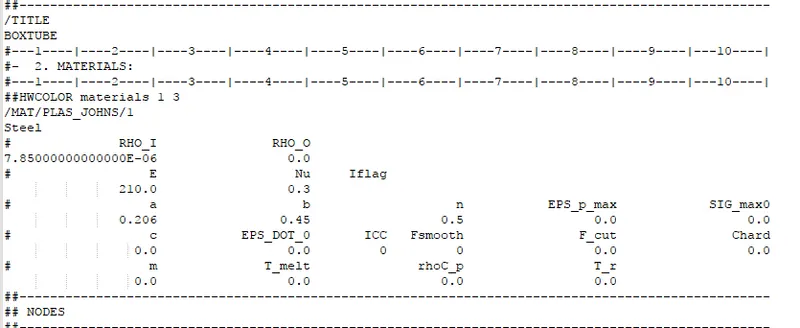
The file is open using notepad 'crush_tube_0000.rad'
After solving the model , check the output errors , open Crush_tube_0001.out file
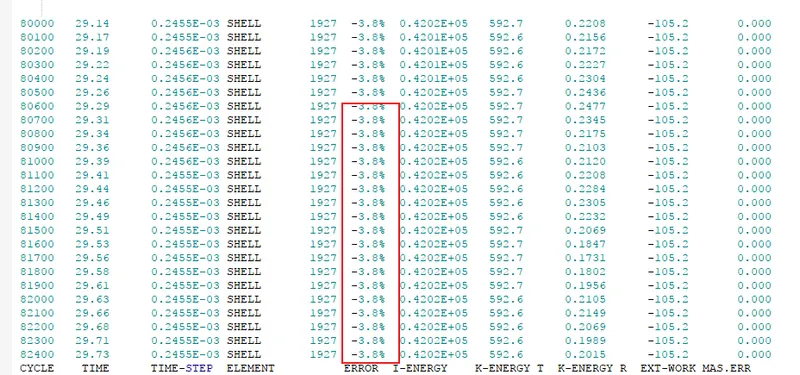
Maximum energy error is this base simulation case is -3.8%
energy error is acceptable upto 15%
Therefore positive signal for further the simulation
Maximum mass error is 0.000
1.Displacement
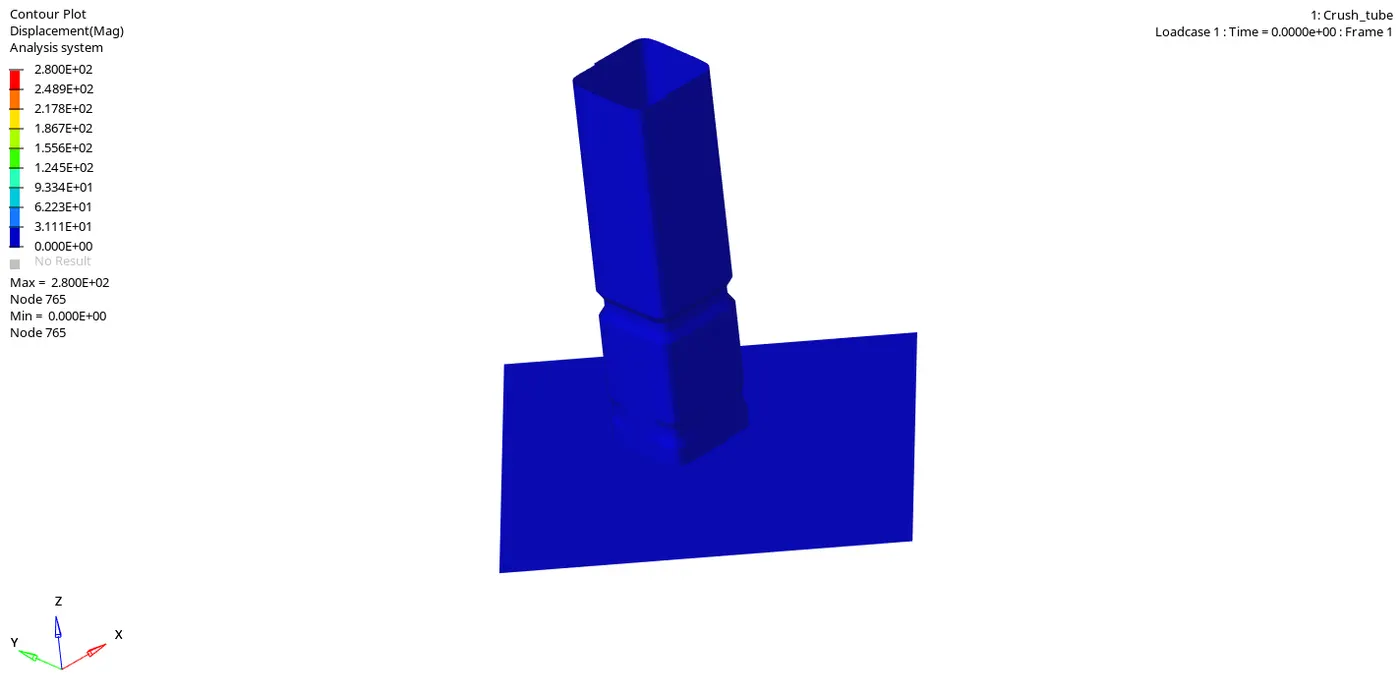
Maximum Displacement at nodes 765 is 2.800E+02 and minimum is 0.000 at node 765.
2. Von-mises
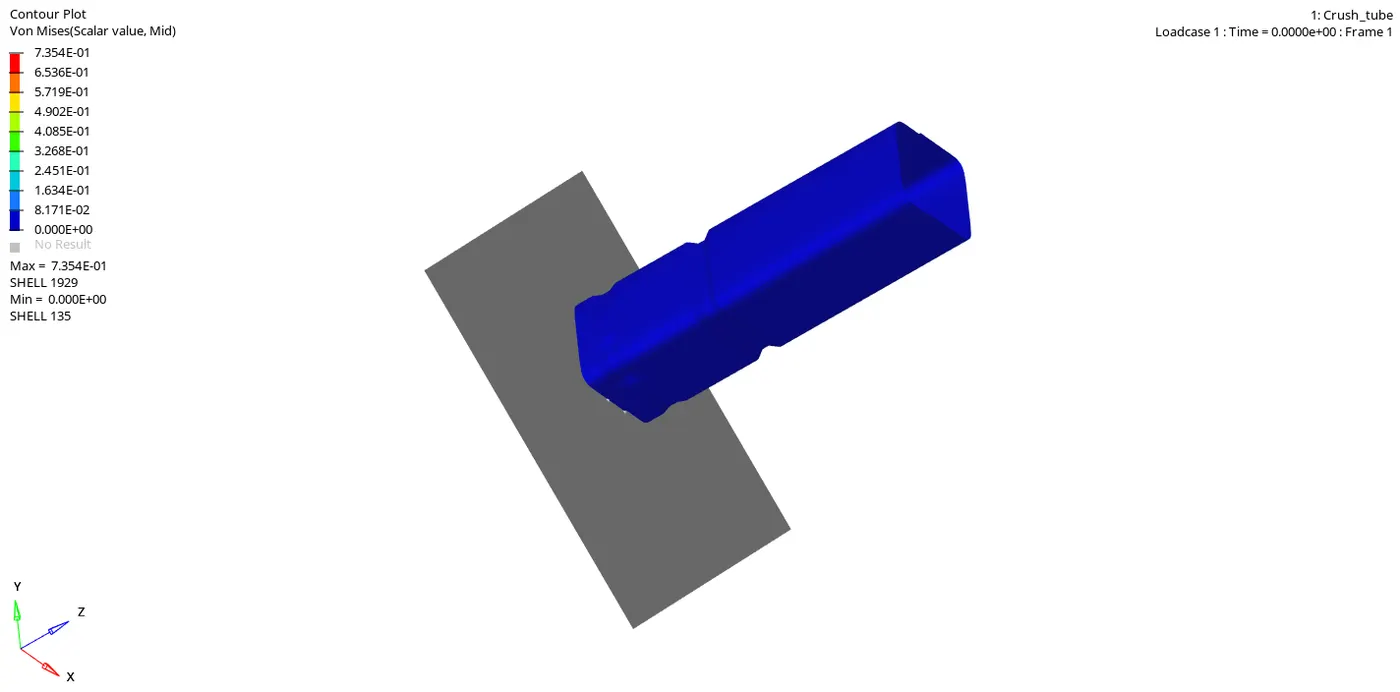
Maximum Value of Von-mises at 1929 shell is 7.354E-01 and minimum value is 0.000E+00
Graph 1 : Internal Energy, Kinetic energy, contact energy , Hourglass energy and total energy
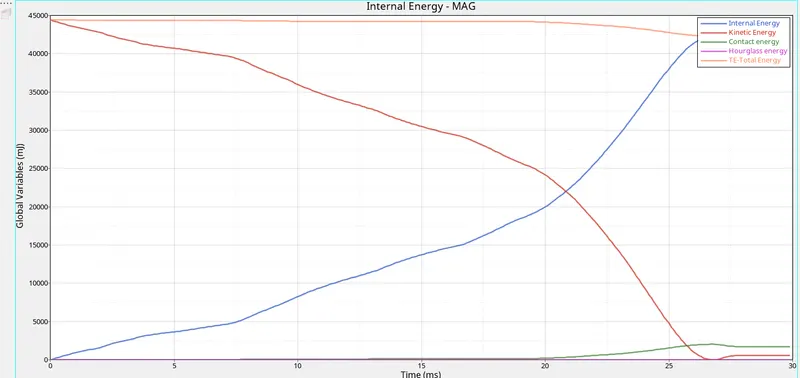
As we know that, T.E =I.E +K.E +Contact energy +Hourglass Energy
as tube hit the plate its internal energy increases with time and kinetic energy decreases with time and as the gap between two plates decreases after collision the heat is decipiated from it so contact energy increases thats why total energy decreases after 25ms .
Graph 2:Internal Energy
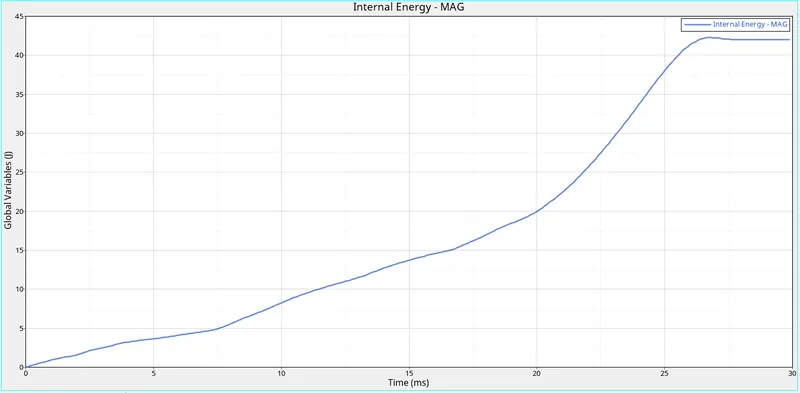
Maximum value of internal energy is 42500J and increases continuously with time and acheived maximum value at 30 ms. The tube get deformed after hitting the plate its internal energy is getting increases and after 26ms flattening of tube takes places this result the internal energy becomes constant.
Graph 3: Kinetic energy
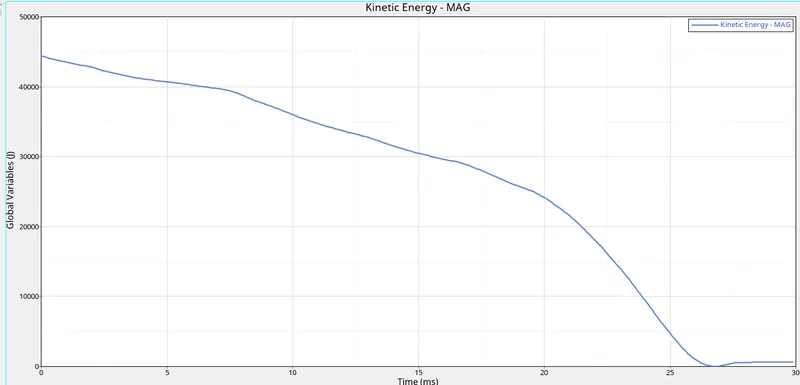
As describe in the previous slides the internal energy of the system is mirroring K.E plot. The contact energy which represents contact forces is till 20ms. As there isn't room for further absorption of energy the whole crushed tube acts as a block nodes from penetrating segment of the tube and is reflecting on the graph. An initial velocity of about 50kmph is applied at top of the tube with the help of rigid body translation in 'Z axis' ,so its kinetic energy is maximum at the begining but it get reducing with time as velocity decreases . K.E =`1/2mv^2`
Graph 4: Total resultant Force Vs normal force
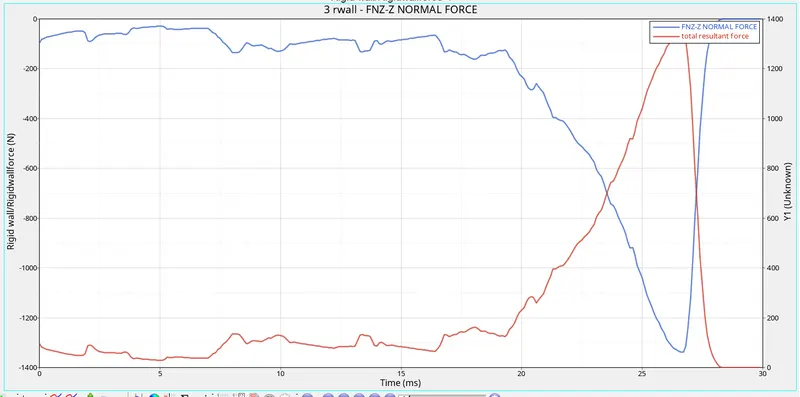
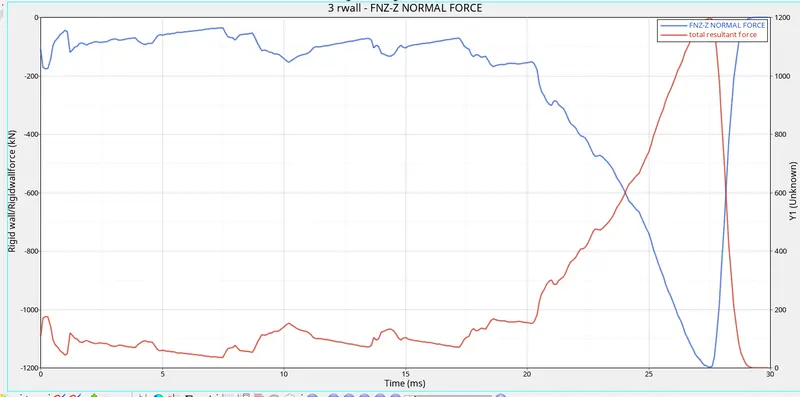
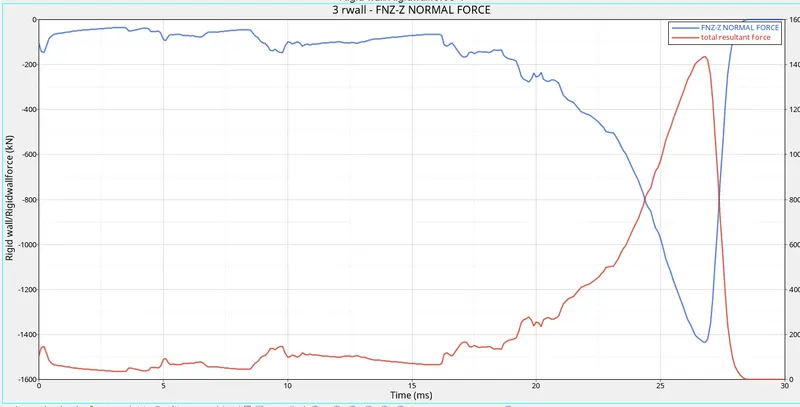
The peak in the rigid wall force are seen after valley as the crumbling of tube divides the tube into two parts momentarily, which consumes some energy and hence less force is generated on wall.The continuation of force as velocity pushes the upper part into lower causing it to become single unit again. this process repeats itself till the whole tube is crushed into a small densed box. After peaking at 28ms no further transmission of force is seen as the thick crushed tube below the rigid body node resists further compression. A significantly higher force is required to flatten the crushed tube. the same is reflected in K.E plot .
Case 2: Change the Inacti=6 and run
Contact interface:
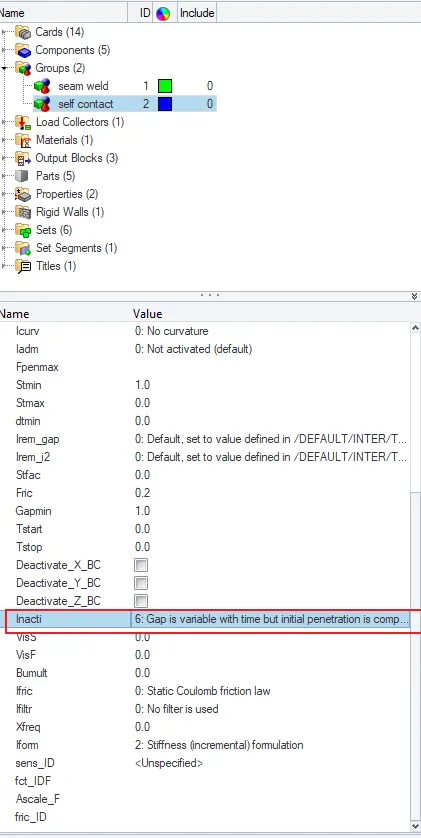
'Crush_Inacti_6_0000.rad'
After solving the model , check the output errors , open Crush_tube_0001.out file
Maximum energy error is this base simulation case is -3.8%
energy error is acceptable upto 15%
Therefore positive signal for further simulation
Maximum mass error is 0.000
1. Displacement
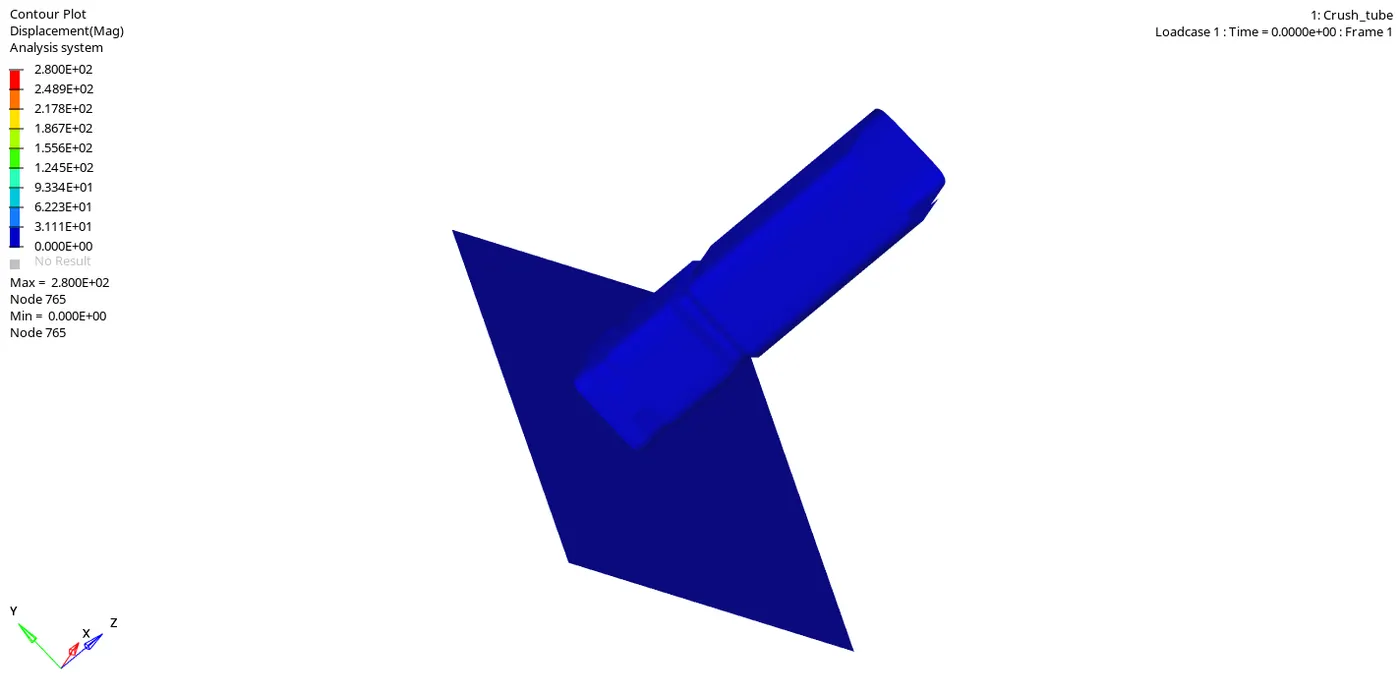
The Displacement at node 765 is at peak of maximum 2.800E+02 and Node 765 and minimum 0.000
2. von-mises
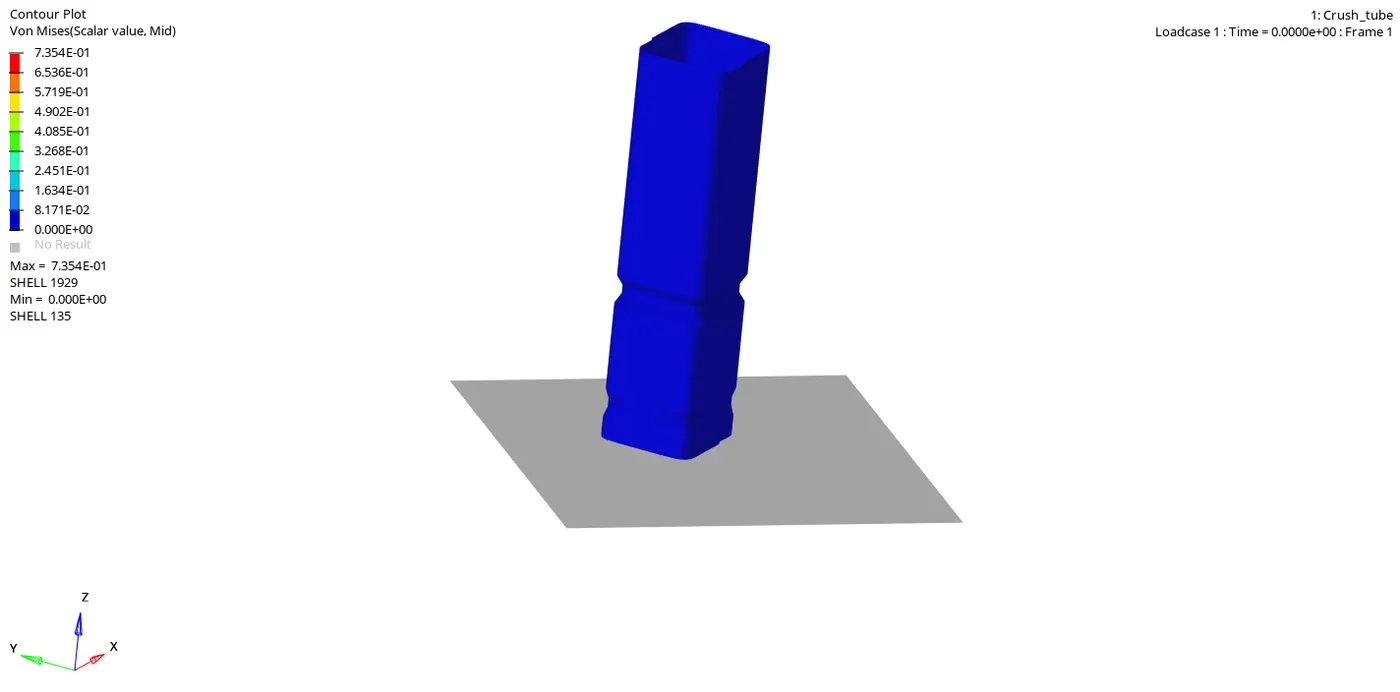
Maximum value of 7.354E-01 at shell 1929 and minimum value of 0.000 at shell 135.
Graph 1 : Internal energy
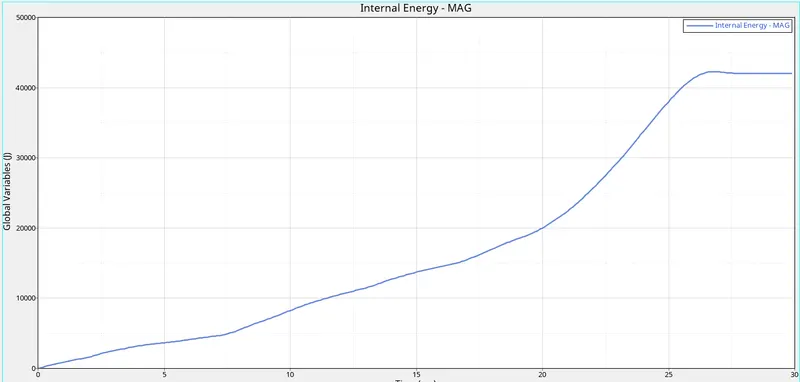
Maximum value of internal energy is 42500J and increases continuously with time and acheived maximum value at 30 ms. The tube get deformed after hitting the plate its internal energy is getting increases and after 26ms flattening of tube takes places this result the internal energy becomes constant.
Graph 2 :Normal Force Vs total resultant force
graph 3:Internal Energy,kinetic energy,contact energy, hourglass energy, Total energy.
As we know that, T.E =I.E +K.E +Contact energy +Hourglass Energy
as tube hit the plate its internal energy increases with time and kinetic energy decreases with time and as the gap between two plates decreases after collision the heat is decipiated from it so contact energy increases thats why total energy decreases after 25ms
An initial velocity of about 50kmph is applied at top of the tube with the help of rigid body translation in 'Z axis' ,so its kinetic energy is maximum at the begining but it is getting reduce with time as velocity decreases . K.E =`1/2mv^2`
Case 3: Create type 11 contact and run
Contact interface :
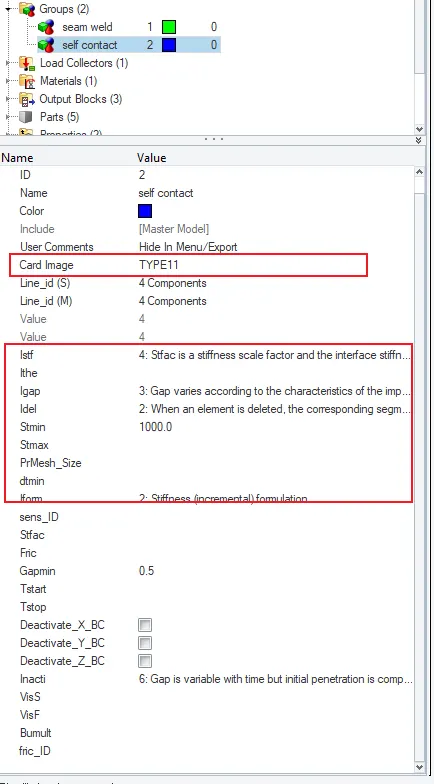
After solving the model , check the output errors , open Crush_tube_0001.out file
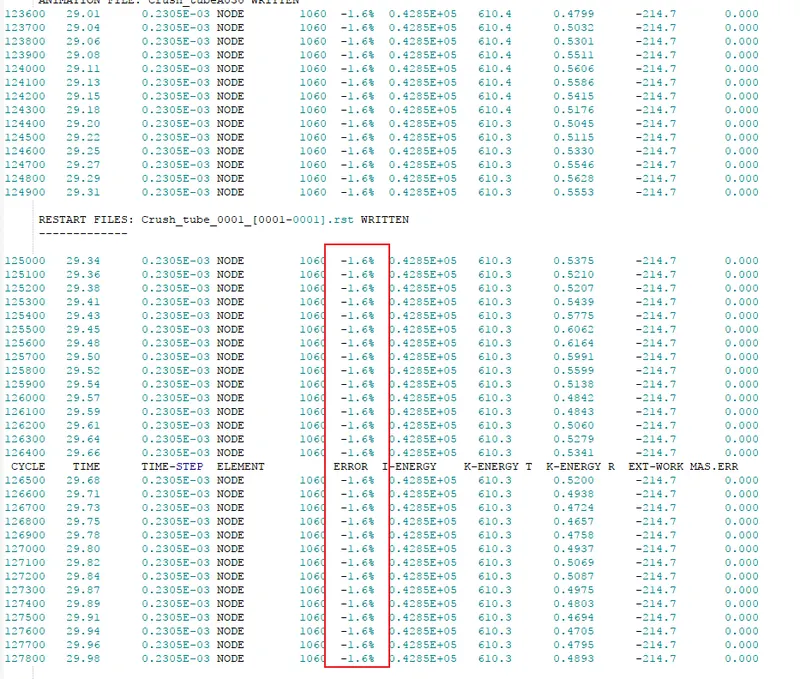
Maximum energy error is this base simulation case is -1.6%
energy error is acceptable upto 15%
Therefore positive signal for further simulation
Maximum mass error is 0.000
Displacement :
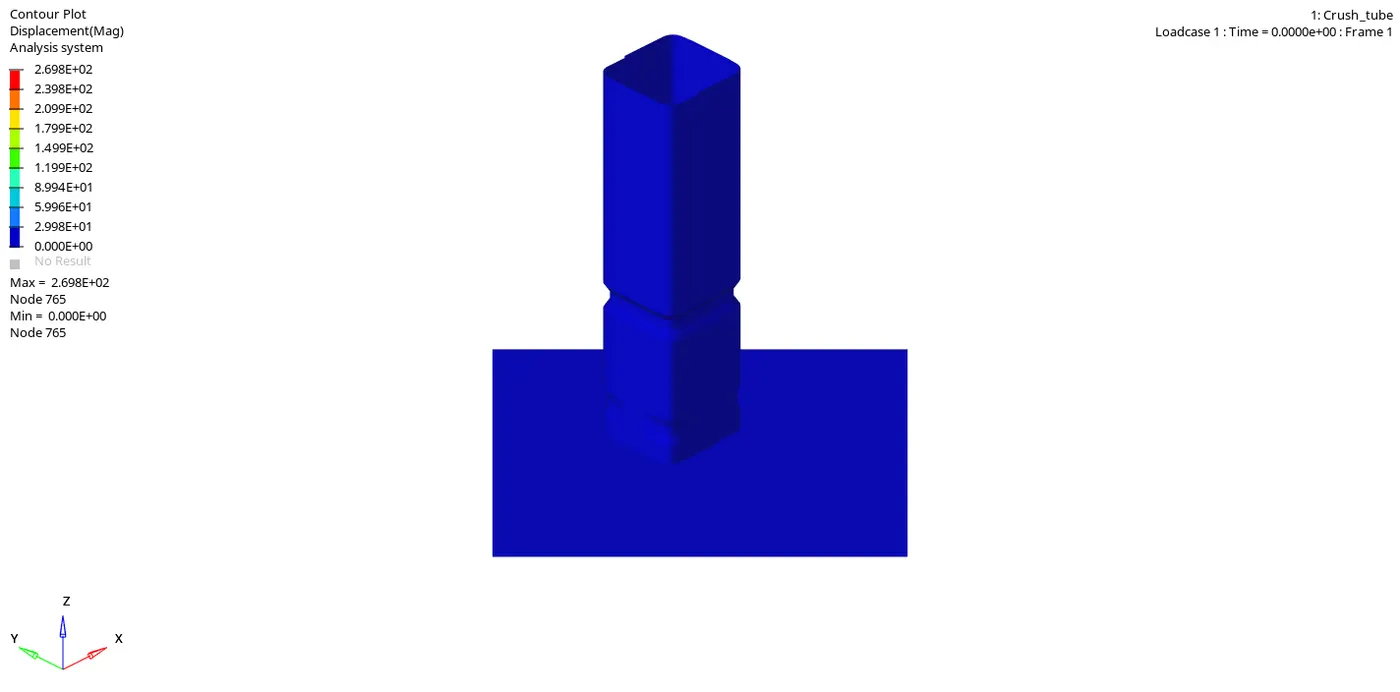
Peak value of displacement at 765 node is 2.698E+02 and minimum value is 0.000 at node 765.
Von-mises
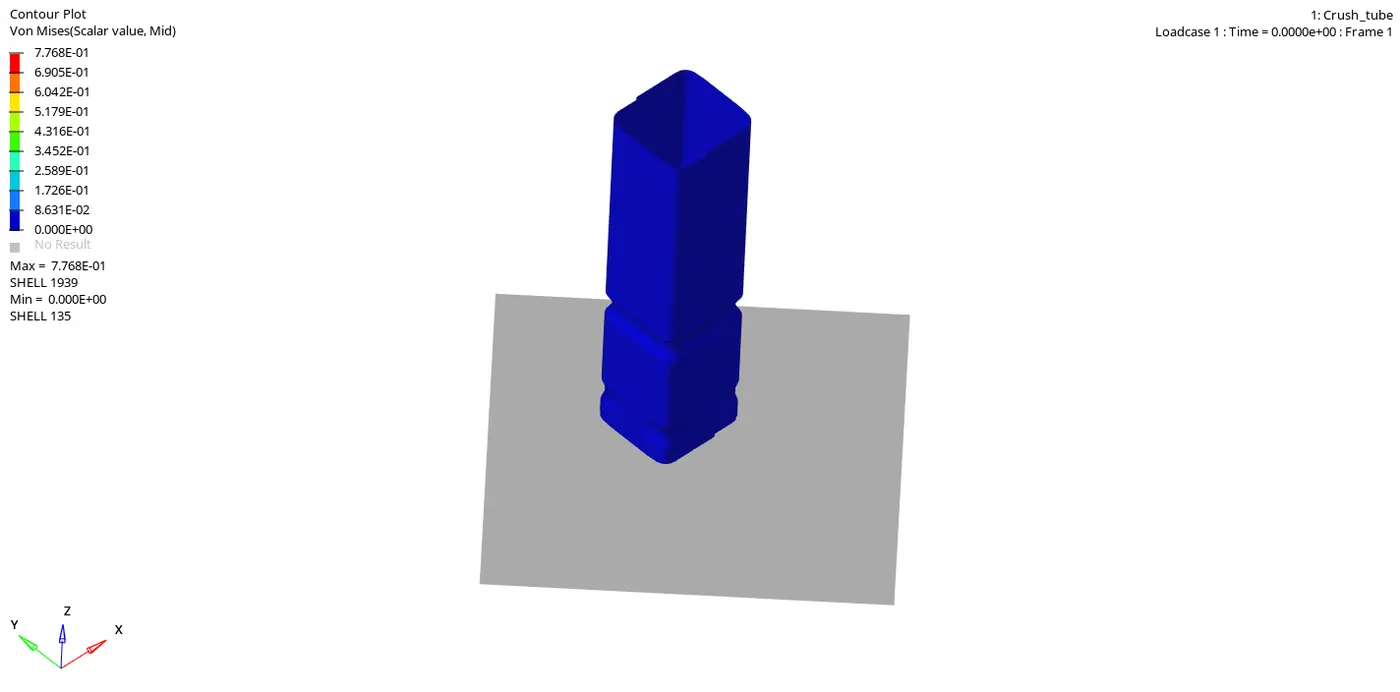
Maximum value is 7.768E-01 at node 1939 and minimum value is 0.000 at shell 135
Graph 1 : INTERNAL ENERGY
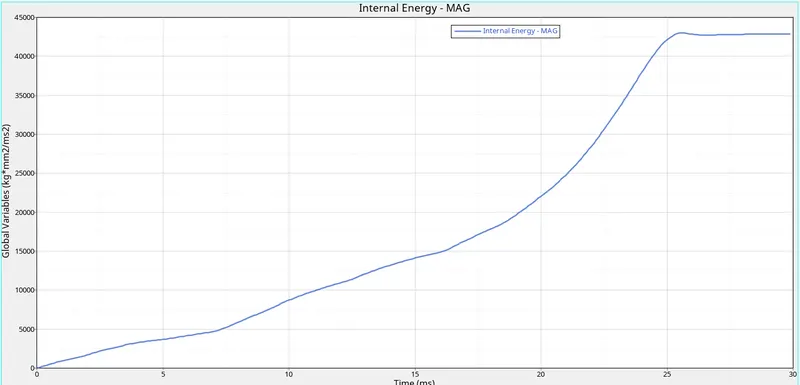
Maximum value of internal energy is 42500J and increases continuously with time and acheived maximum value at 30 ms. The tube get deformed after hitting the plate its internal energy is getting increases and after 26ms flattening of tube takes places this result the internal energy becomes constant.
Graph 2: Internal Energy, Kinetic Energy , Contact Energy, HourGlass Energy , Total Energy
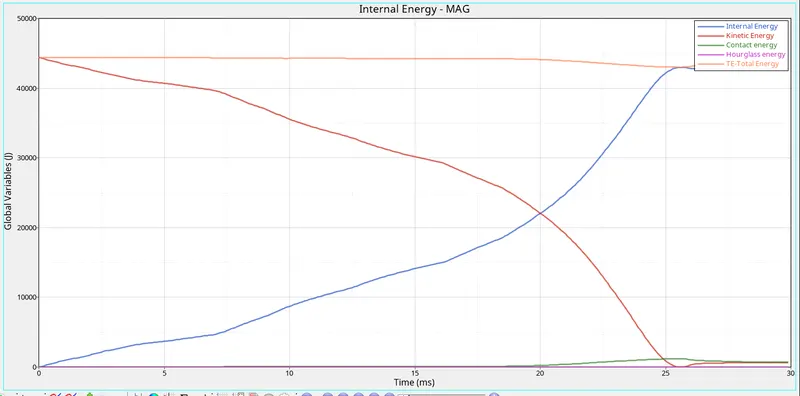
As we know that, T.E =I.E +K.E +Contact energy +Hourglass Energy
as tube hit the plate its internal energy increases with time and kinetic energy decreases with time and as the gap between two plates decreases after collision the heat is decipiated from it so contact energy increases thats why total energy decreases after 25ms . An initial velocity of about 50kmph is applied at top of the tube with the help of rigid body translation in 'Z axis' ,so its kinetic energy is maximum at the begining but it is getting reduce with time as velocity decreases . K.E =`1/2mv^2`
Graph 3:Normal Force Vs Resultant Force
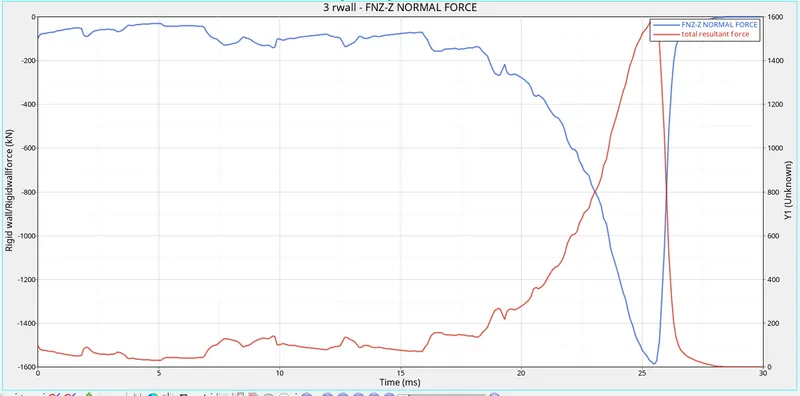
Case 4: Remove both notches and remove boundary condition on rigid body node then run.
Remove Both notches and removed boundary condition on rigid body .Means it will be free from both rotational and translation motion. Go to View > Browser >Hypermesh >Solver.
you find BCS card .
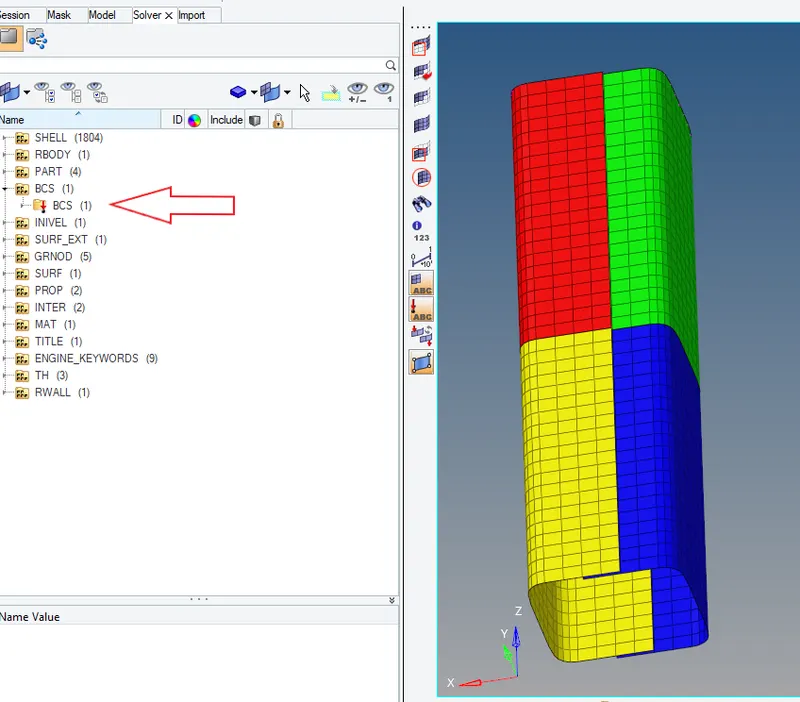
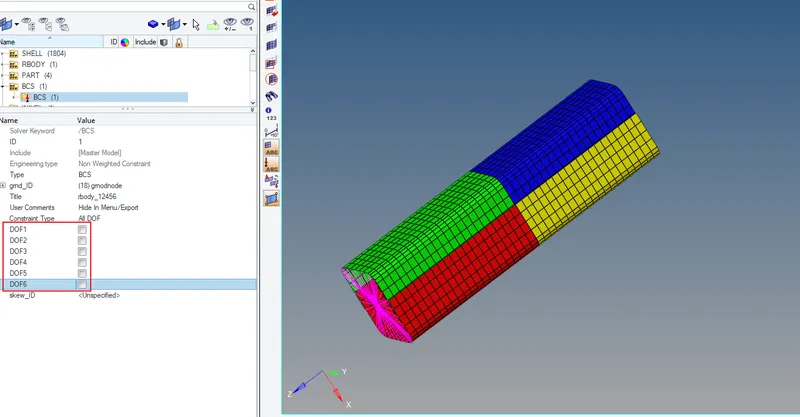
In BCS Card unchecked all DOFs and Run the file.
After solving the model , check the output errors , open Crush_tube_0001.out file.
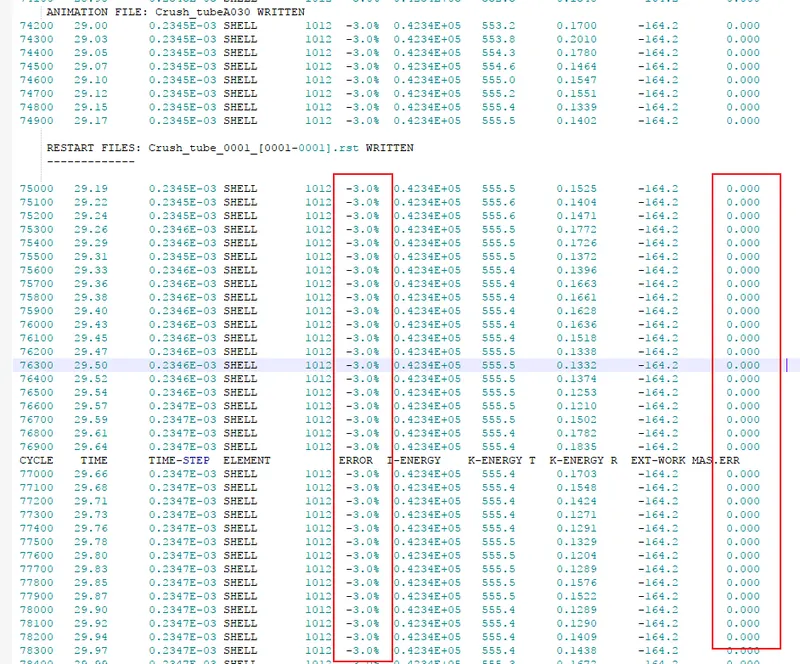
Maximum energy error is this base simulation case is -3.0%
energy error is acceptable upto 15%
Therefore positive signal for further simulation
Maximum mass error is 0.000
displacement
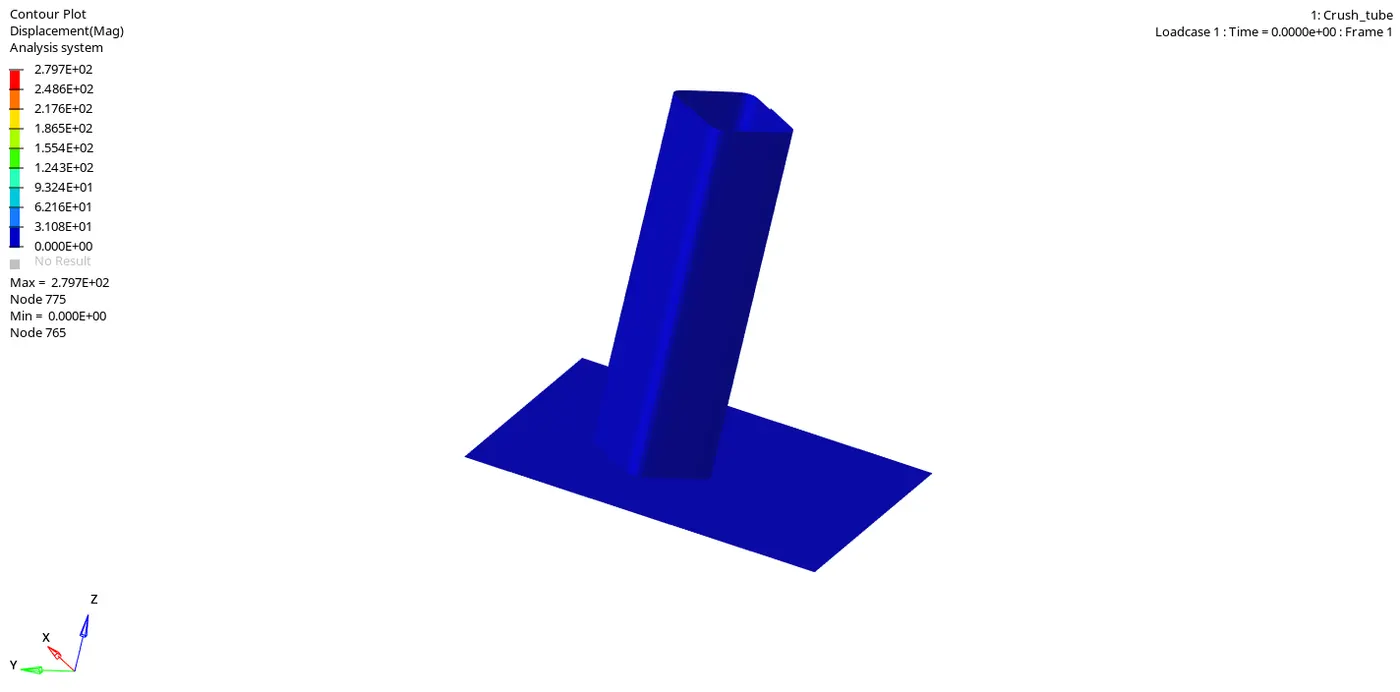
Peak value at node 775 is 2.797E+02 and minimum is zero at node 765.
Von-mises
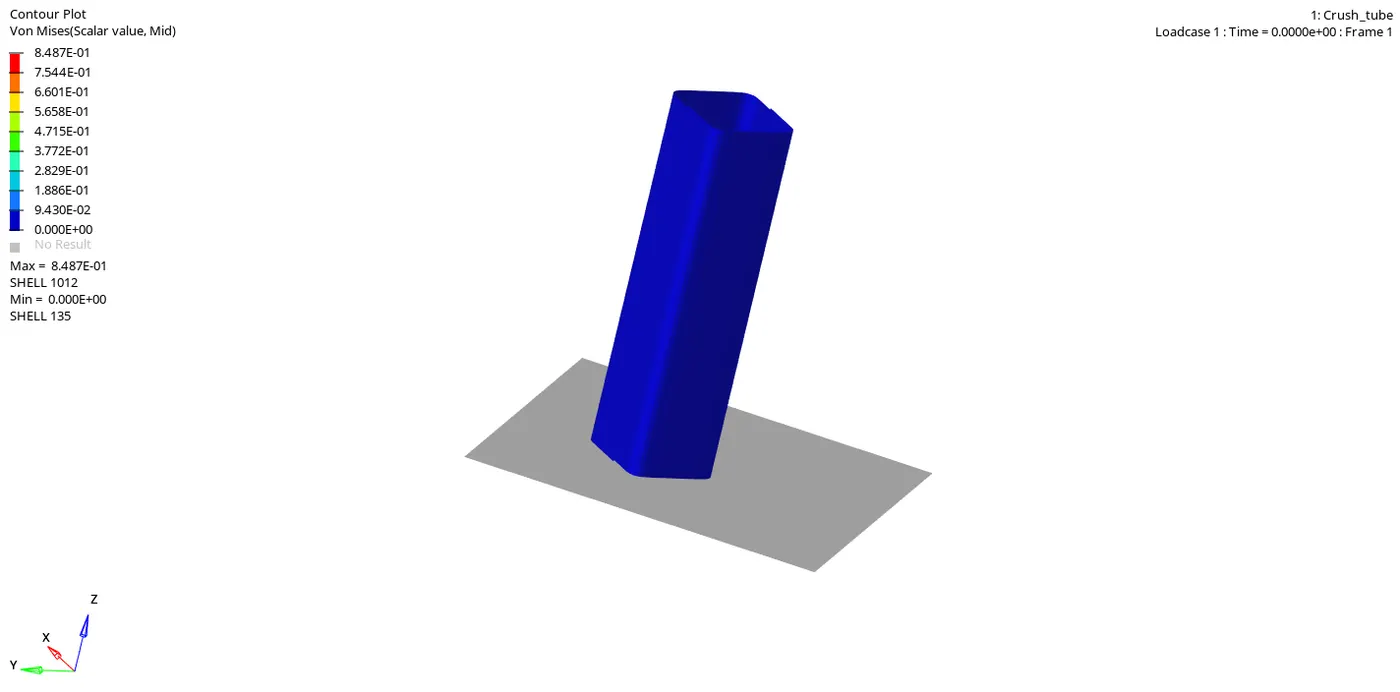
Maximum Value of von-mises is 8.487E-01 at shell 1012 and minimum value is zero at shell 135.
Graph 1 : internal energy
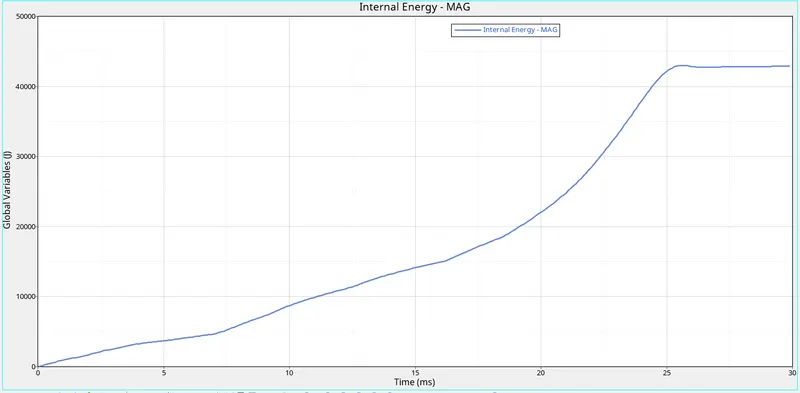
Maximum value of internal energy is 42500J and increases continuously with time and acheived maximum value at 30 ms. The tube get deformed after hitting the plate its internal energy is getting increases and after 26ms flattening of tube takes places this result the internal energy becomes constant.
Graph 2: Internal Energy, Kinetic Energy, Contact Energy, Hourglass Energy, Total Energy
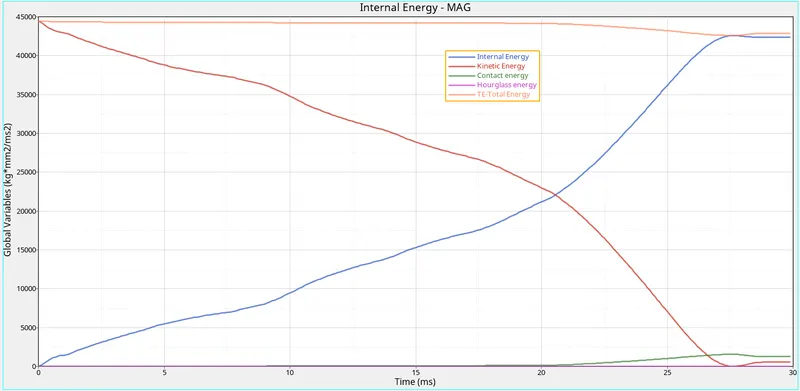
As we know that, T.E =I.E +K.E +Contact energy +Hourglass Energy
as tube hit the plate its internal energy increases with time and kinetic energy decreases with time and as the gap between two plates decreases after collision the heat is decipiated from it so contact energy increases thats why total energy decreases after 25ms . An initial velocity of about 50kmph is applied at top of the tube with the help of rigid body translation in 'Z axis' ,so its kinetic energy is maximum at the begining but it is getting reduce with time as velocity decreases . K.E =`1/2mv^2`.
Graph 3: Normal Force vs Total Resultant force
Case 5:Create a new notch in the middle select the whole section and run.
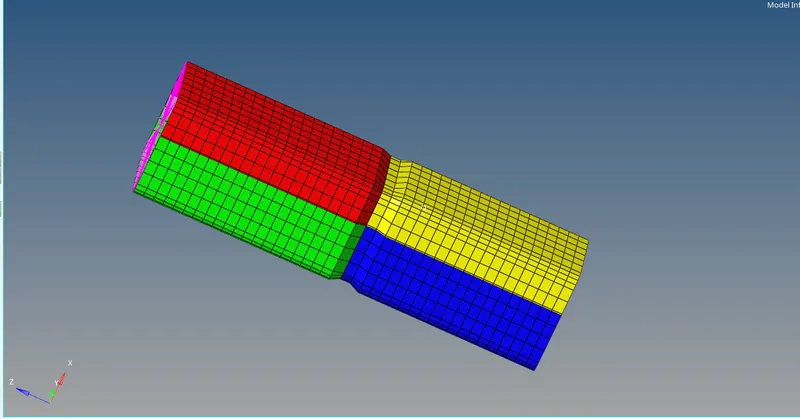
Create a new notch in middle of the crash tube on whole section by using align node command.
After solving the model , check the output errors , open Crush_tube_0001.out file
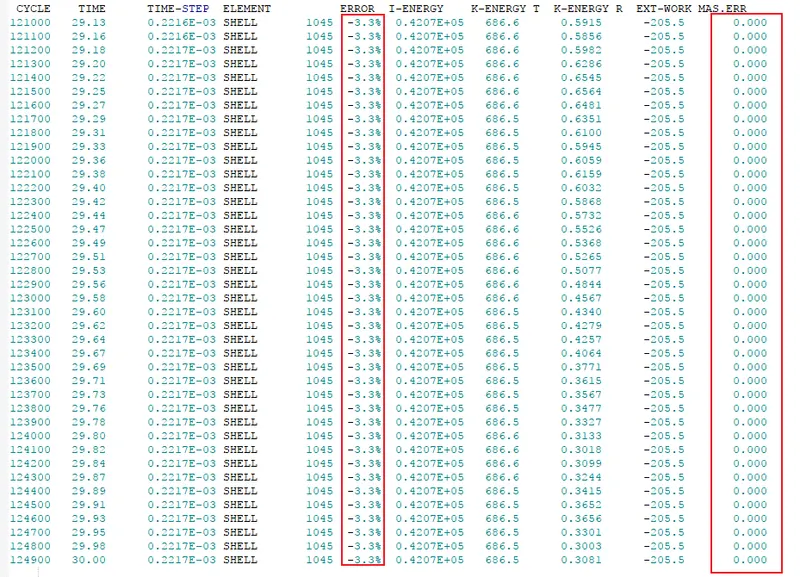
Maximum energy error is this base simulation case is -3.3%
energy error is acceptable upto 15%
Therefore positive signal for further simulation
Maximum mass error is 0.000
Displacement:
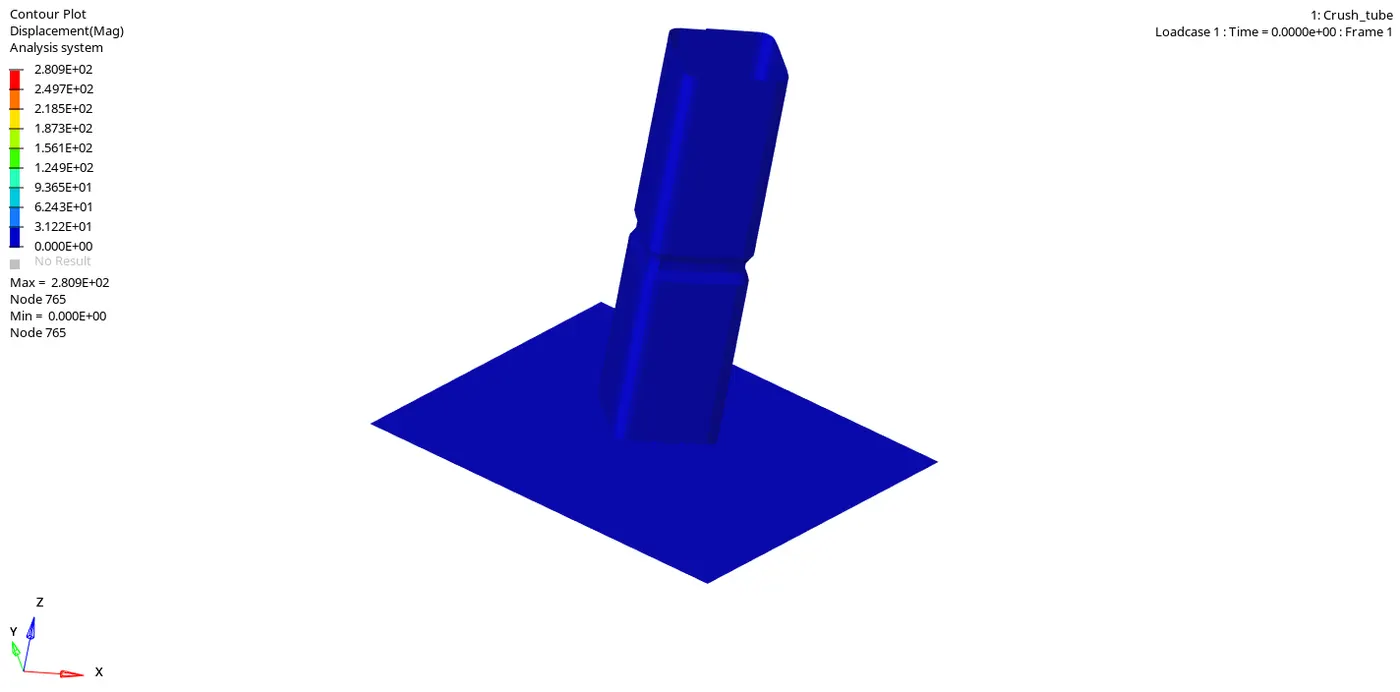
Peak value of displacement at node 765 is 2.809E+02 and minimum value is 0.000 at node 765.
2. Von-mises
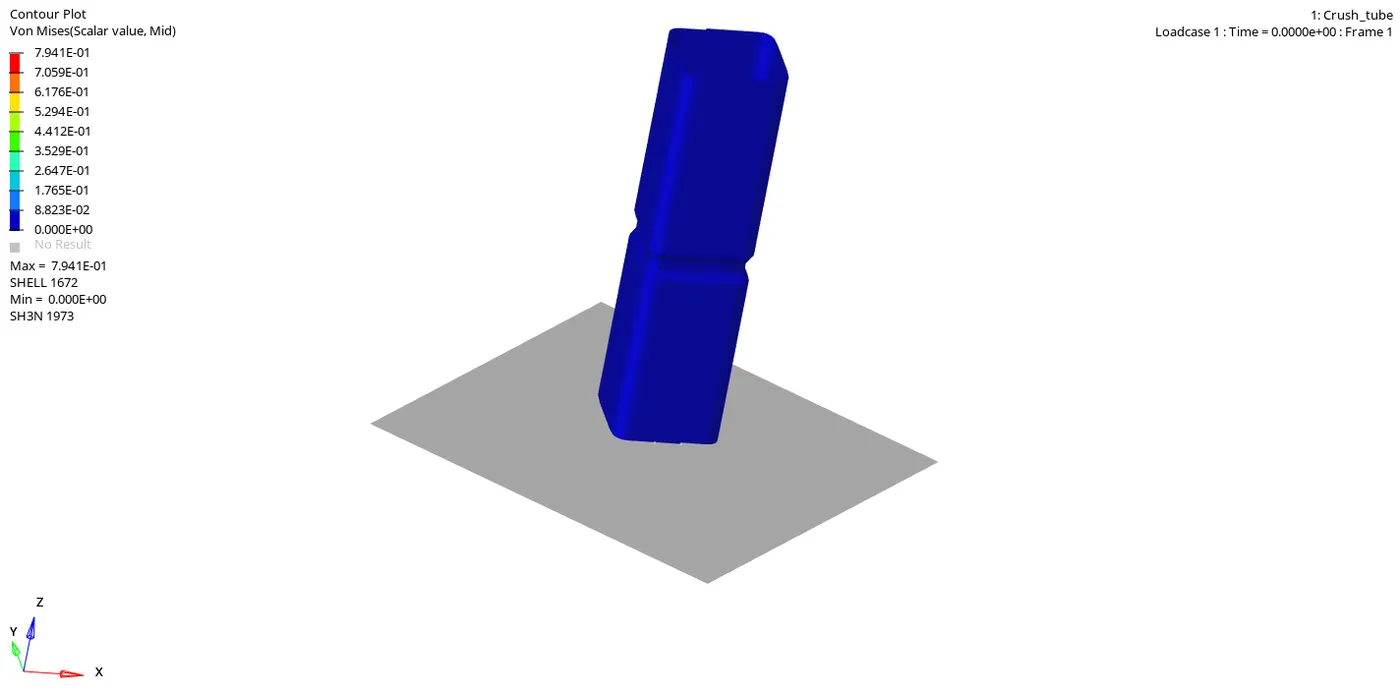
Von-mises is maximum at shell 1672 is 7.941E-01 and minimum is 0.000
Graph 1: Internal Energy
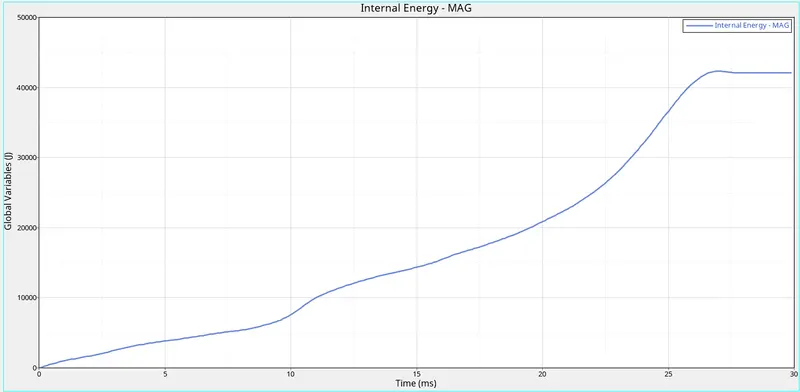
Maximum value of internal energy is 42500J and increases continuously with time and acheived maximum value at 30 ms. The tube get deformed after hitting the plate its internal energy is getting increases and after 26ms flattening of tube takes places this result the internal energy becomes constant.
Graph 2: Internal Energy, Kinetic Energy, Contact Energy, Total Energy
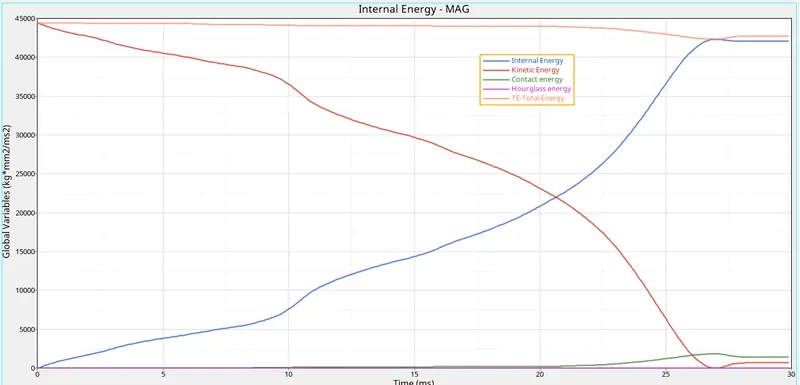
As we know that, T.E =I.E +K.E +Contact energy +Hourglass Energy
as tube hit the plate its internal energy increases with time and kinetic energy decreases with time and as the gap between two plates decreases after collision the heat is decipiated from it so contact energy increases thats why total energy decreases after 25ms. An initial velocity of about 50kmph is applied at top of the tube with the help of rigid body translation in 'Z axis' ,so its kinetic energy is maximum at the begining but it is getting reduce with time as velocity decreases . K.E =`1/2mv^2`
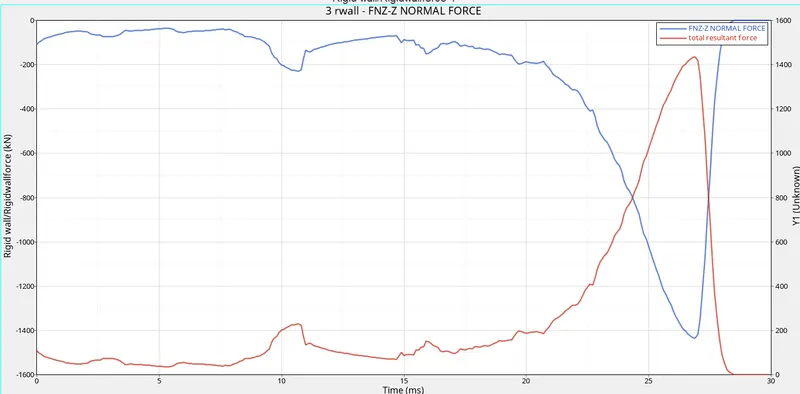
Graph 3: Normal force Vs Total resultant Force
Case 6: Create a new notch with nodes only from opposing 2 faces and run
Create a new notch only on opposite face:
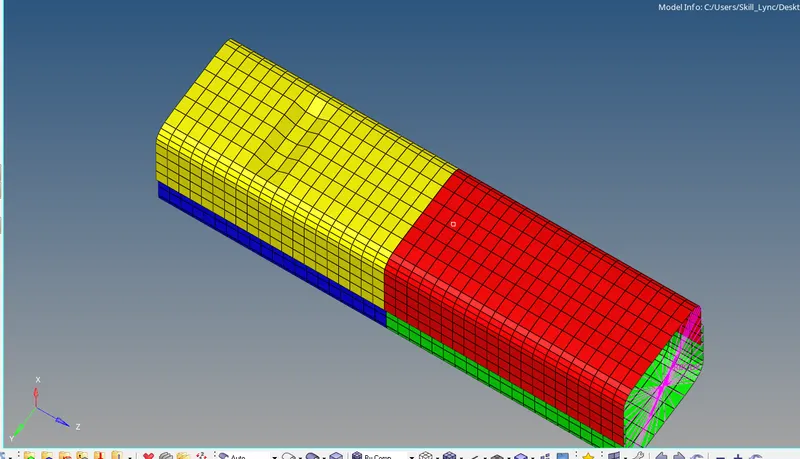
After solving the model , check the output errors , open Crush_tube_0001.out file.
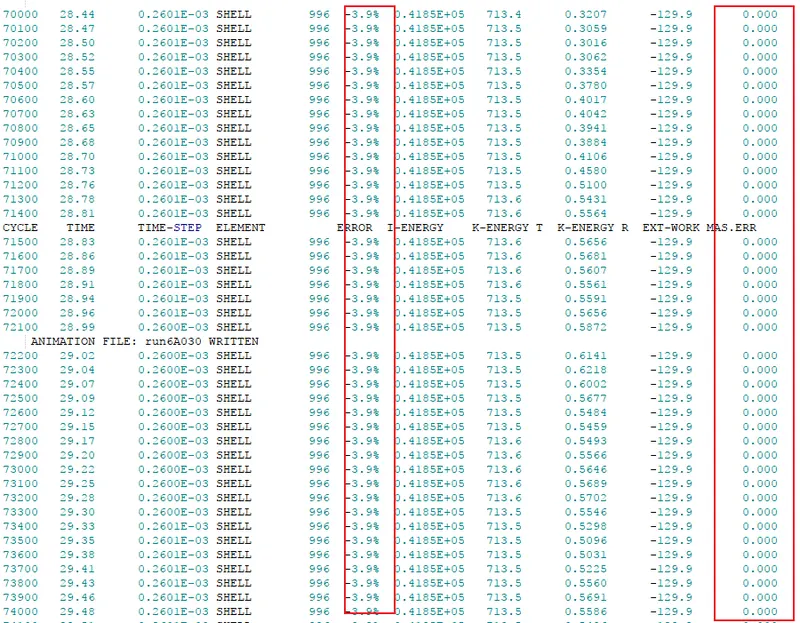
Maximum energy error is this base simulation case is -3.9%
energy error is acceptable upto 15%
Therefore positive signal for further simulation
Maximum mass error is 0.000
Displacement:
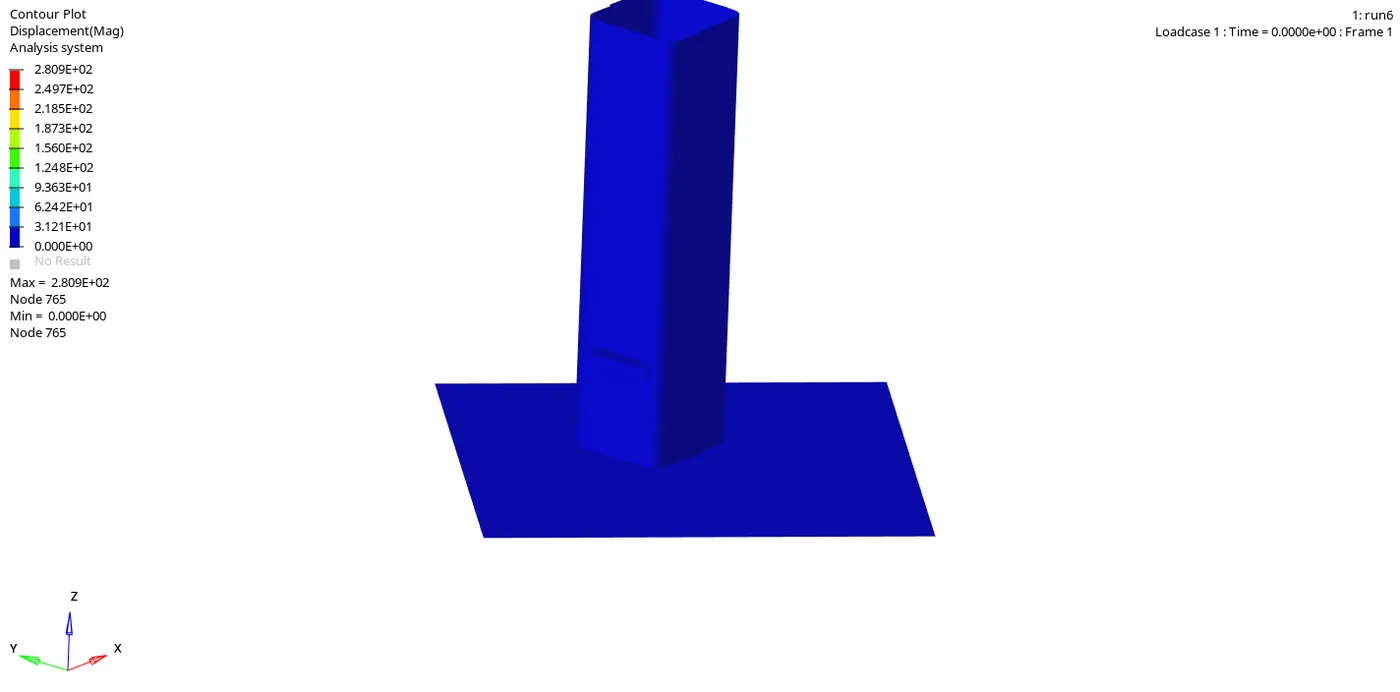
Displacement ia max. at node 765 is 2.809E+02
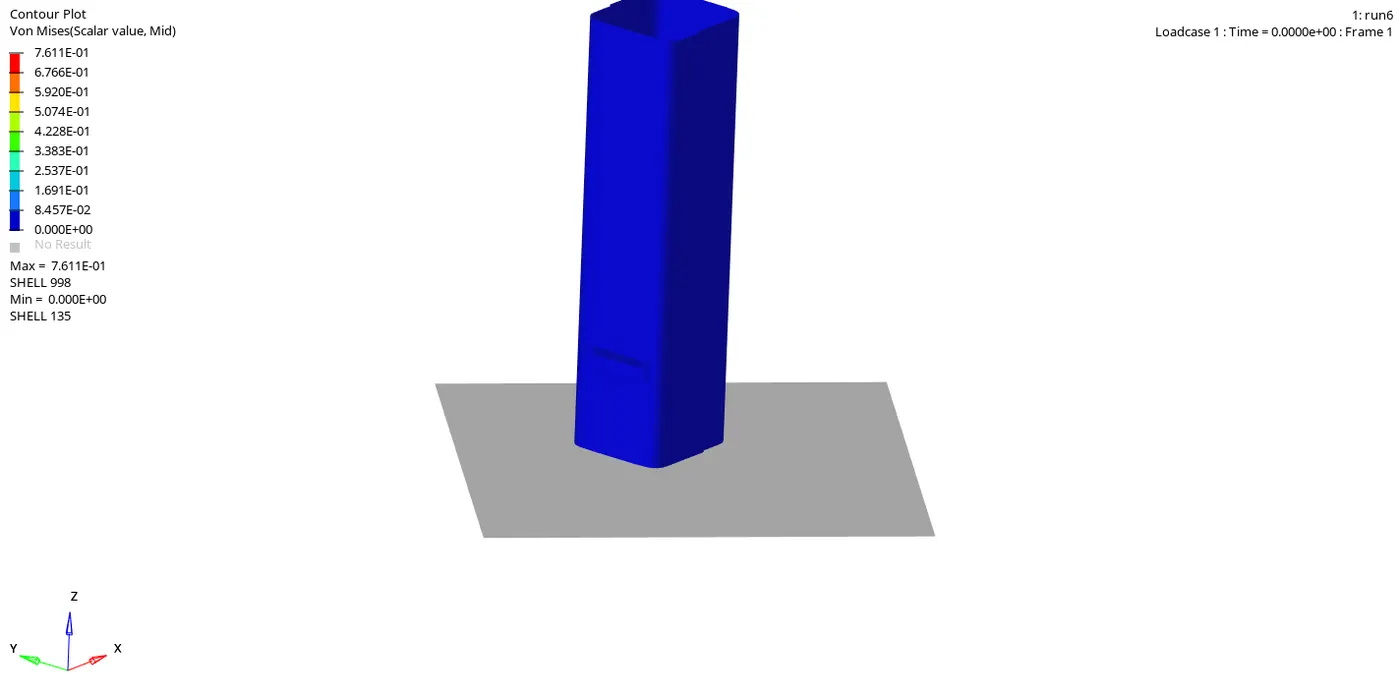
Von-mises
Graph 1:Inernal Energy, Kinetic Energy, Contact force ,Hourglass energy, Total energy
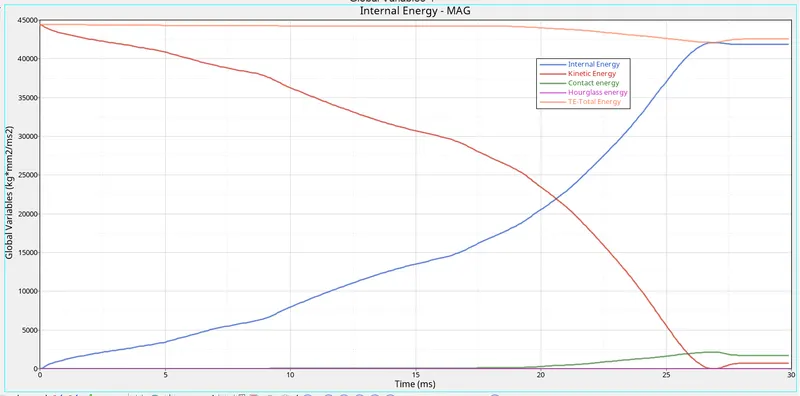
As we know that, T.E =I.E +K.E +Contact energy +Hourglass Energy
as tube hit the plate its internal energy increases with time and kinetic energy decreases with time and as the gap between two plates decreases after collision the heat is decipiated from it so contact energy increases thats why total energy decreases after 25ms .
An initial velocity of about 50kmph is applied at top of the tube with the help of rigid body translation in 'Z axis' ,so its kinetic energy is maximum at the begining but it is getting reduce with time as velocity decreases . K.E =`1/2mv^2`
Graph 2: Normal force vs total resultant force
Graph 3: internal energy
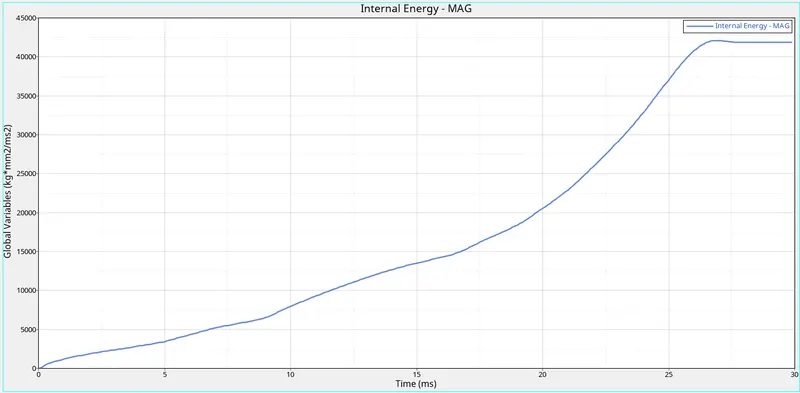
Maximum value of internal energy is 42500J and increases continuously with time and acheived maximum value at 30 ms. The tube get deformed after hitting the plate its internal energy is getting increases and after 26ms flattening of tube takes places this result the internal energy becomes constant.
Conclusion :
Summing up the results given in the previous slide a zero notched tube with boundary condition gives out the least output for contact forces, however the compression and stresses are non-uniform.
The plastic strain across the cases is within limit as no deletion of element is recorded.
A notched tube results in higher contact forces but a smoother transmission of load is seen. When placed carefully a symmetrically notched tube can undergo predictable compression with similar sized bulges to prevent any spiked in loads. Wheninput with recommended parameters, a zero notched crash tube with both types 7 and type 11 contact interfaces gives out best result.
Comparison
In case 4 (removing notch) experience less RWALL forces and contact forces.
In case 6( notches on opposite faces ) experience maximum contact forces.