Assignment 4-RADIOSS Material Laws Challenge
Objective : To compare the results of Material Law : Law2, Law 27 and Law36.
Procedure : Goto Import - Solver Deck - Failure_johnson_0000.rad - Import.
Iteration1 - Law2_EPSMax_FAILURE.
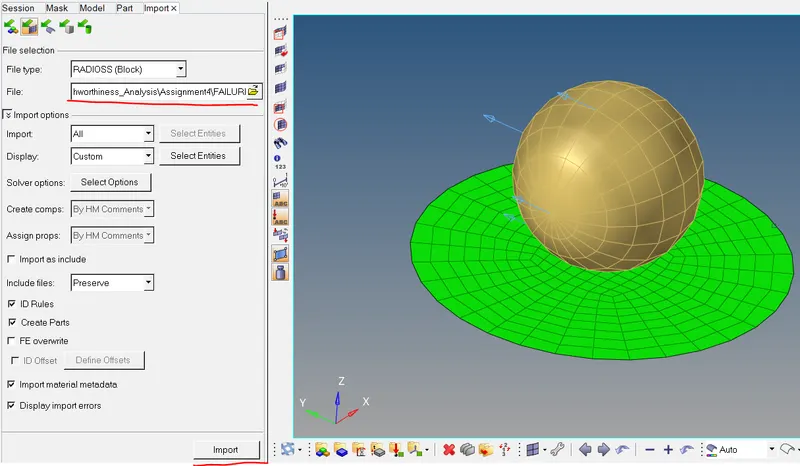
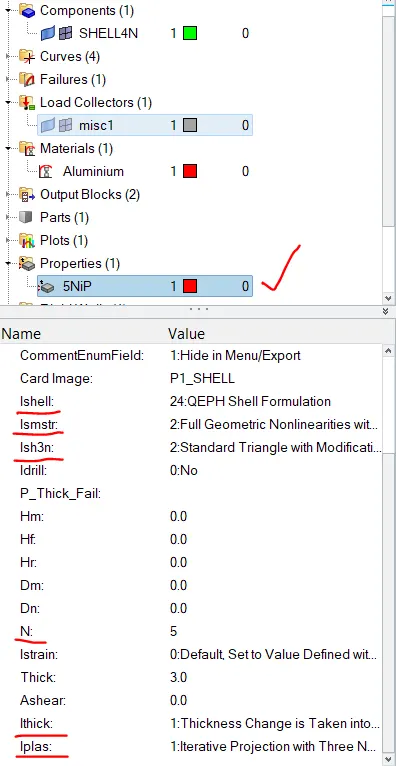
Goto the property card and change the Property to recomended properties.
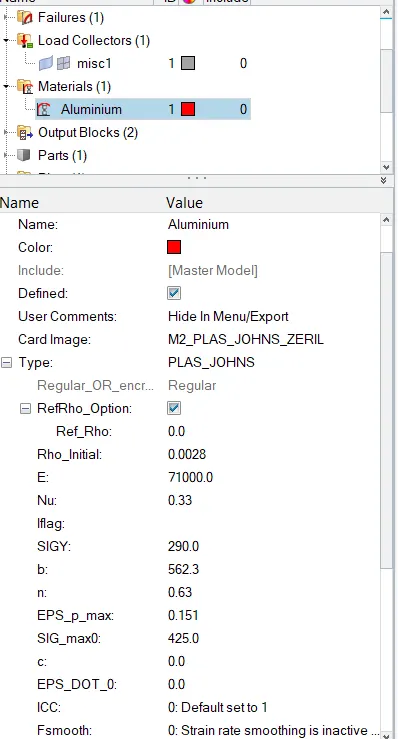
Material:
Now To Run the Simulation.
Goto Analysis - Radios - select the include connector- options : -nt 4 -Radioss.

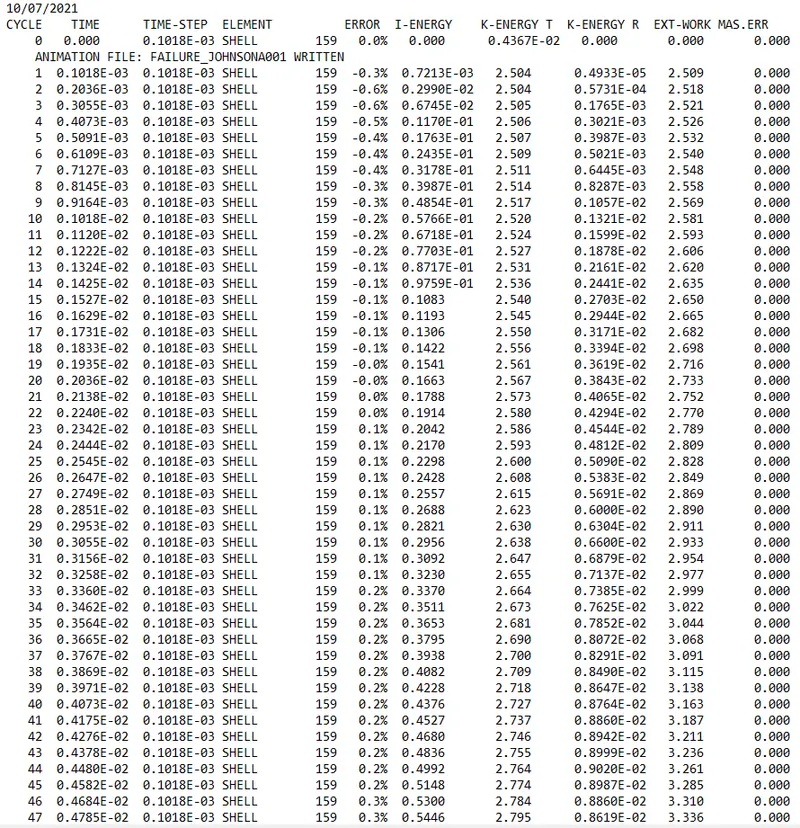
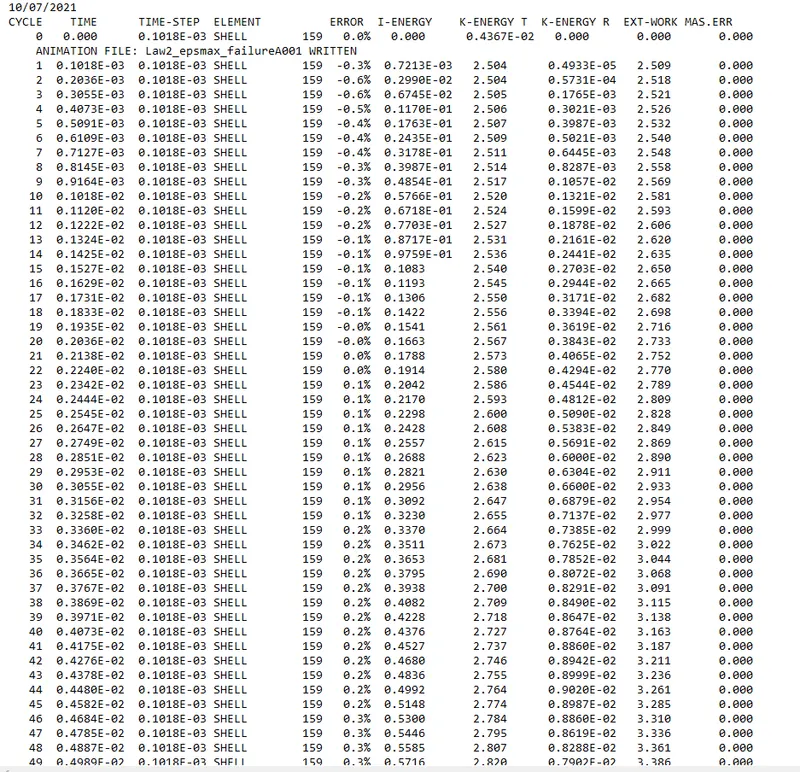
Open .out file and check - Total number of cycles, Energy error, mass error and simulation time.
The Final energy error is 0.3% which is within acceptable limit and there is no mass error.
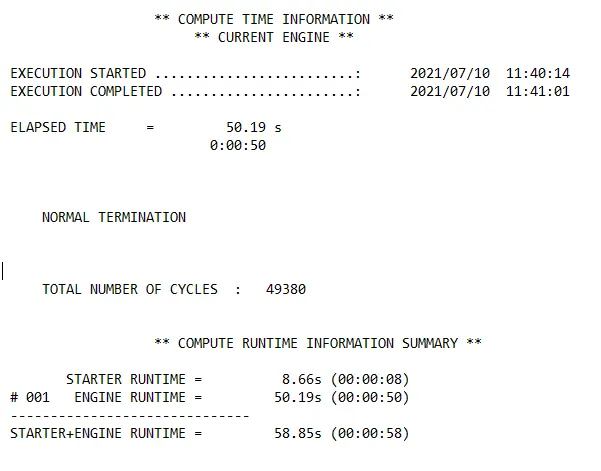
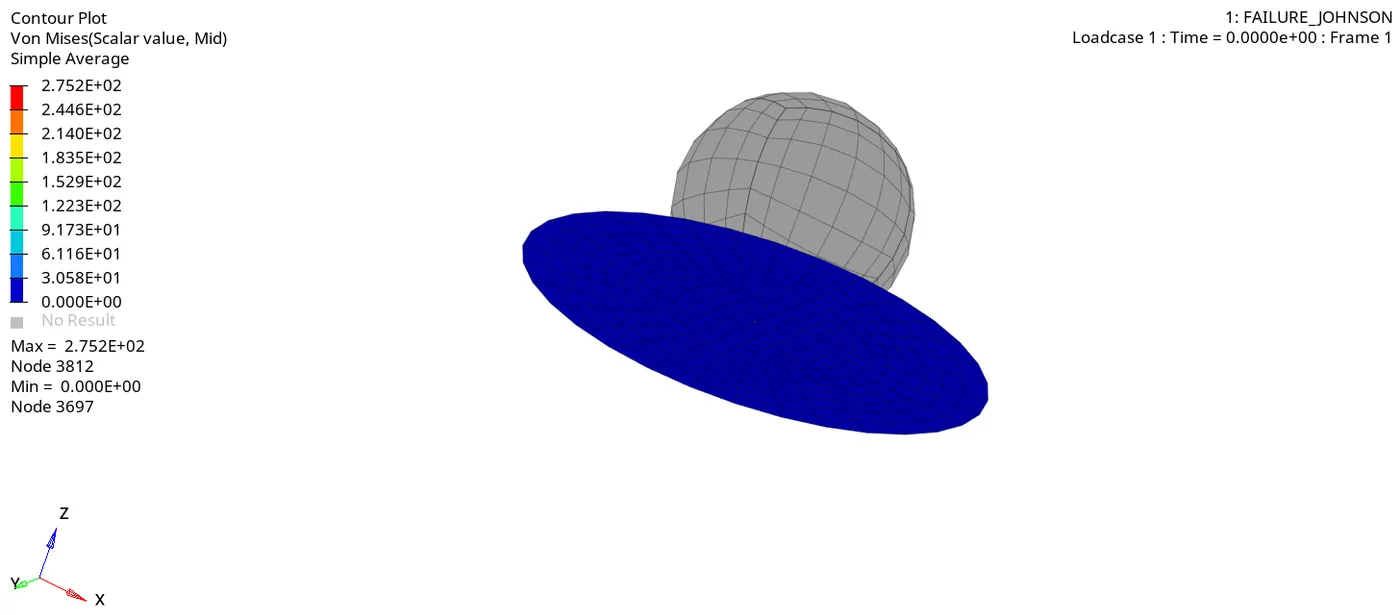
Goto Hyperview to see the analysis results visualization use h3d file from stored location and apply.
In this material card we have an option called EPS_Max which is plastic strain at failure. Failure happens when 1 integration point reaches to EPS_max.
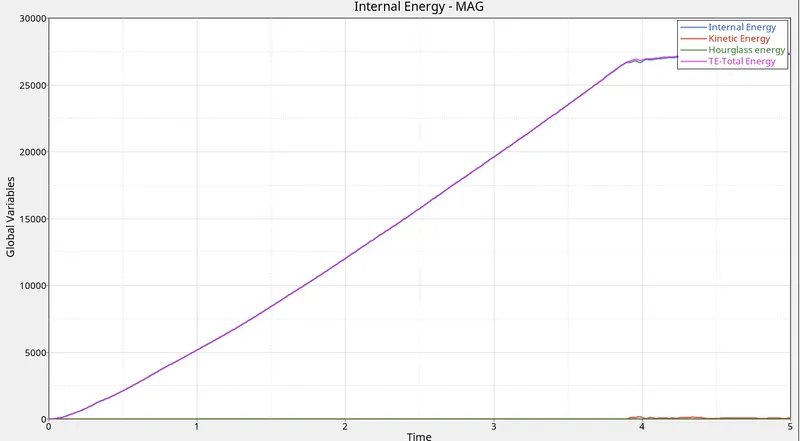
Now Plot the graph in Hypergraph 2D -Select T01 file.
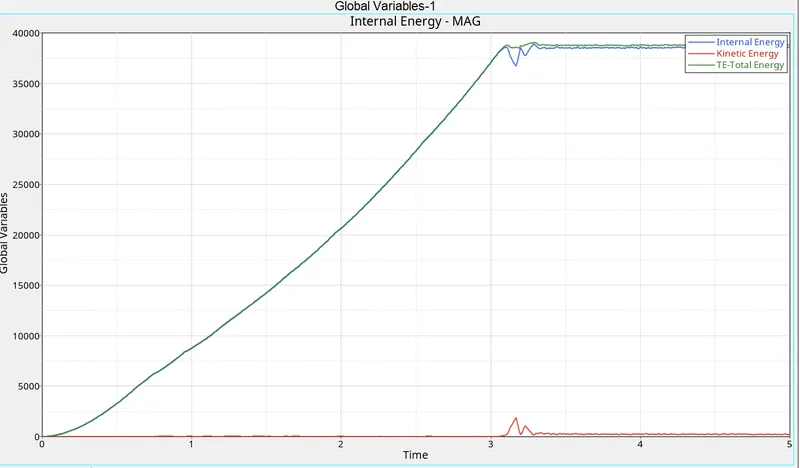
Goto Global variable and select the energies and Mag. and plot.
The Kinetic energy shows little variation at 4ms
Internal Energy and Total Energy is observed same.
Iteration:2
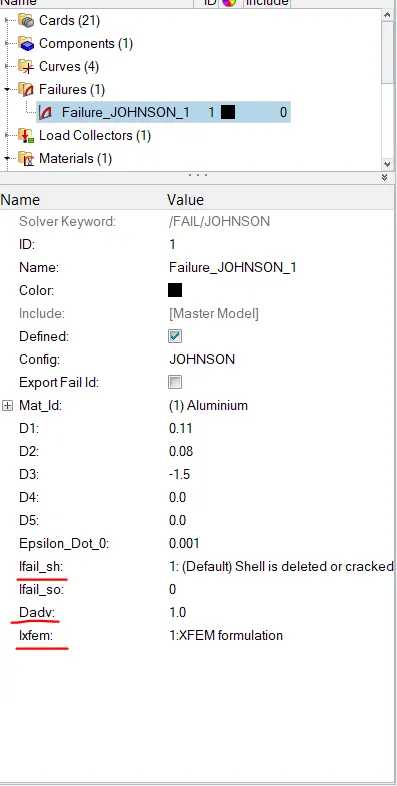
In Fail/Johnson/ change Ifail_sh -1 Default shell element deleted or crack, Dadv -1& Ixfem -1Ixfem formulation.
Now To Run the Simulation.
Goto Analysis - Radios - select the include connector- options : -nt 4 -Radioss.

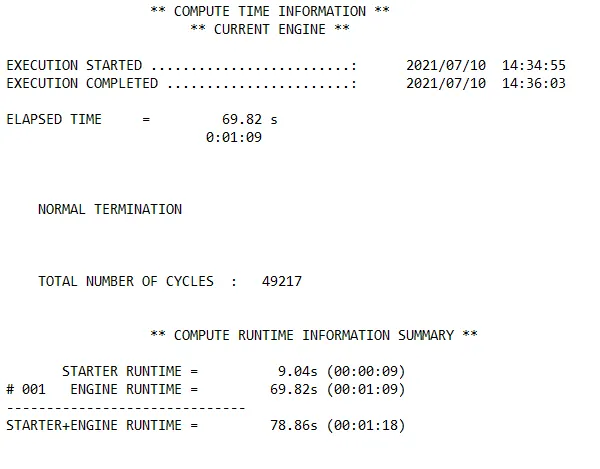
Open .out file and check - Total number of cycles, Energy error, mass error and simulation time.
No Change is observed in Energy error and mass error.
But increased in Elapsed time and decreased Number of cycle is observed.
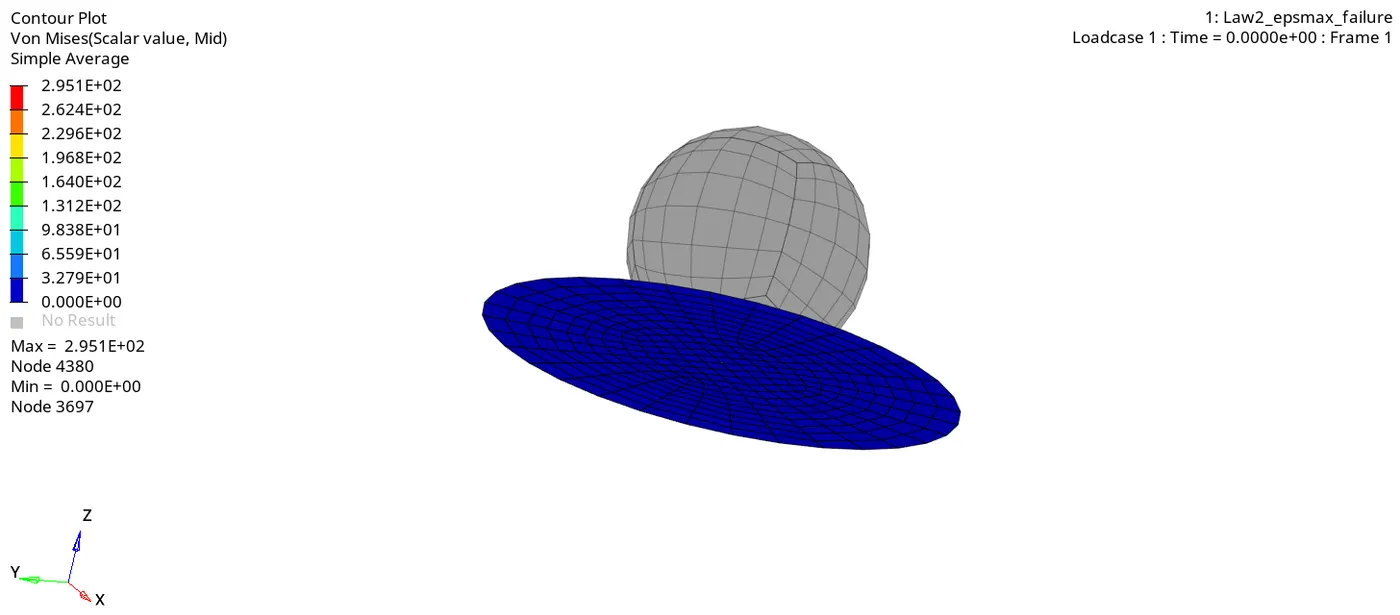
Goto Hyperview to see the analysis results visualization use h3d file from stored location and apply.
Here elements are getting cracked at initial stage.
The craking of element is due to Ixfem value set to 1 :Failure element cracked.
Ifail_sh :1 Shell elements are deleted or cracked when D = one intergation point or layer.
Dadv :1 Maximum accumulation damage valueD used for crack initiation.
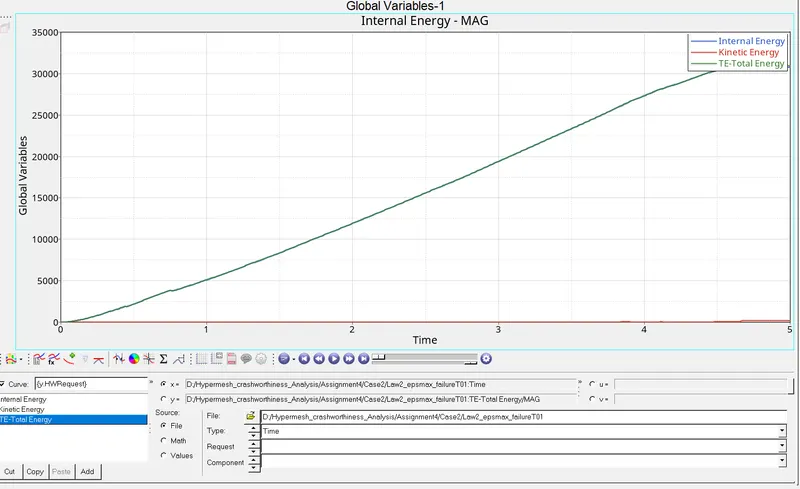
Kinetic Energy shows little variation at 5ms.
Internal energy and total energy remains same and increasing gradually.
Iteration :3
Delete failure_johnson_1 card by right click and run the simulation.
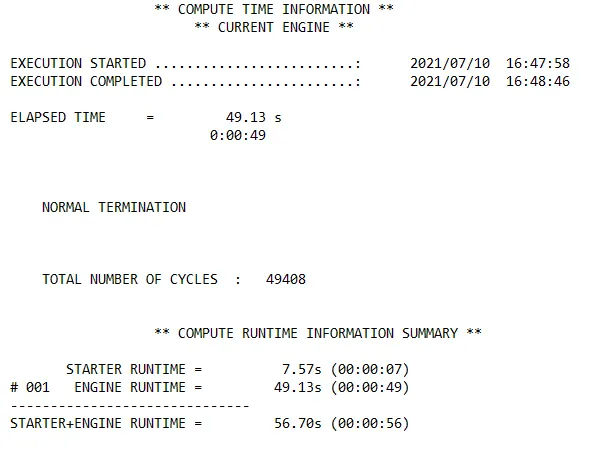
No change in energy error and mass error. where as elapsed time decreased and no of cycles are increased.
In hyperview Plot the contour by using h3d file.
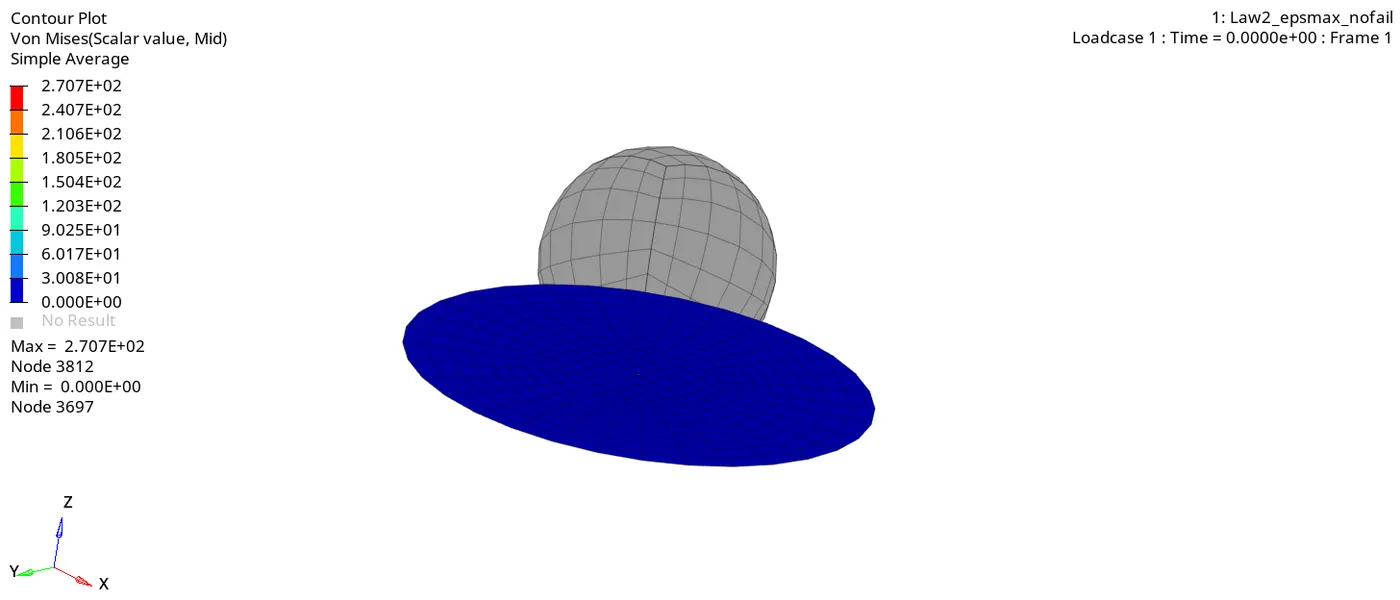
EPS max value is followed for the element failure. Failure of element happens when 1 integration point reaches to EPS max.
The shell element is deleted once reaches to maximum strain. therefor the formation of crack is even and then elements are being deleted.
Plot the hypergraph by loading T01 file.
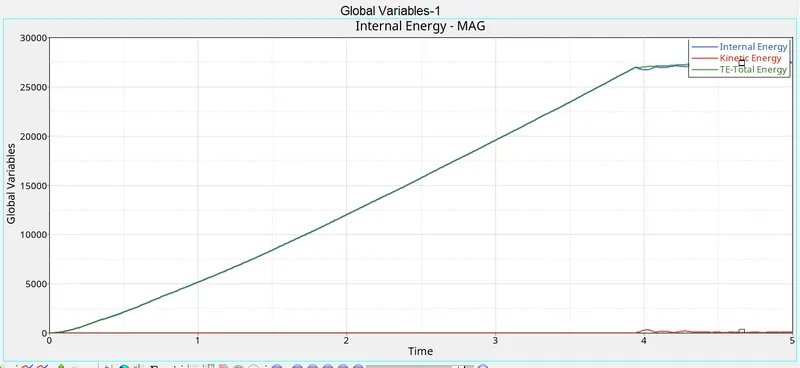
The internal Energy and total energy is gradually increasing and kinetic energy remais zero and slight variation at 5ms.
Iteration : 4
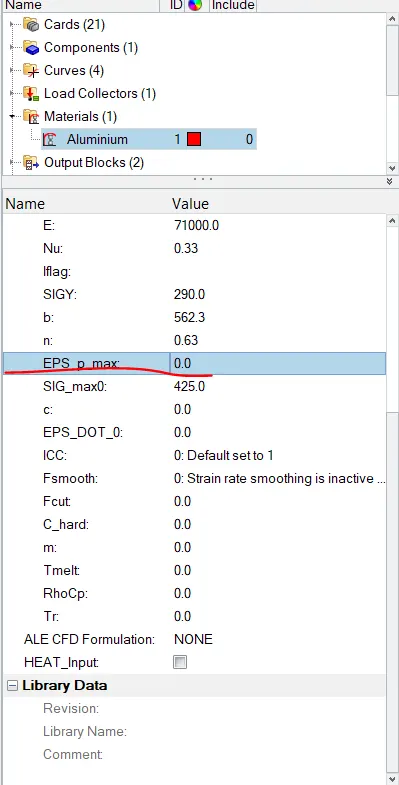
Changing the EPS_max value to 0 in the material card and run the simulation.
No change in energy error and mass error.
In hyperview Plot the contour by using h3d file.
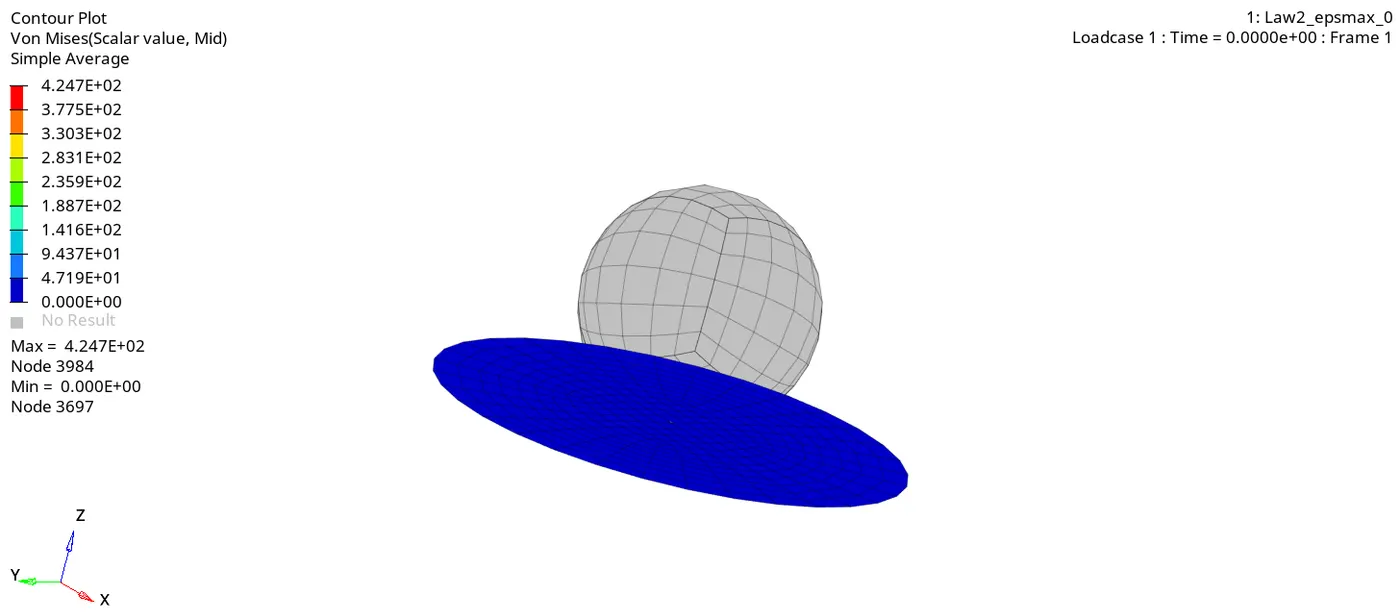
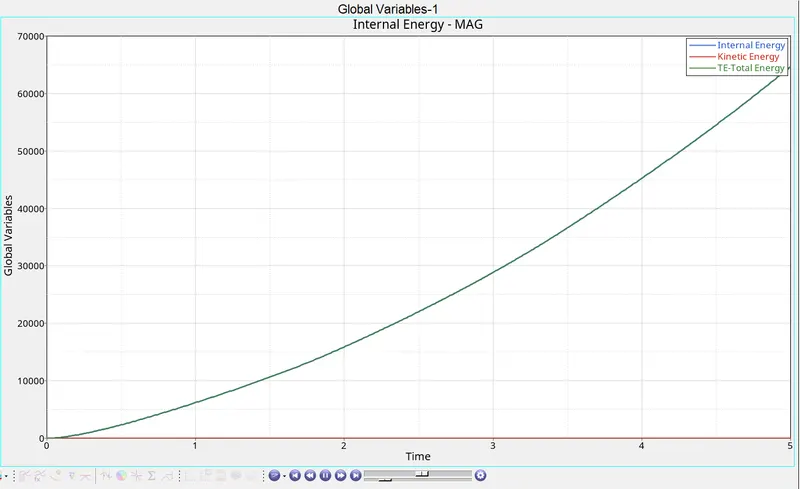
No variation in kinetic energy and remains zero. Internal energy and total energy is increased slightly at the end.
Iteration : 5
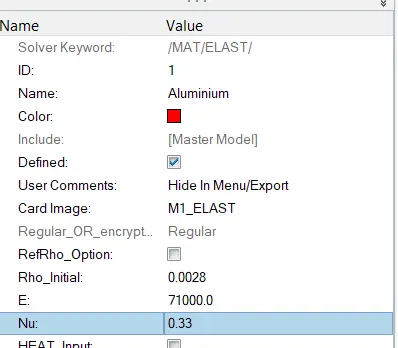
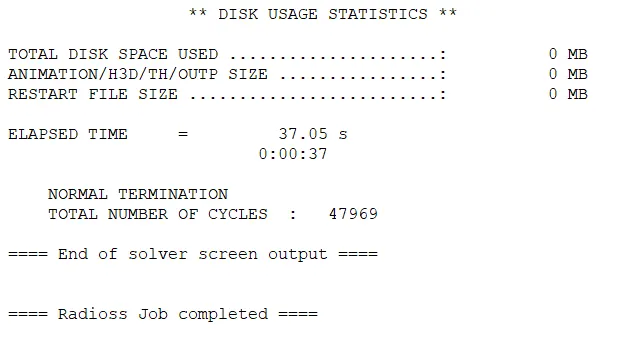
Plot the contour same process as above.
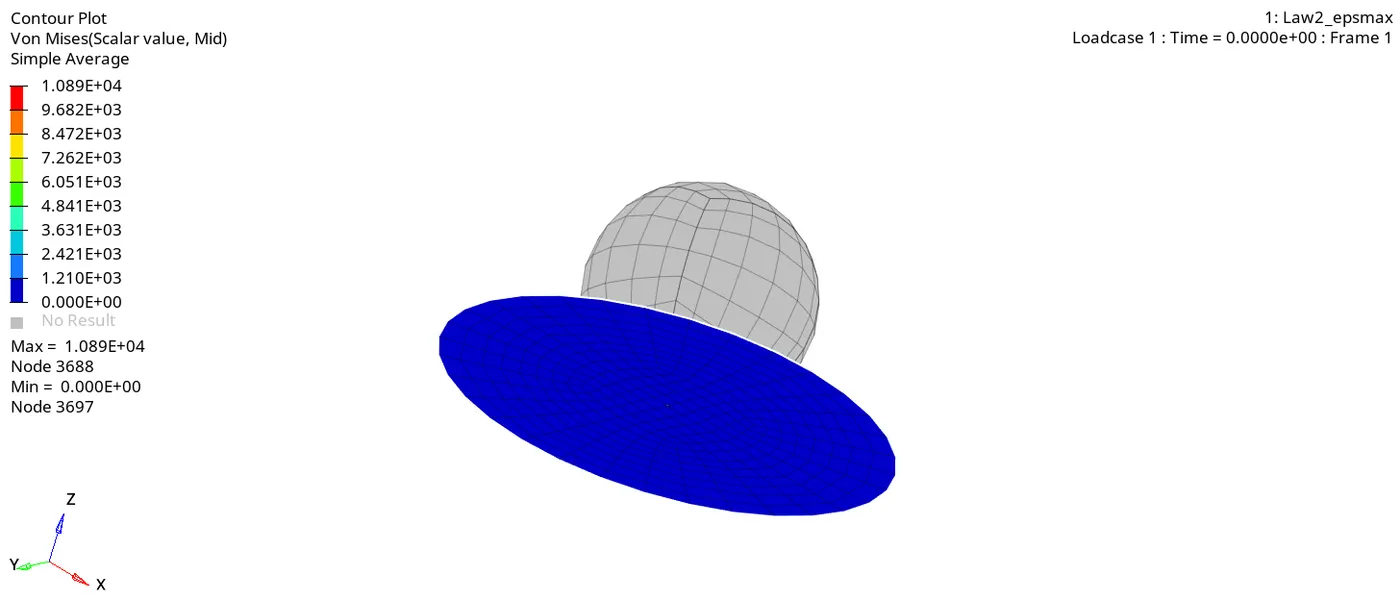
Plot the graph.
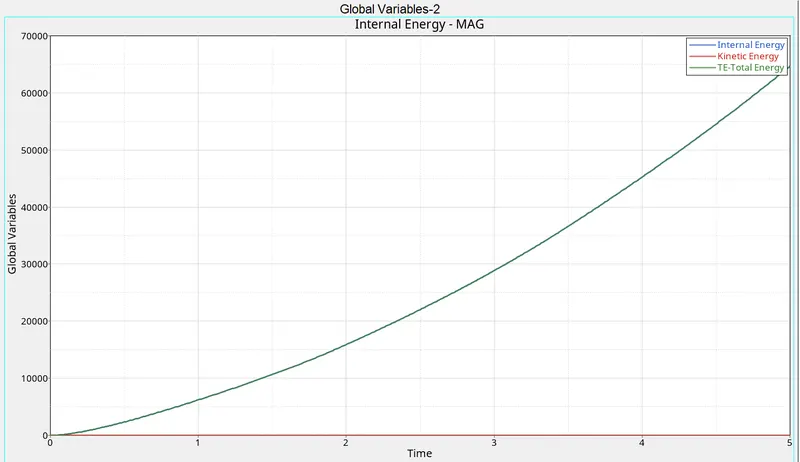
In this case the componenet is defined as elastic material therefore the componenet is in elastic zone and will not enter plastic deformation and there is no crack or element failure and maximum stress is developed at the contact between both componenets.
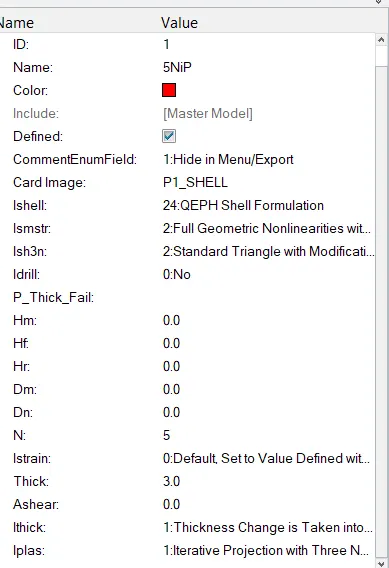
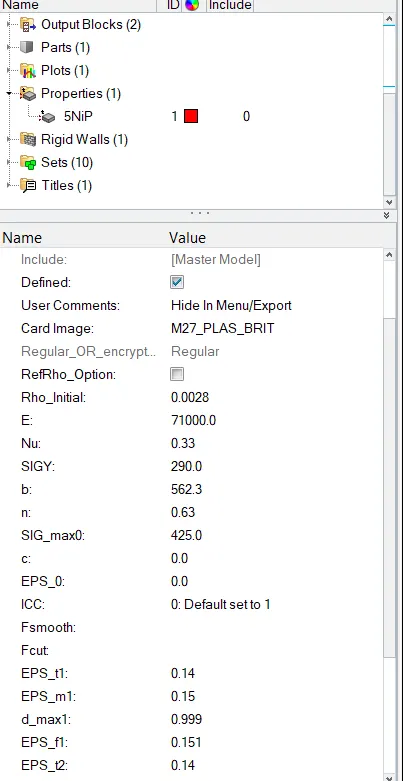

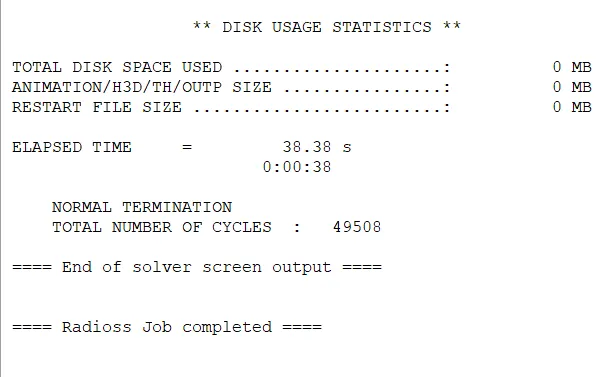
Run the simulation after updating the parameters
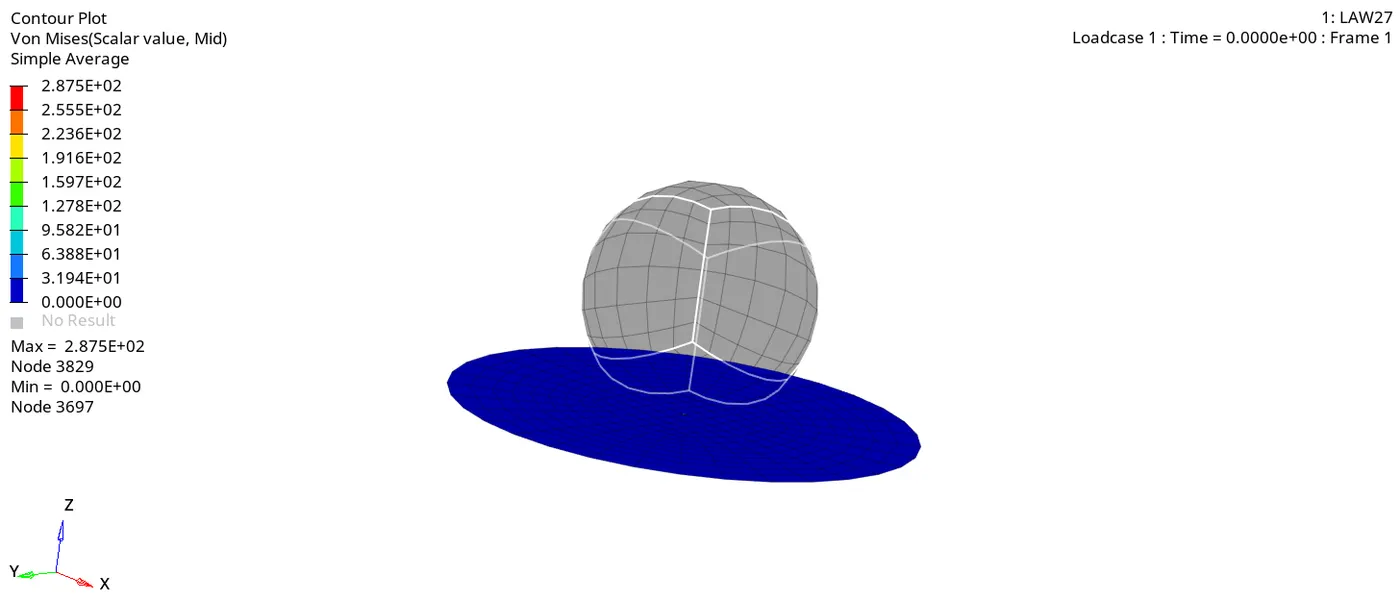
In this case Law27 i.e isotropic elstoplastic material law with orthotropic brittle failure model.Orthotropic material differs along three mutually orthogoinal axis.
Material damage and failure happens only in tension.
Material i sfailing like briottle material and some elements are being deleted.
This law allows the modelling of material damage and brittle failure in 2 principle direction which is control by EPS_f1 & EPS_f2.
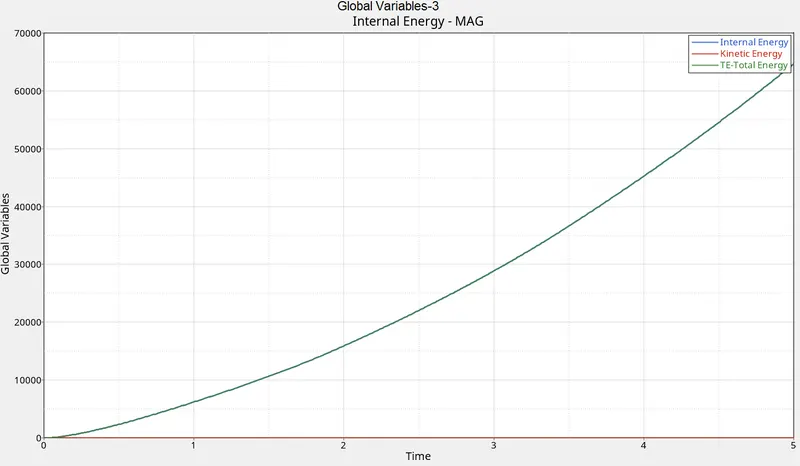
Plot the Graph.
The graph shows no variations as it fails like brittle material.
Iteration : 7
Import the file from solver deck - FAILURE_JOHNSON_0000.rad
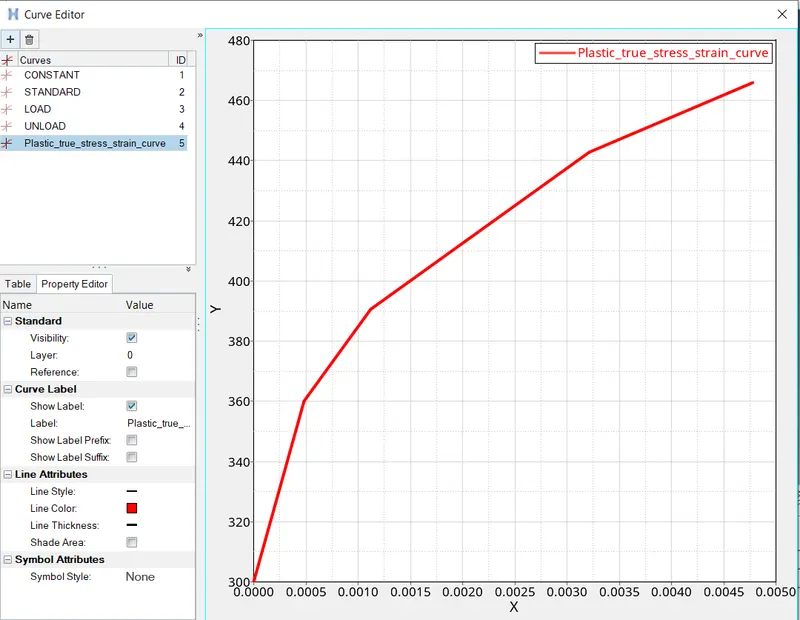
Goto curve -create new curve and enter the value mention in the video.
Below is the image showing the curve with X&Y values.
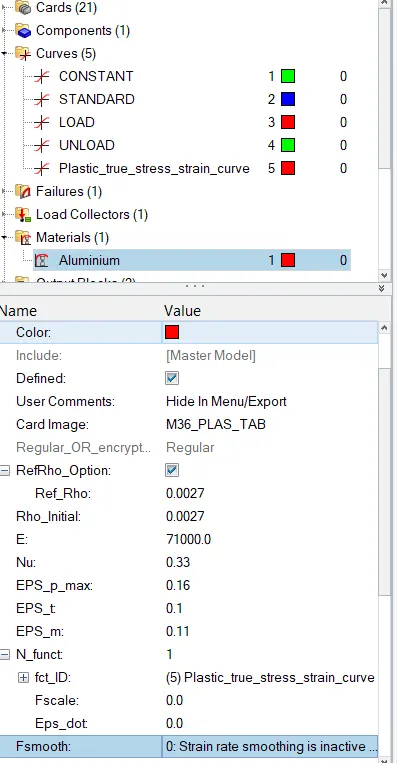
Then Goto Material and change properties as mentioned in the video.
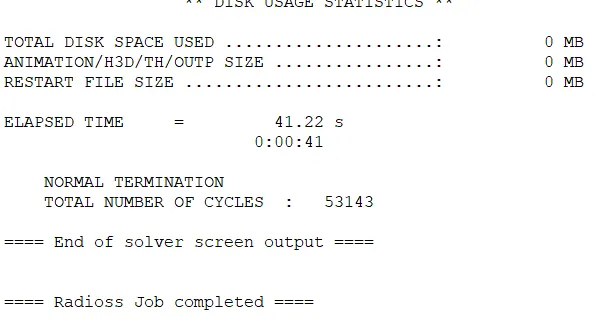
Now run the simulation
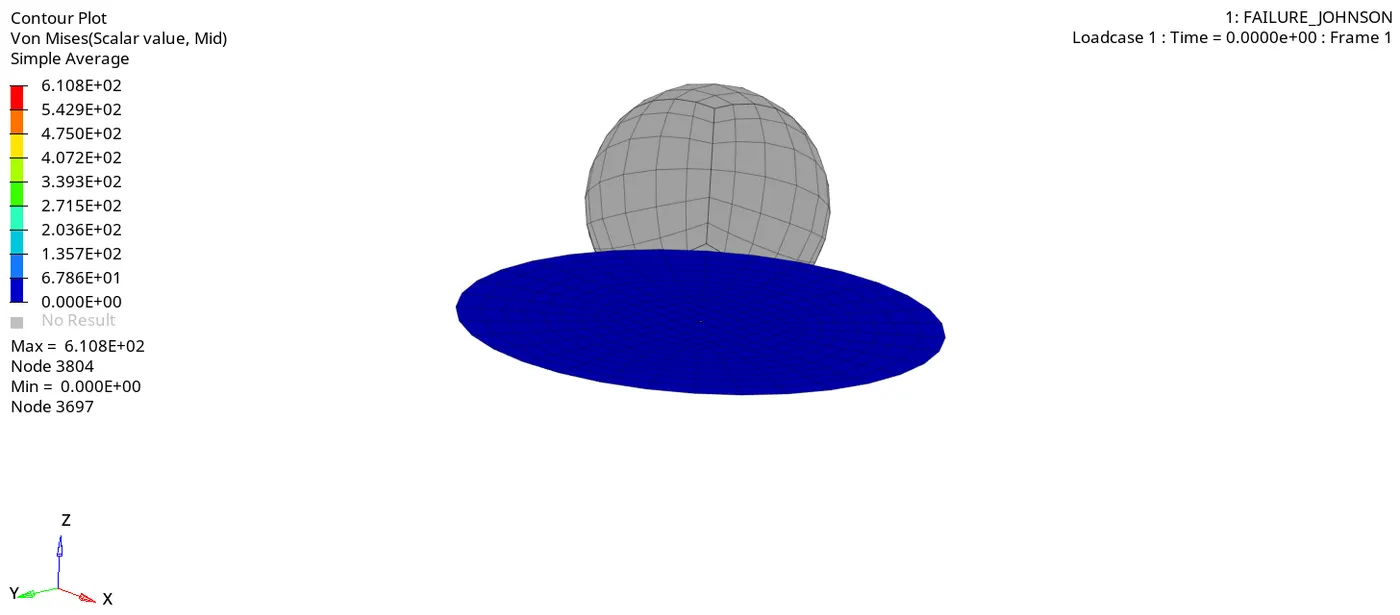
observation is that the element fail at the maximum stress value and some element are being deleted after reaching the EPS_f value.This is a real scenario as the true stress strain curve is defined and applied.
Comapring the results.
| Iterion | No of cycle | Energy error | Mass error | Simulation time |
| 1 | 49380 | 1.3% | 0% | 50.19 |
| 2 | 49217 | 5.3% | 0% | 69.82 |
| 3 | 49408 | 1.2% | 0% | 49.13 |
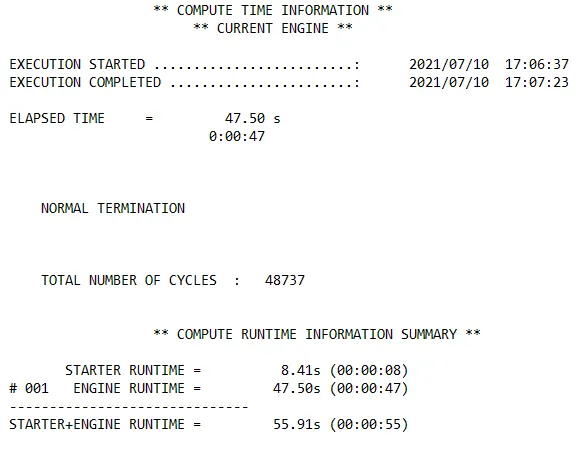
| 4 | 48737 | 3% | 0% | 47.5 |
| 5 | 47969 | 4% | 0% | 37.05 |
| 6 | 49508 | 1.1% | 0% | 38.38 |
| 7 | 53143 | 0.7% | 0% | 41.22 |