Week - 4
- Objective
- Implement control logic of a “washing machine” using Stateflow as per given sequence:
- If the power supply is available, the system gets activated
- If the Water supply is not available, stop the process & indicate through LED
- Soaking time should be 200s followed by Washing time of 100s.
- Then rinsing happens for next 20s & dryer runs for 50s
After all the processes have completed turn on the finished LED
Automatic washing machine is going to change between different state.
working Stages of washing machine.
1 Put your closhes in the washing machine and Detergent.
2 Switch on the machine and set the program.(selecting the type of wash and temperature)
3 water gets filled into the drum.
4 The thermostat senses the temperature of water and swtiches on the heating element to get it to appropriate temperature.
5 The inner drum starts rotating forward and backward to wash the clothes with soap water.
6 Machine drains out the dirty water and fresh water gets filled again to run the next cycle.
7 The Rinse cycle turns on to take out all the water and saop from the clothes.
8 When the clothes are rinsed properly the spinning cycle starts to dry out the clothes usually at very high rpm.
9 The pump removes any excess water and makes the clothes completely dry
10 Take out the clothes from machine.
Control Logic of a washing Machine
Open simulink state flow chart in simulink environment
Create a chart and enter the input values provided
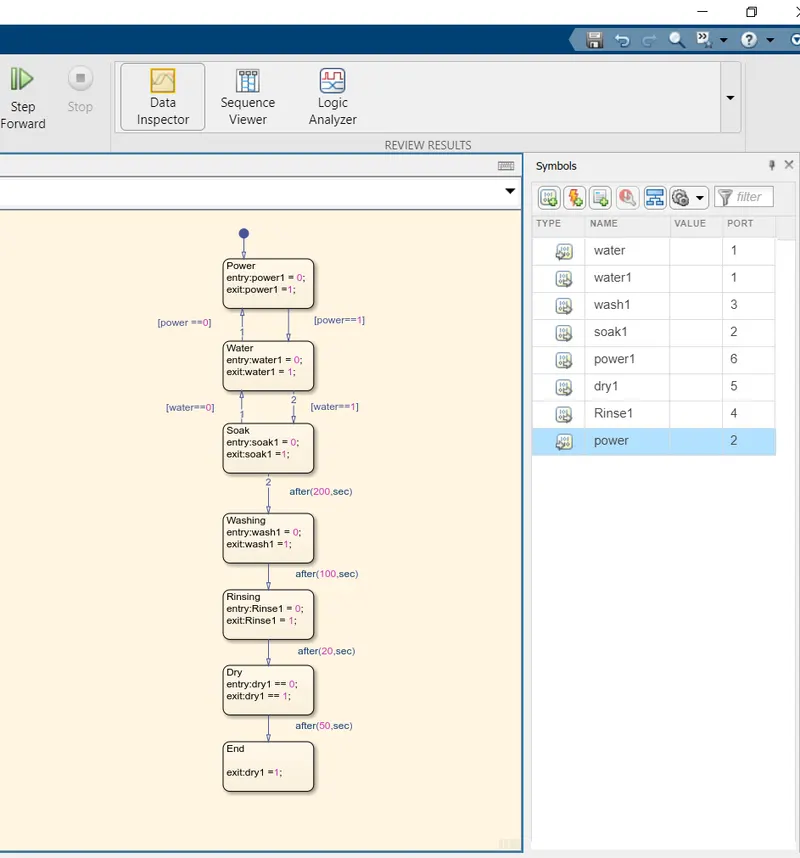
- If power supply is availble the system gets actived.
- If water supply is not available stop the process and indicate through LED.
- Washing time is 100s
- Soaking time is 200s
- Rinsing time is 20s
- Drying time is 50s
After assigning the input condition in the chart go to symbole Pane and assign the variable(input,output)
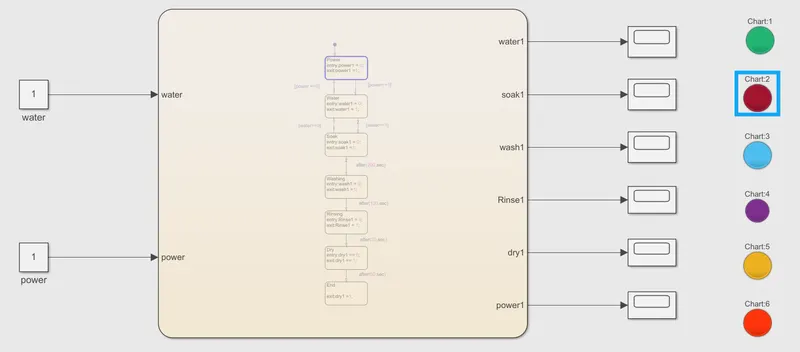
Give the input values for turning on or off the power supply and water supply.
if the value is 1 - Power and water supply will turn on
if the value is 0 - Power and water supply will turn off.
Display block and lamp indicator is used to display result.
- Create a chart and enter the given conditions for gear shifting.
Given Inputs
Speed Range(kmph) Gear
0 to 15 1
16 to 25 2
26 to 40 3
41 to 60 4
Above 61 5
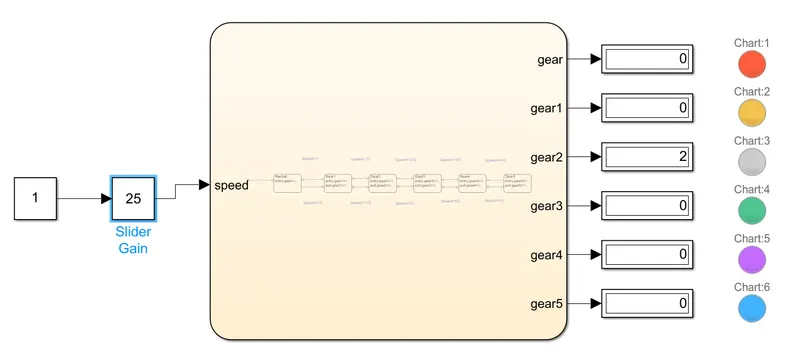
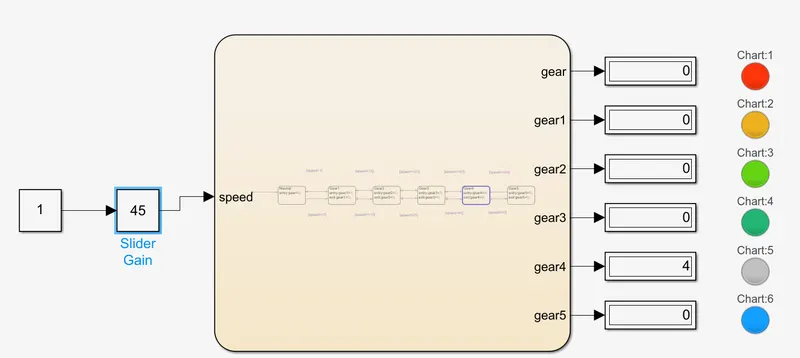
The model consist of Constant,slider gain, Chart and Display block. The chart block includes the values as per above input conditions.Slider gain block can be used as speed which can vary from 0 to 60. As the speed varies the gear shift automatically and result obtain in display block.
After entering the input conditions in the chart go to symbol Pane and assign the variables.(Input, output)
Create constant block
Connect the Slidergain to vary the speed while simulation is running
Enter value 1 or 0 for turning on and off.
Create Lamp block to show power is off or on.
Create Display block to display Gear Position.