Project 1 - Parsing NASA thermodynamic data
procedure :
File Parsing - NASA
First we will save the provided file in matlab directory.
then we will open the file using (fopen) command thermo = fopen('THERMO.dat','r')
Note 'r' - is used for reading the file & 'w' is for writing the file in matlab.
then command fgetl is used to access the lines in the file. this command can also be used to skip the unnessary lines and read the required lines by putting it into the loop.
The required temperature such as global and local temperature can be accessed through strsplit or strfind command.
Then the string data is converted to numbers using str2num command
Using the loop and above mentioned set of commands the coeeficients can be extracted.
the cp,h,s values for each species are found by using the polynomials for the range of temperature.
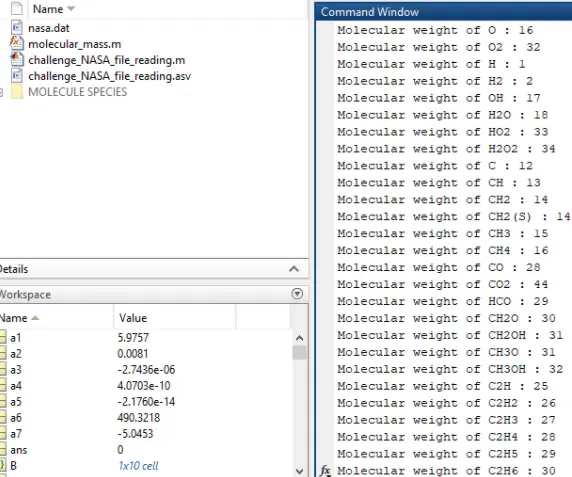
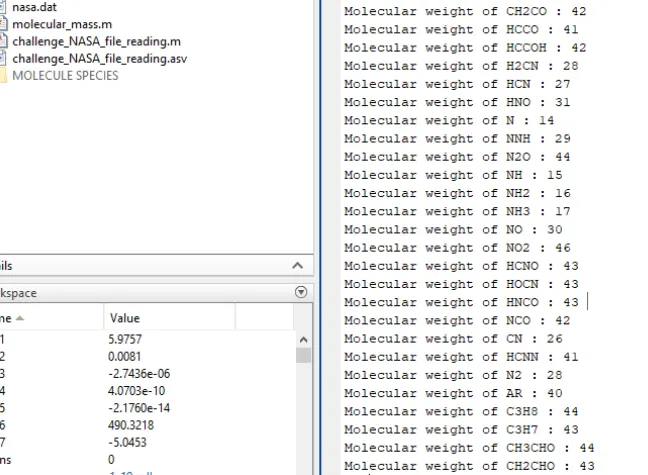
A function is created to calculate the molecular weight of the species.
Graphs are plotted and images are saved as jpg files using saveas command.
Directory is created using mkdir and command cd is used to change the directory
clear all
close all
clc
% Reading the NASA File

f1 = fopen('THERMO.dat','r');
fgetl(f1);
tline = fgetl(f1);
A = strsplit(tline,' ');
global_low_temp = str2num(A{2});
global_med_temp = str2num(A{3});
global_high_temp = str2num(A{4});

for i = 1:3;
    g = fgetl(f1);
end
% Reading the co-efficients

for k = 1:53
    species = fgetl(f1)
    species_names = species(1:6);

  low_temp = str2num(species(52-3:52+3));
  med_temp = str2num(species(62-4:62+3));
  high_temp = str2num(species(72-4:72+3))

  T1 = low_temp;
  T2 = med_temp;
  T3 = high_temp;

  % Reading the first coeeficient of species

  line_1 = fgetl(f1);
  a = strfind(line_1,'E');

  a1 = str2num(line_1(1:a(1)+3));
  a2 = str2num(line_1(a(1)+4:a(2)+3));
  a3 = str2num(line_1(a(2)+4:a(3)+3));
  a4 = str2num(line_1(a(3)+4:a(4)+3));
  a5 = str2num(line_1(a(4)+4:a(5)+3));

    % Reading the second coeeficient of species

    line_2 = fgetl(f1);
    a_1 = strfind(line_2,'E');

    a6 = str2num(line_2(1:a_1(1)+3));
    a7 = str2num(line_2(a_1(1)+4:a_1(2)+3));
    a8 = str2num(line_2(a_1(2)+4:a_1(3)+3));
    a9 = str2num(line_2(a_1(3)+4:a_1(4)+3));
    a10 = str2num(line_2(a_1(4)+4:a_1(5)+3));

    % Reading the third coeeficient of species

    line_3 = fgetl(f1)
    a_2 = strfind(line_3,'E');

    a11 = str2num(line_3(1:a_2(1)+3));
    a12 = str2num(line_3(a_2(1)+4:a_2(2)+3));
    a13 = str2num(line_3(a_2(2)+4:a_2(3)+3));
    a14 = str2num(line_3(a_2(3)+4:a_2(4)+3));

    % Creating folder with species names
    mkdir(['D:\matlab_tutorial\',species_names])

    T = linspace(T1,T3,100);
    R = 8.314


    [cp,h,S] = thermo_func(R,T,T1,T2,T3,a1,a2,a3,a4,a5,a6,a7,a8,a9,a10,a11,a12,a13,a14);

    figure(1);
    plot(T,cp,'linewidth',2,'color','b');
    title (species_name);
    xlabel('Temperature');
    ylabel('specific_heat');

    figure(2);
    plot(T,H,'linewidth',2,'color','b');
    title (species_name);
    xlabel('Temperature');
    ylabel('Enthalpy');

    figure(3);
    plot(T,S,'linewidth',2,'color','b');
    title (species_name);
    xlabel('Temperature');
    ylabel('Entropy');


    % Changing the directory

    saving = (['D:\matlab_tutorial\',species_name]);
    cd(directory)

    % Saving the plots
    saveas(1,'Specific heat','jpg')
    saveas(2,'Enthalpy','jpg')
    saveas(3,'Entropy','jpg')

    cd('D:file parsing')
    fclose(f1);
end

    % Function for calculating the molecular mass

    function [M] = molecular_mass(species_name);

    fprintf('Molecular weight of ');
    fprintf(molecular_name);
    fprintf('  :  ');

 atoms = ['H','C','O','N','AR'];

 % R is for argon molecule and not use() these small brackets

 atom_weight = [ 1 12 14 16 40]
 M = 0
 for i = 1:length(atoms)

     if strcmpi(species_name(i),atoms(j));
         for j = 1:length(atoms)

             M = M+atom_weight(j);
             position = j;
         end
     end
     n = str2num(species_name(i))

     % this all process is doing for a number multiplier in molecule name
     % so the value of n become same a number value.

     if n>1
         M = M+atom_weight(position)*(n-1);

         % here we are taking(n-1) to multi[ply instead of n because we are
         % inputting second time coding.
     end
 end
 fprintf('%d',M);

 % d is for digit
 disp(' ')
    end
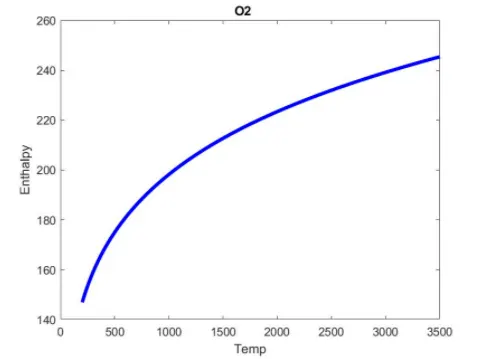
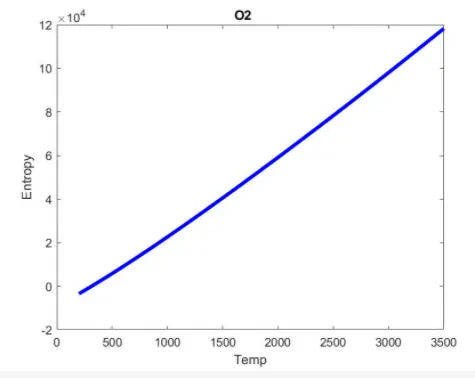
Plots of O2
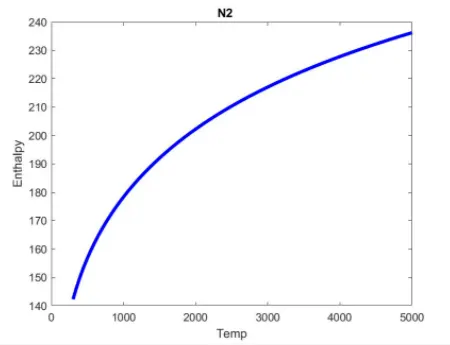
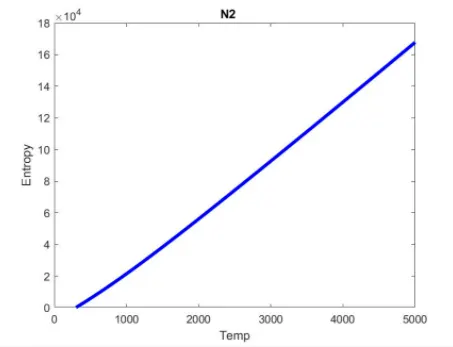
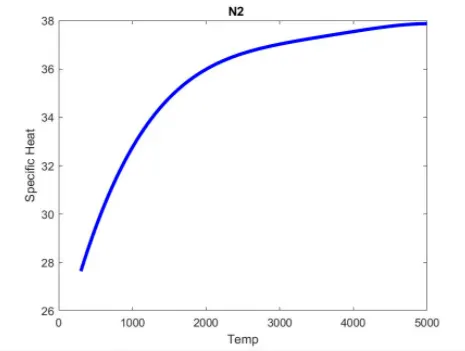
Plots of N2
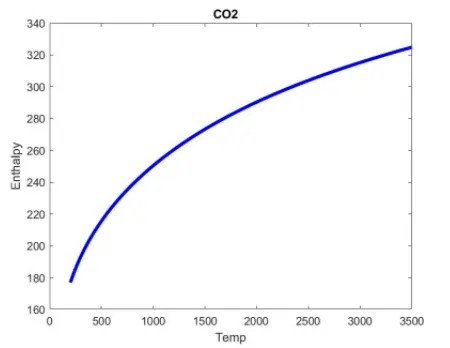
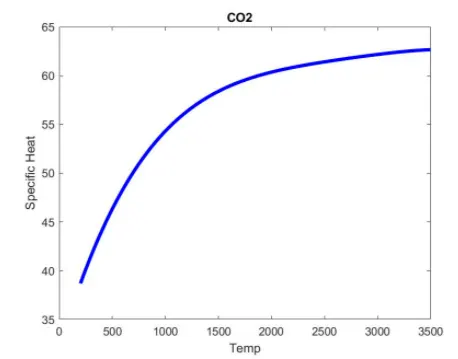
Plots of CO2
Molecular weight calculation