Assignment 4-RADIOSS Material Laws Challenge
ASSIGNMENT 4: RADIOSS MATERIAL LAW CHALLENGE
AIM: To compare the 6 cases given in the question. And also conclude case by case why the failure occurred. Also create table based on;
- Total number of cycles, Energy error, mass error and simulation time.
- Notice the animation of all 5 and describe the animations in brief on the
basis of whether the elements are being deleted or cracked. - Plot energies and notice any difference.
- Based on all the results, which case would represent the on-field
PROCEDURE:
CASE 1
Import the given FAILURE_JOHNSON_0000.rad file.
Running the simulation as Law2_eps_max.
The M2_plas_johns_zeril represents an isotropic elasto-plastic material using the Johnson-Cook material model.
This model expresses material stress as a function of strain, strain rate and temperature. A built-in failure criterion based on the maximum plastic strain is available.
Here Eps_p_max is defined as 0.151. Eps_p_max is defined when the failure criteria are based on the maximum prinicipal strain. When the principal strain value reaches the value of Eps_f_max the elements are deleted.
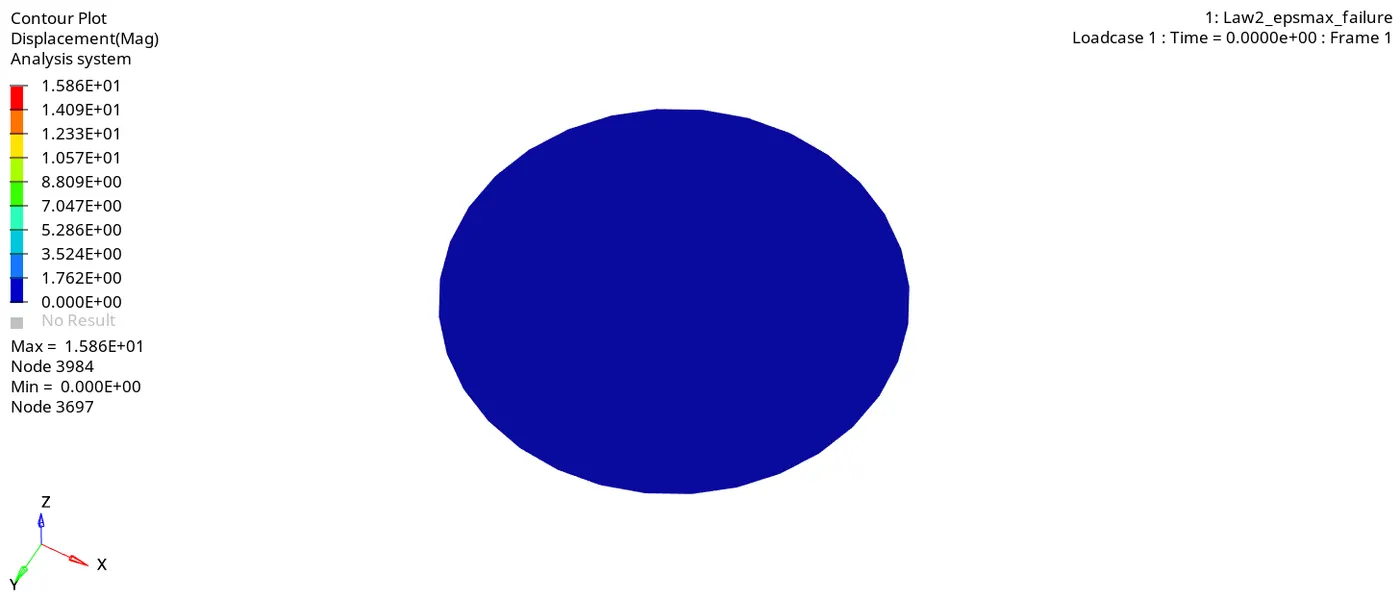
The gif shown below shows the von mises stress and how it acts on the model;
The graphs for internal energy, kinetic energy,are shown below
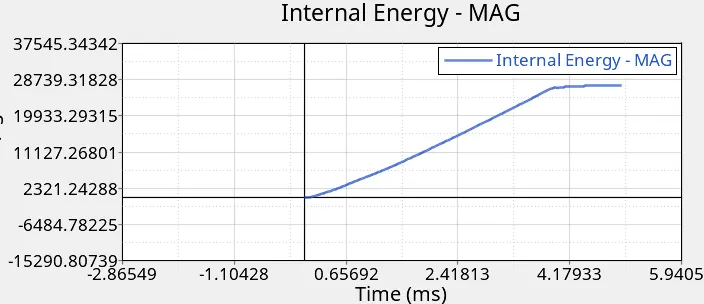
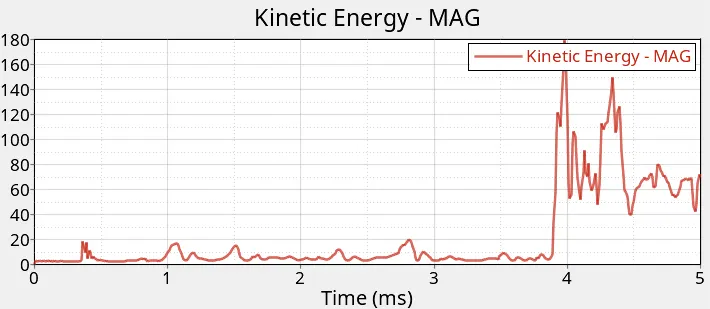
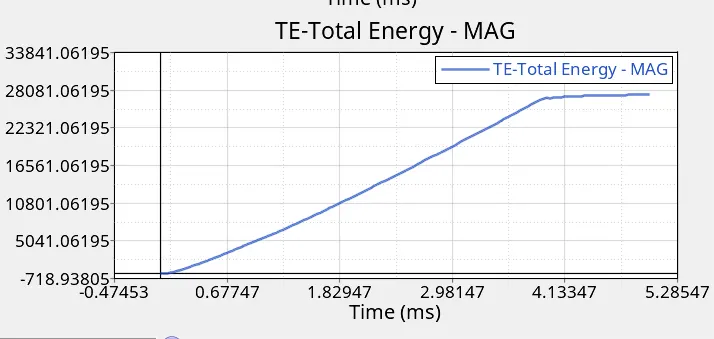
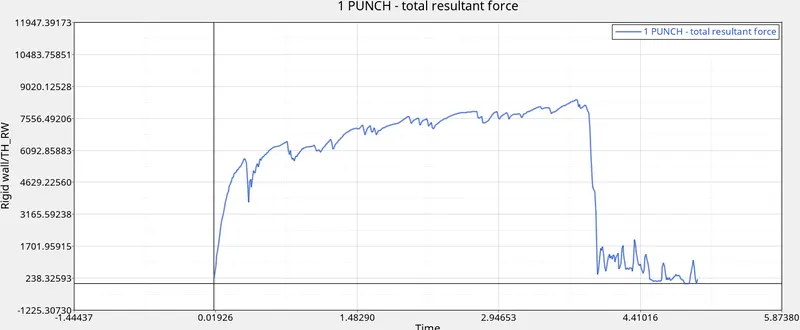
By observing the graph, we see that the internal energy and total energy graph look similar as the Kinetic energy is very small compared to internal energy. Both kinetic energy and internal energy go into fluctuation after 4 ms and then the elements get deleted. We observe in resultant force graph that the elements get deleted periodically until the 4ms mark and then there is sudden drop in force as the elements resisting the force on wall are deleted.
CASE 2:
In this case we need to change the parameters in the failure Johnson card such as change Ifail_sh =1,Dadv =1 and Ixfem changes to 1.
Running the analysis and saving it as Law2_epsmax-crack.
We get von-mises stress as show below.
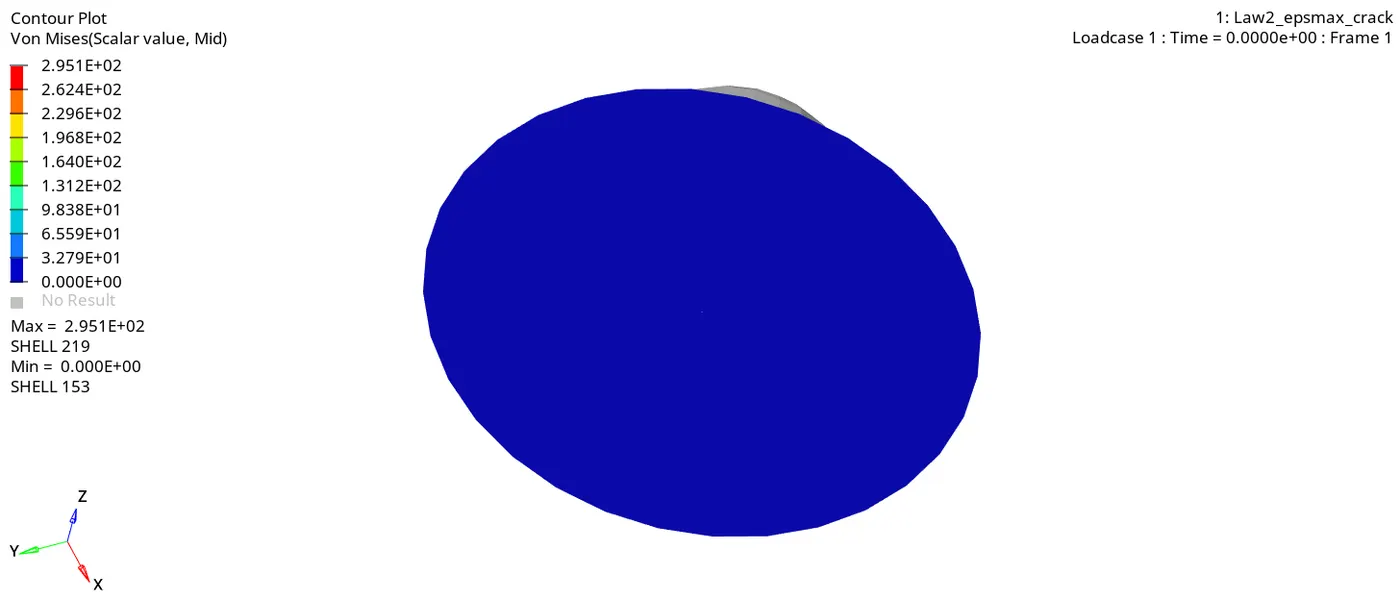
Here we can see cracking of elements. Ixfem=1 is used to see the cracking of elements when failure strain limit is reached. Dadv=1 is used to see the advancement in crack formation.
The graphs for kinetic energy, internal energy, total energy and rigid wall forces is given below
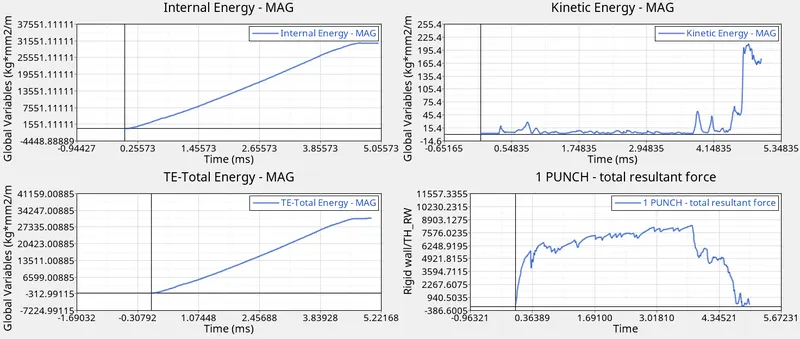
We can see that the element deletion occurs prominently after 4.2ms mark. This is delay occurs due to the formation of crack which was absent in the case 1.
CASE 3
In this case we delete FAILURE JOHNSON card.
Running the analysis as Law2_epsmax_nofail_0000.rad.
We can see the von-mises stress as shown below.
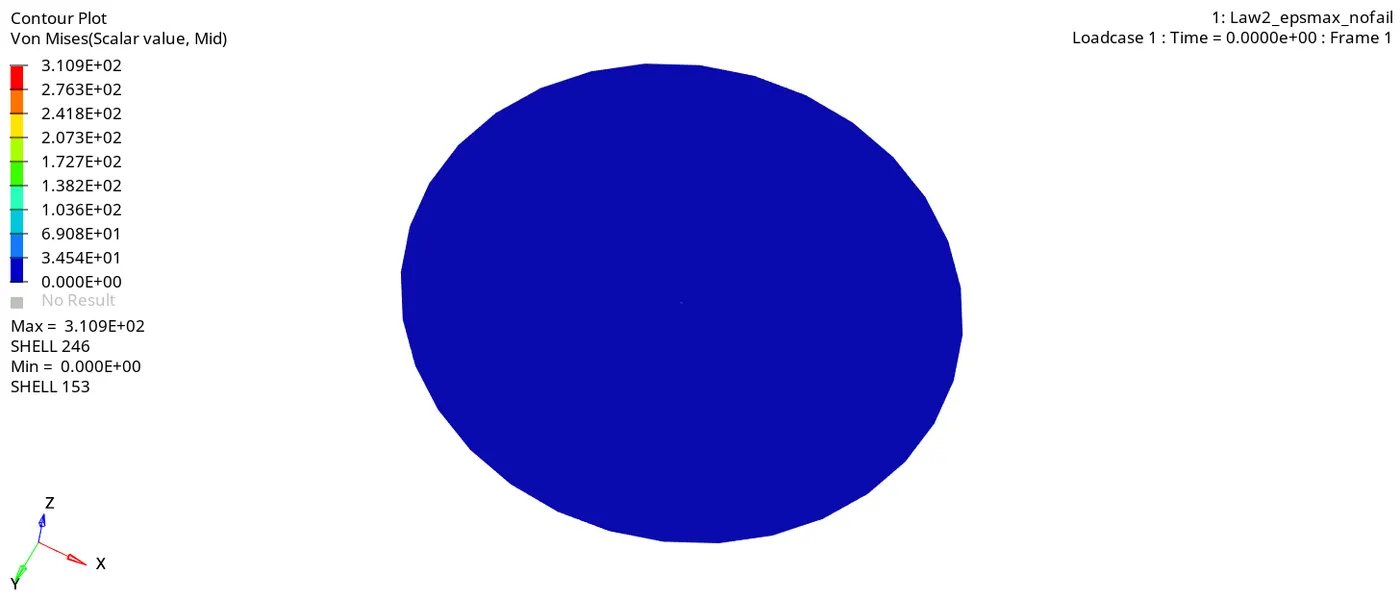
We observe that due to absence of Failure Johnson card we see that the elements get deleted directly, same as in the case 1. Here as soon as the strain is hits the eps_p_max value deletion of elements increases.
Below are the graphs representing Kinetic energy, internal energy, total energy and rigid wall forces.
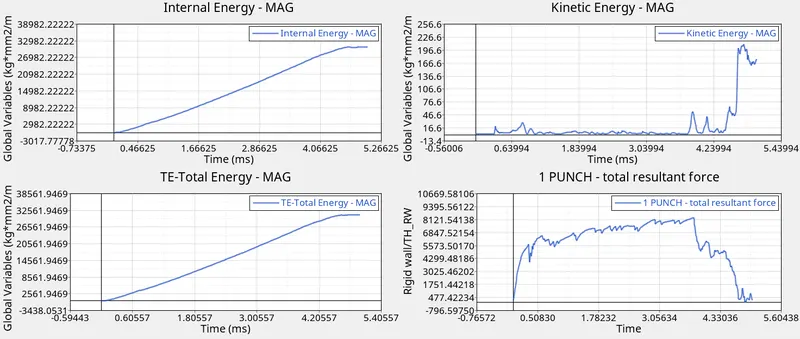
We observe that there is a slight increase in internal energy as compared to the case 1. The total energy is almost same as internal energy and the kinetic energy is negligible due to the clamping.
CASE 4
In this case we change the value of Eps_p_max=0.
Running the analysis and saving it as Law2_0000.rad.
We get the von-mises stresses as shown below;
We obser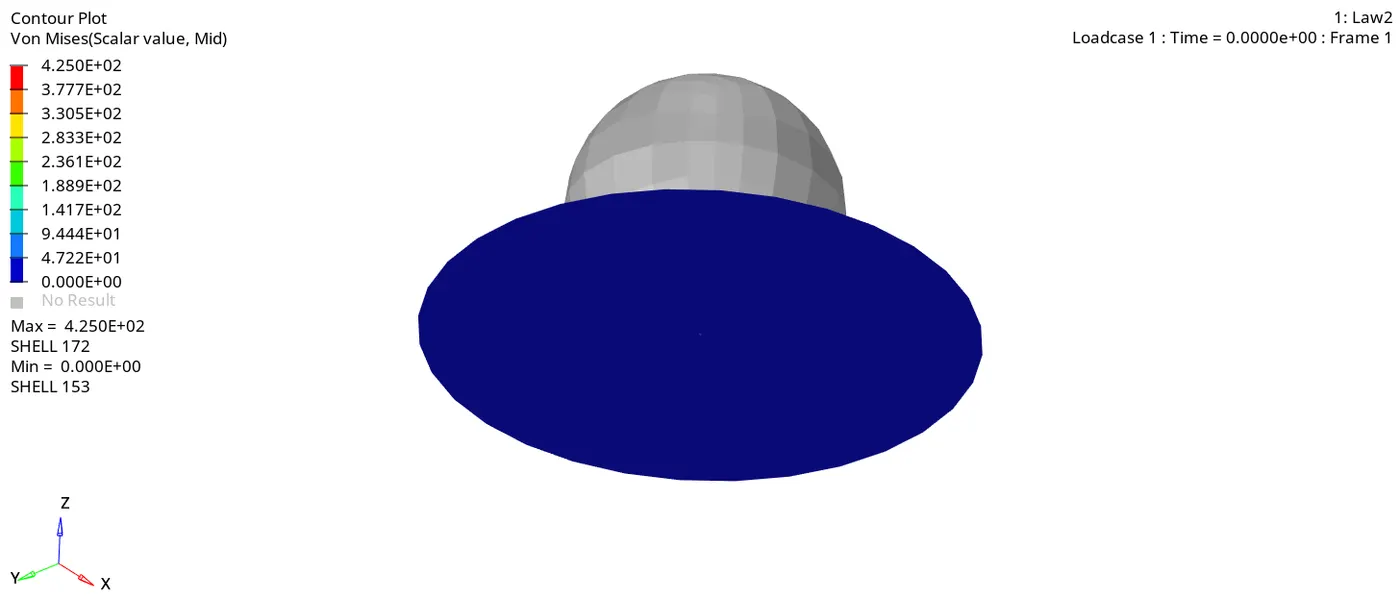 ve that there is no deletion of elements. This occurred due to Eps_max=0, this means there is no failure stress, so there is no failure in elements which causes element deletion. The stress induced on the elements is quite high then the other cases.
The graphs for KE, IE, TE and rigid wall forces are shown below
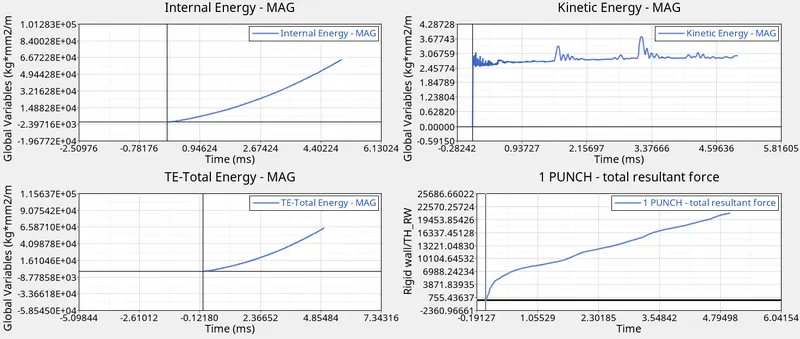
We observe that there is no deletion of elements as no failure of elements occurs as no elements will every cross eps_max which isn’t defined.
CASE 5
In this case we change the material model to law 1 and keeping the same parameters of density, E and Nu in the material card.
Running the analysis and saving it as Law1_0000.rad.
The von-mises stress are shown below;
W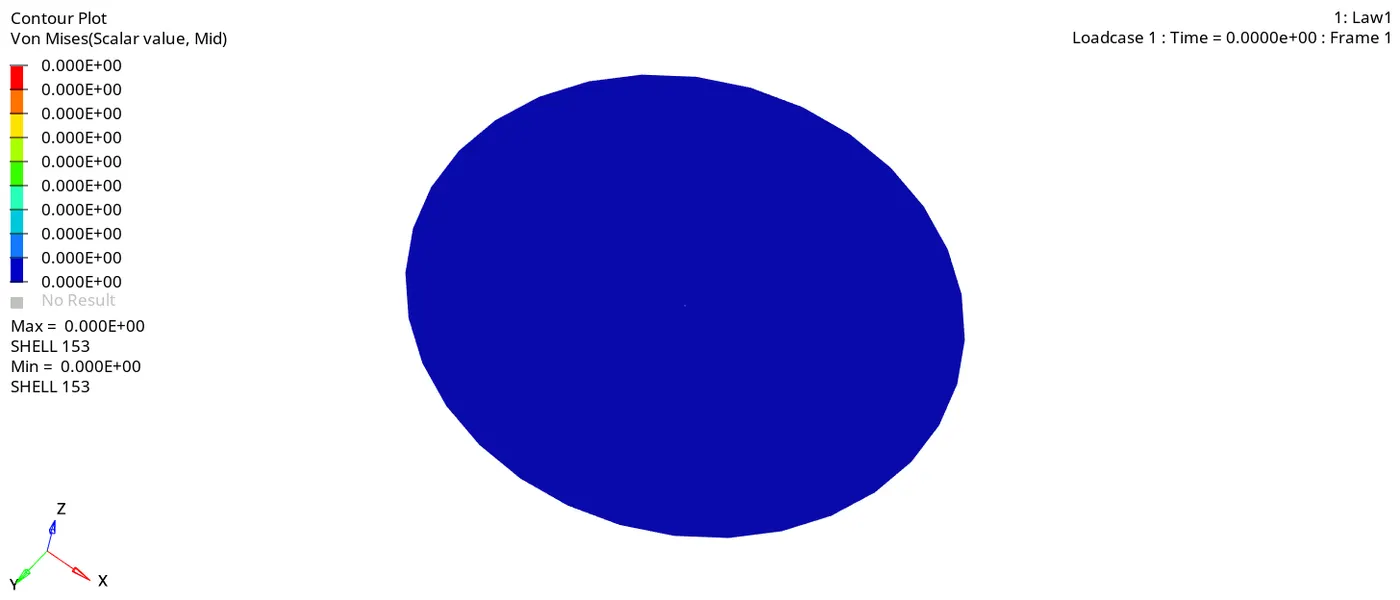 e observe that the max stress here is around 11020 which is much larger than the previous condition. This is due to the use of elastic material instead of elasto-plastic material. The deletion of material doesn’t occur for eleastic material but it produces strain as per the Young’s modulus. There is no plastic deformation in this case as the material is elastic.
Below are the graphs for kinetic energy, internal energy, total energy and rigid wall forces;
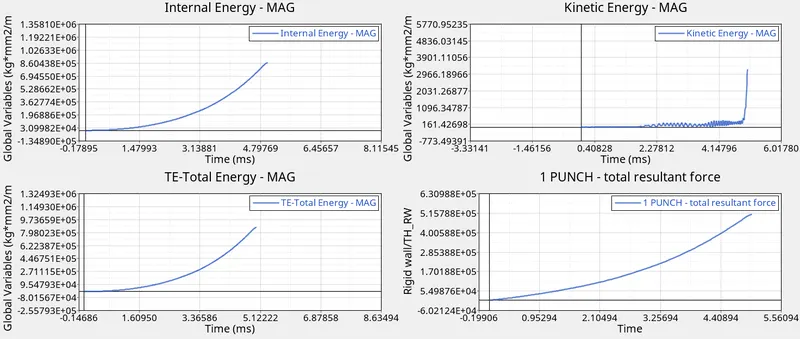
Here the internal energy is very large due to very large stress and strain value which is produced on elements without failure.
CASE 6
In this case a new material law Plast_BRIT is used.
This material law is used for elasto-plastic materials which can be of brittle metal or glass type.
So importing the LAW27_0000.rad file and running the simulation.
The von-mises stress contour is shown below;
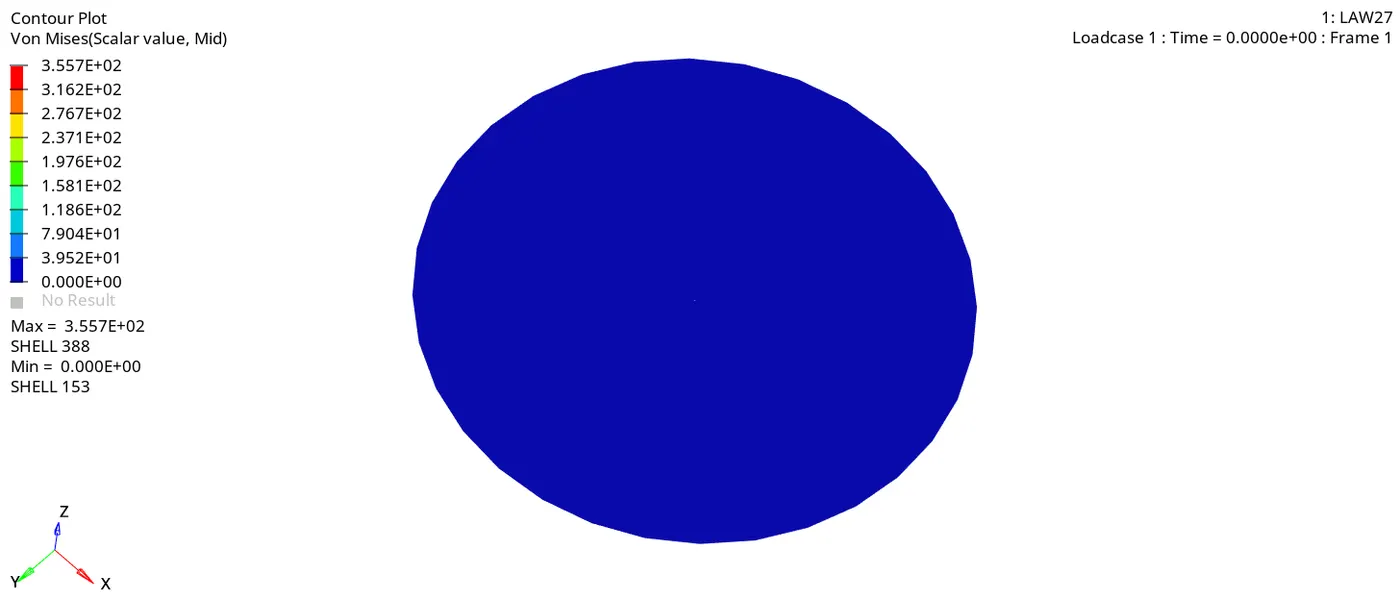
We observe that the brittle failure occurs when the elements are subjected to corresponding failure strain value. The element deletion occurs as soon as the load comes in contact with load bearing element.
Below are the graphs for kinetic energy, internal energy, total energy and rigid wall forces;
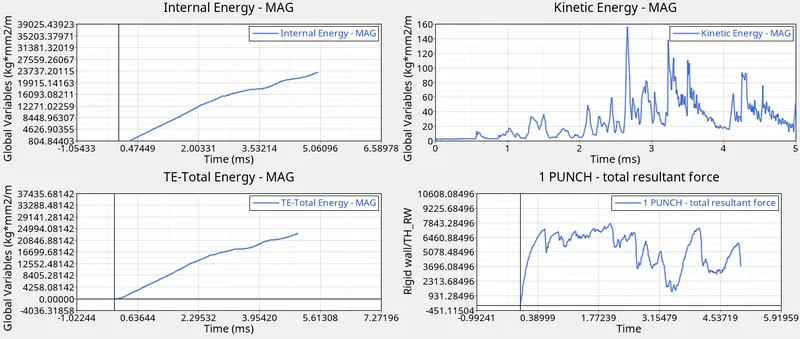
Due to dmax value being very close to 1 we see that the element fails we quickly. So this is as fluctuations seen in the kinetic energy and rigid wall forces graph.
CASE 7
In this case we use material law Plast_TAB.
This material law is used for elasto plastic materials which are metals.
The material and test curve was defined as shown below;
Running the simulation and saving the file as LAW36_0000.rad
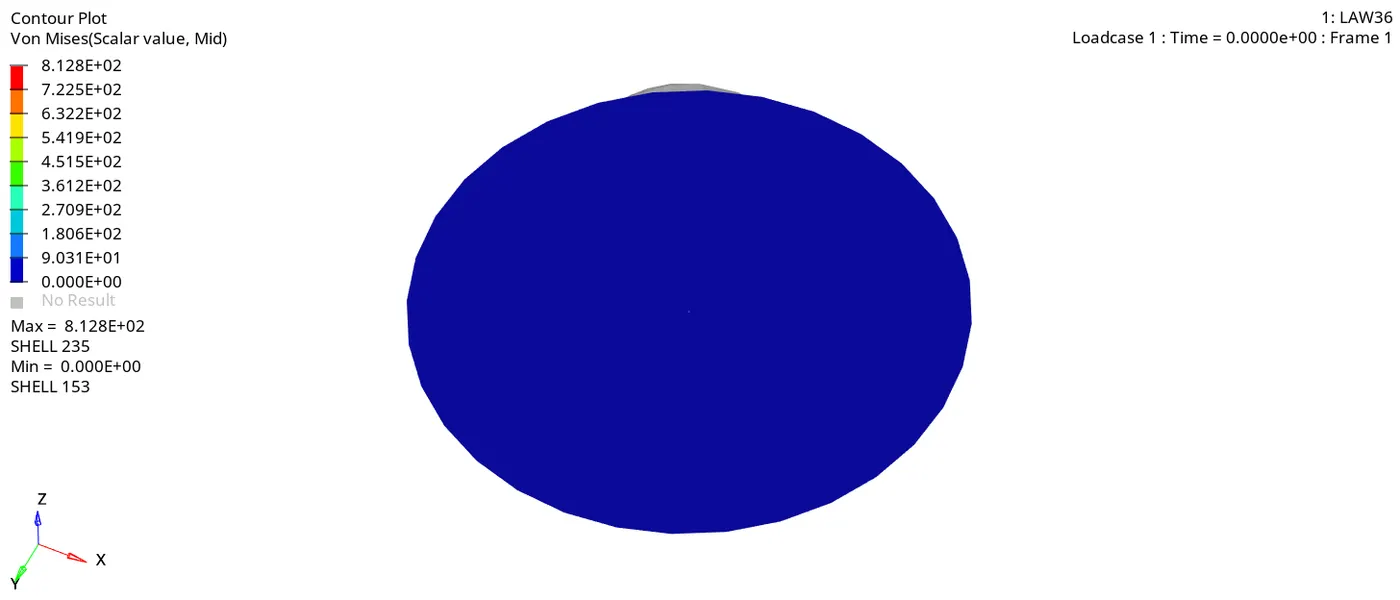
The von-mises contour as shown below;
We observe that the maximum stress is about 812.8 Mpa. The deletion of element occurs after.Some minor deformation.
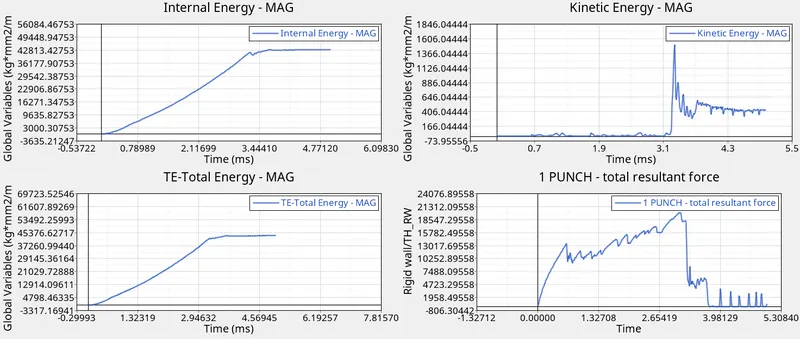
This deformation occurs until the strain reaches the eps_max value.After this the elements start getting deleted.The graphs for kinetic energy, internal energy, total energy and rigid wall forces are shown below;
Here the internal increases gradually and after 3ms there is fluctation as more number are getting deleted. Kinetic energy is almost zero until the 3 ms, then spikes up during the deletion of element but gets lower and lower as less number of element get deleted.Rigid wall forces also drop after the 3ms as the number elements which were bearing load get reduced.
TABLE:
|
CASE |
Cycles |
Energy error % |
Mass error % |
Time Elapsed |
|
Case 1 |
49380 |
1.3 |
0 |
171.06 s |
|
Case 2 |
49217 |
4.1 |
0 |
149.13 s |
|
Case 3 |
49408 |
1.2 |
0 |
163.86 s |
|
Case 4 |
48737 |
3.0 |
0 |
168.45 s |
|
Case 5 |
47969 |
4.0 |
0 |
144.78 s |
|
Case 6 |
41113 |
-7.1 |
0 |
158.71 s |
|
Case 7 |
53155 |
-1.3 |
0 |
181.74 s |
CONCLUSION:
Failure model defines how the failure occurs.
The material laws define the material used during the simulation i.e whether the material used is plastic or, elastic or elasto-plastic. It also defines the type of material which can brittle metal,metal, glass, composite, elastic or can be user defined based on the material law used.
Element deletion occurs only if eps_max is defined.
The energies and forces flutuation occured whenever the elements were deleted or there was extreme deformation.
In all the cases hourglass energy was zero as QEPH was defined in the shell properties.
In all the cases the error % was between -15% to 5%, which is acceptable.