Assignment 3
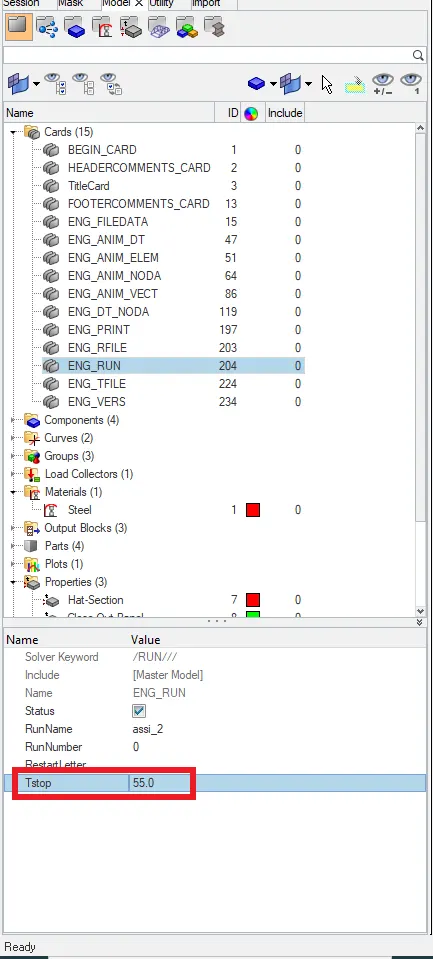
1.Using the crash beam file from the previous assignment, change the run time to 55 ms
Ans:
Inorder to change the run time,we need to go ENG_RUN in cards and need to change the Tstop
2. Change the number of animation steps during simulation to a minimum of 25 and maximum of 60
Ans:
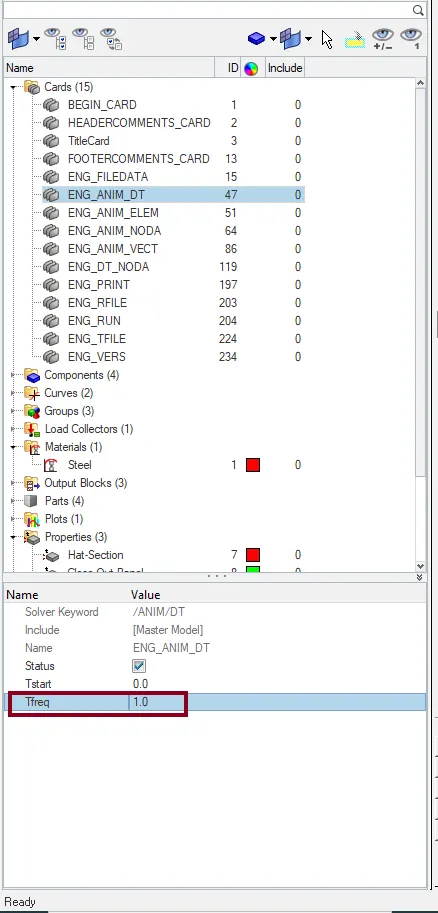
Inorder to chenge the number of animation steps we need to fix the the numper of animations needed
Here we take animation steps =55
so,
No:of animation steps = Tstp/Tfreq
Tfreq= 55/55
=1
To chage that we need to go to ENG_ANIM_DT in cards and change Tfreq = 1
3. Run the base simulation without any modification to element properties.
Ans:
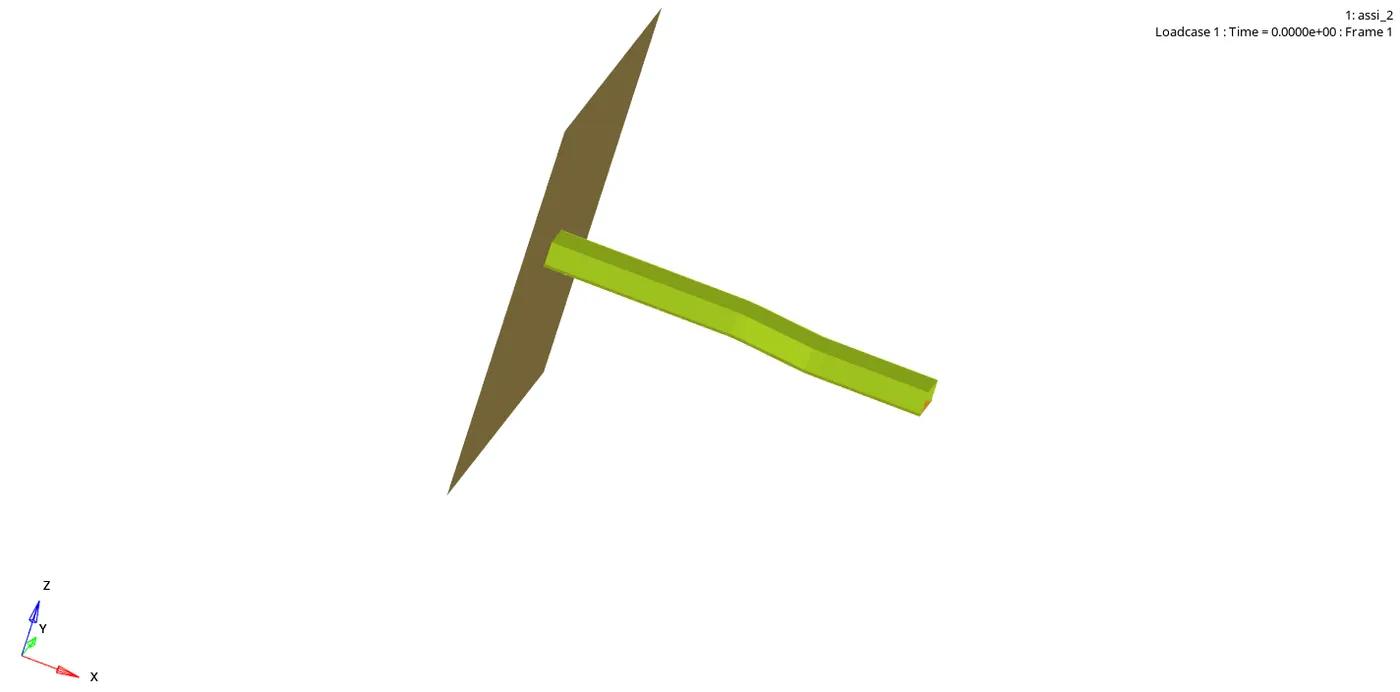
To run the simulation we need to go to Analysis> Radioss
then we need to give the rad0000 file to run the simulation
and click Radioss

4. At the end of the simulation, do the energy error and mass error checks and determine whether results would be acceptable.
Ans:
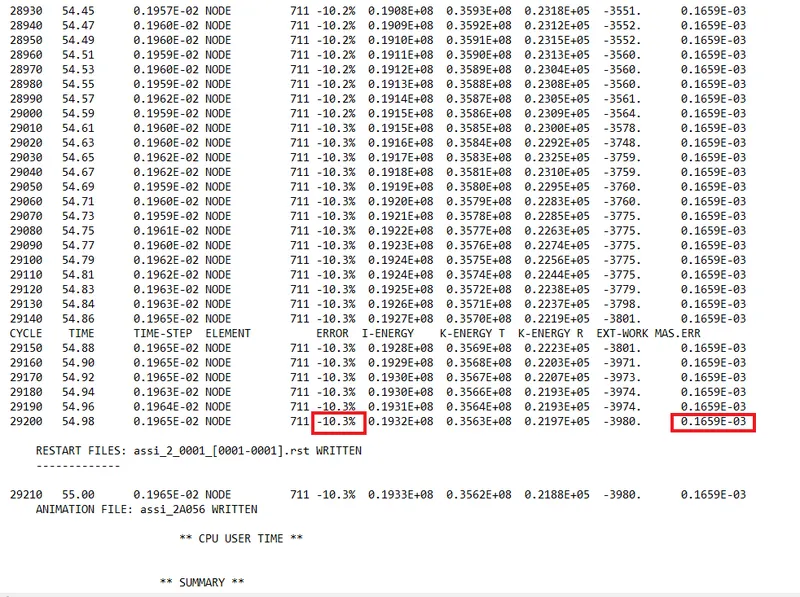
Inorder to check the energy error and mass error
We need to go to 0001rad engine out file
In that we can see the error at last of these
and the energy error is less than 15 so its acceptable.
5. If acceptable, Plot rigid wall forces, internal energy, hourglass energy, contact energy, total energy of the simulations.
Ans:
- Inorder to plot simulation and plot graphs
- We need to split the screen into 4
- And select one surface and select the input H3D file
- then click radioss
- Then we need to select the plot which we want the internal energy graph to be plotted
- then we shoult select hyper graph 2d option
- and we need select the T01 file of the model
- then we shoult select global variable option and then we shoult select which all graphs we need and select MAG
- then click apply
- Then we need to select the plot which we want the rigid wall force graph to be plotted
- then we shoult select hyper graph 2d option
- and we need select the T01 file of the model
- then we should rigid wall force option and select resultant normal force , resultant tangent force and total resultant force option
- snd click apply
6. Change all the shell elements properties to recommended properties, save this as separate, rad files and run the simulation
Ans:
- To Change all the shell elements properties to recommended properties
- we need to open the model in diffrent folder
- and click the property option
- then we can see the space to change the properties
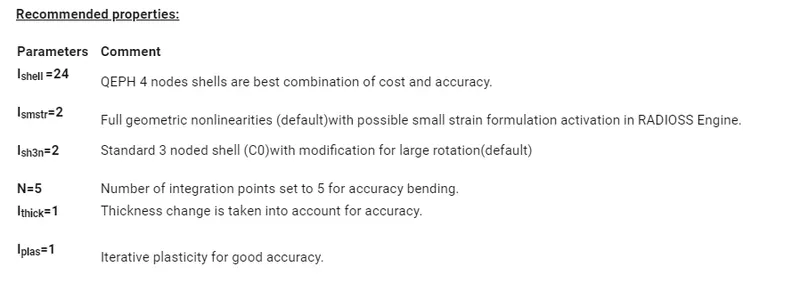
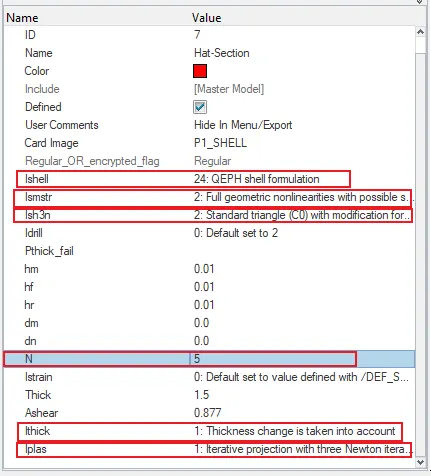
- here we change the properties as per given for both properties.
- and saved it in seperate ,
- To run the simulation we need to go to Analysis> Radioss
- then we need to give the H3D FILE to run the simulation.
- and click Radioss
7. Follow steps 5 and 6
Ans:
- Inorder to plot simulation and plot graphs
- We need to split the screen into 4
- And select one surface and select the input H3D file
- then click radioss
- Then we need to select the plot which we want the internal energy graph to be plotted
- then we shoult select hyper graph 2d option
- and we need select the T01 file of the model
- then we shoult select global variable option and then we shoult select which all graphs we need and select MAG
- then click apply
- Then we need to select the plot which we want the rigid wall force graph to be plotted
- then we shoult select hyper graph 2d option
- and we need select the T01 file of the model
- then we should rigid wall force option and select resultant normal force , resultant tangent force and total resultant force option
- and click apply
8. Create a brief report comparing all the results from steps 5 and 6 for both simulations
Ans:
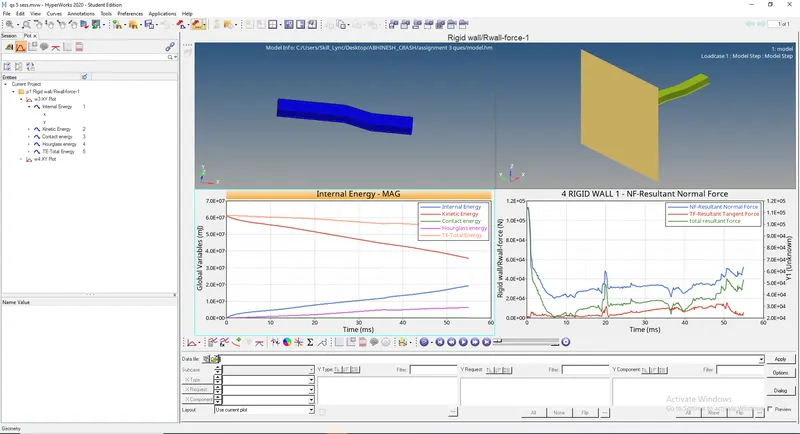
while comparing the results from both cases we can diffrenece in both internal energy graph and in rigid wall graph.
Case 1:
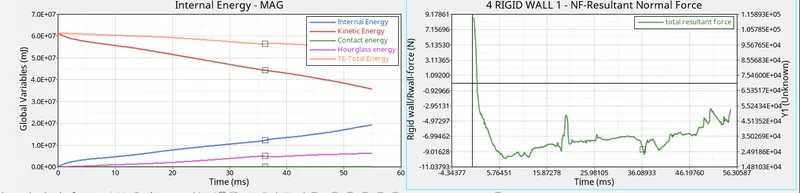
Here by looking internal energy graph,
- here the kinetic energy starts from a high point and reducing by time increase because at initial time the velocity is maximum and this is transfered as kinetic energy to the component
- here the internal energy starts from zero and by time increase the internal energy also increase as kinetic energy decrese , because the kinetic energy is converted as internal energy here
- also the hour glass energy is increasing because here doesnt define any ISHELL in the property and also it runs in a defined shell property
- and here the contact energy remains unchanged .
- and the totel energy tell the sum totel of all other energy, and it decreases by time increases.
Here by looking the Rigid wall graph ,
- it starts whith a high value at the initial time because the the component which is in contact with the rigid wall having a high kinetic energy.
- the rigid wall will experience high magnitude force only when the normal fore applied is high .
- and while time increases the the component in contact goes on deformation any diffrent manner as that is not a straigth shape
- so the area of contact of the rigid wall experience reduced force by time increses
- also when the time increase there shos some increase in the graph in the middle portion becuase the component goes defornmation in such manner .
- here the force goes in a negative magnitude as because the the rigid wall opposes the push of the component.
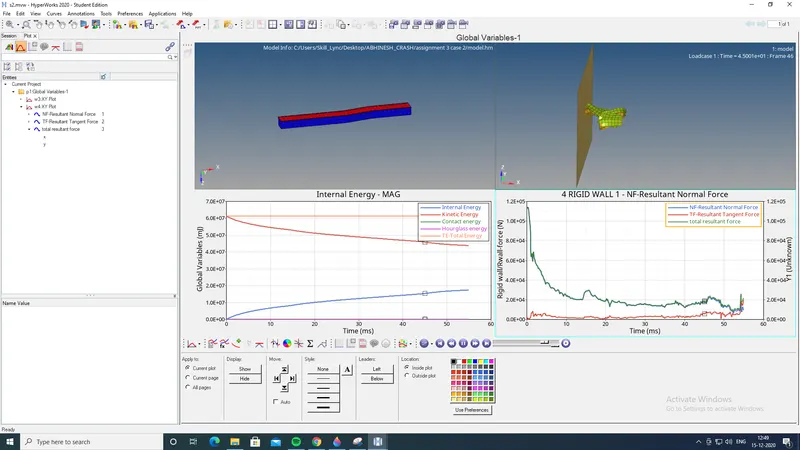
Case 2:
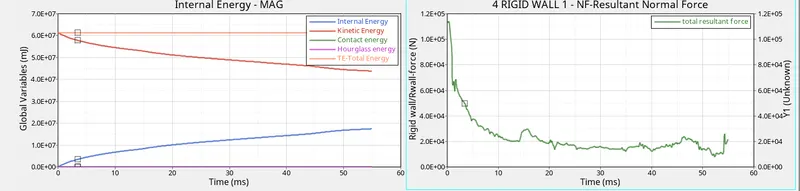
Here we given properties like,
Here by looking internal energy graph,
- here the kinetic energy starts from a high point and reducing by time increase because at initial time the velocity is maximum and this is transfered as kinetic energy to the component
- here the internal energy starts from zero and by time increase the internal energy also increase as kinetic energy decrese , because the kinetic energy is converted as internal energy here
- here the contact energy and hour glass energy keeps contant when time increases
- as there is only kinetic and internal energy varies the the internal energy represent the sum total of all these
- here when kinetic energy decreases internal energy increases , so the kinetic energy is converted as internal energy for the case of component
Here by looking the Rigid wall graph ,
- it starts whith a high value at the initial time because the the component which is in contact with the rigid wall having a high kinetic energy.
- the rigid wall will experience high magnitude force only when the normal fore applied is high .
- and while time increases the the component in contact goes on deformation any diffrent manner as that is not a straigth shape
- so the area of contact of the rigid wall experience reduced force by time increses
- also when the time increase there shos some increase in the graph in the middle portion becuase the component goes defornmation in such manner .
9. Comment whether there is any change in the results and why there is any change in the result
Ans:
- here the changes are like the hourglass energy got constant.
- Here there is changes occuring in both cases becauses we doesnt specify the Ishell Ismstr and Ish3n
- here in the 2 nd case we given the Ishell = 24
- so that this Ishell 24 has improved reduced integration point and it gives better accuracy
- also it stabilizes the hour glass energy .