3S4P vs 4S3P Battery Pack Modelling, Simulation & Explanation using Simulink
OBJECTIVES:
To build a Battery Pack with 3S 4P configuration with Generic Battery Block in Simulink:
- Configure the batteries as per a Lithium ion battery datasheet.
- Explain your parameters.
- Simulate the model and comment on the results for SOC, Voltage, Current in detail.
- Change the configuration to 4S 3P and simulate the model.
- Compare the results for both model and give your explanation for the results.
SOLUTIONS:
Building a Battery Pack with 3S 4P configuration with Generic Battery Block in Simulink:
The Simulink Window of MATLAB is opened and the following Blocks are used for modelling the 3S 4P Battery Stack as well as the 4S 3P Battery Stack:
- Battery Block -> Represents a Generic Battery/Cell Model
Simulink Library Path: Simscape / Electrical / Specialized Power Systems / Sources
This Block implements a generic dynamic model of a cell/Battery that represents most popular types of Rechargeable batteries. For my model the Lithium Ion Cell has been chosen to represent the Cell/Battery Model. Since the Battery Pack to be configured for the Objectives is of the form 4S 3P and 3S 4P, therefore 12 such Battery Blocks has been take for implementing the Generic Model of a Lithium Ion Cell.
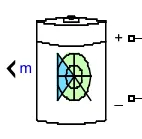
Generic Battery Block
- Bus Selector Block-> This Block implements the required outputs that you want to generate from an incoming multiple input signal(s). The block can output the selected elements/signals separately or in a new virtual bus.
Simulink Library Path: Simulink / Commonly Used Blocks
The Generic Battery Model Block can generate the output signals like the SOC, Current, Voltage, Maximum Capacity, Ambient Temperature and Age. However as per the Objective, only the SOC, Current and Voltage from the Generic Battery Block needs to be generated (along with labels). Hence the Bus Selector Block is used for this purpose.
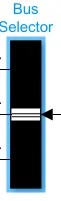
Bus Selector Block
- From Workspace Block: This Block is used to generate signal data from the MATLAB Workspace into the Battery Stack Model in Simulink.
Simulink Library Path: Simulink / Sources
Since the Battery Stack requires the Power (for EV & HEVs as per the Driving requirements which includes acceleration, deceleration, constant speed and State of Rest) and hence the Current Requirement, there needs to be a source from which Current Requirements can be delivered to the Battery Stack. For this the ‘From Workspace Block’ is used from which the data for the consumed Current according to the UDDS Drive Cycle Data for the given time is loaded to the block provided the data is already loaded into the Workspace in the main MATLAB Window and the file from which the data has been imported is present in the Current Folder Section in the main MATLAB window.
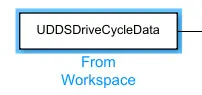
From Workspace Block
- Voltage Measurement Block: This Block is used to measure the instantaneous Voltage between 2 electric nodes.
Simulink Library Path: Simscape / Electrical / Specialized Power Systems / Sensors and Measurements
This Block has been used as a Voltmeter for finding out the Voltage Variation between the Parallel Circuit branches according to which the Battery Stack has been arranged.
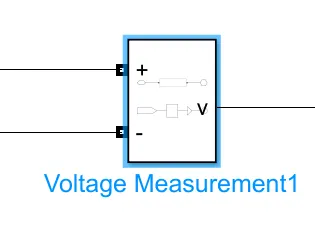
Voltage Measurement Block
- Current Measurement Block: This Block is used to measure the instantaneous current flowing in any electrical block or connection line.
Simulink Library Path: Simscape / Electrical / Specialized Power Systems / Sensors and Measurements
This Block has been used to find out the profile of the Current flowing in each branch of the Series-Parallel Circuit of the Battery Stack.
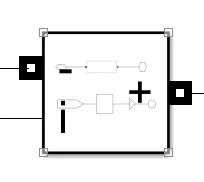
Current Measurement Block
- Mean Block: This Block is used to compute the mean value of an input Signal which may be varying/not varying w.r.t. time.
Simulink Library Path: Simscape / Electrical / Specialized Power Systems / Sensors and Measurements
The Mean Block has been used to compute the average/mean value of the Voltage & Current for the Cells of Battery Stack which are connected to the Positive and Negative terminal of the Current Source. This Block has also been used to compute the average/mean value of the Current flowing in each branch of the Battery Stack and also the Voltage across the Branch(s) of the Battery Stack.
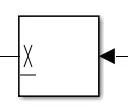
Mean Block
- Scope Block: This Block is used to display the signals which are generated during/after Simulation as per the input to this Block on a typical Plot/Graph w.r.t. time.
Simulink Library Path: Simulink / Commonly Used Blocks
This Block is used to display the output/input signals for Current Voltage/SOC for the required cells in the Battery Stack as well as the Voltage & Current flowing in the branches of the Battery Stack.
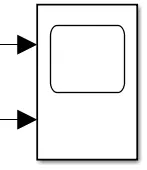
Scope Block
- Controlled Current Source Block: This Block implements an Equivalent Current Signal as output which is generated on the basis a Simulink Input Signal.
Simulink Library Path: Simscape / Electrical / Specialized Power Systems / Sources
This Block has been used to generate an Equivalent Current Signal as an output on the basis of the Current Vs Time Data of the UDDS Drive Cycle fed to it by the ‘From Workspace’ Block.
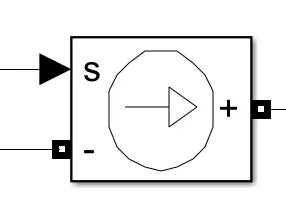
Controlled Current Source Block
- Display Block: This Block displays the value of the input signal at the end of the Simulation Time.
Simulink Library Path: Simulink / Sinks
This Block has been used to display the various signal values of the required parameter outputs of the Model at the end of simulation time.
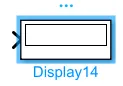
Display Block
- Add Block: This Block is used to add/subtract the input signals fed to it and generate the output after performing the summation/subtraction of the input signals.
Simulink Library Path: Simulink / Math Operations
This Block has been used to generate the sum of the Current Signals fed to each of the Parallel Branches of the Battery Stack in order to verify that there is no discrepancy between the Current fed to the Battery Model from the ‘From Workspace’ Block which has the Current vs Time Data for the UDDS Drive Cycle via the Controlled Current Source Block and the Current going into the parallel Branches of the Battery Stack.
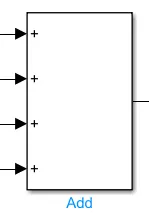
Add Block
For modelling the Battery Stack, the Data for the Current Requirement by the UDDS Drive Cycle to be used for the ‘From Workspace’ Block is first loaded into the MATLAB Workspace by double clicking on the file containing the data present in the ‘Current Folder’ Section of the main MATLAB Window. Originally the data for the Current requirement was taken from the Link:https://skill-lync.com/knowledgebase/how-to-model-generic-battery-model-using-udds-drive-cycle
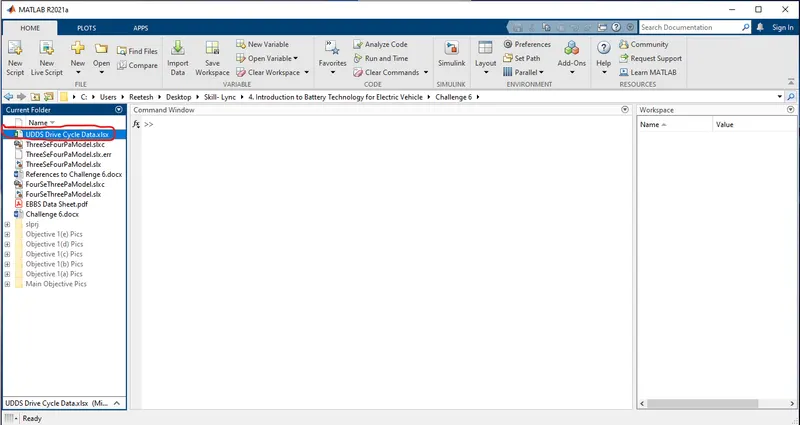
Double Clicking the required file to be exported to MATLAB Workspace
On Double Clicking the File, a new window opens which contains the Data in the form of a 2-D Array. The Relevant Data is selected and then clicking on the ‘Imported Selected‘ Button.
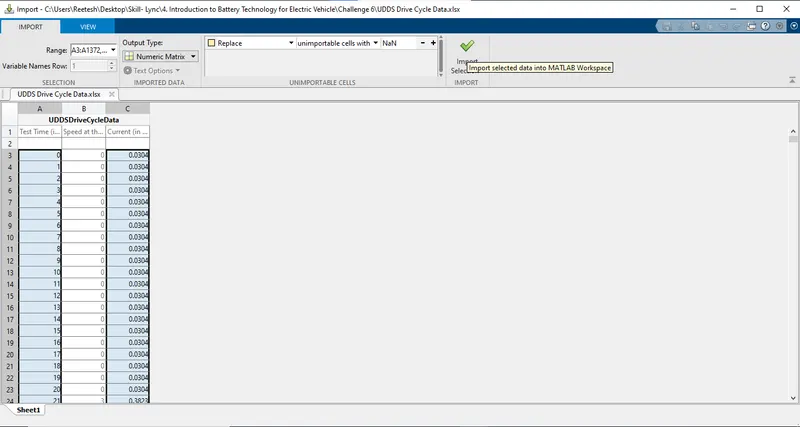
Exporting the relevant data to the MATLAB Workspace
After clicking on the ‘Imported Selected’ Button, the selected data is exported to the MATLAB Workspace.
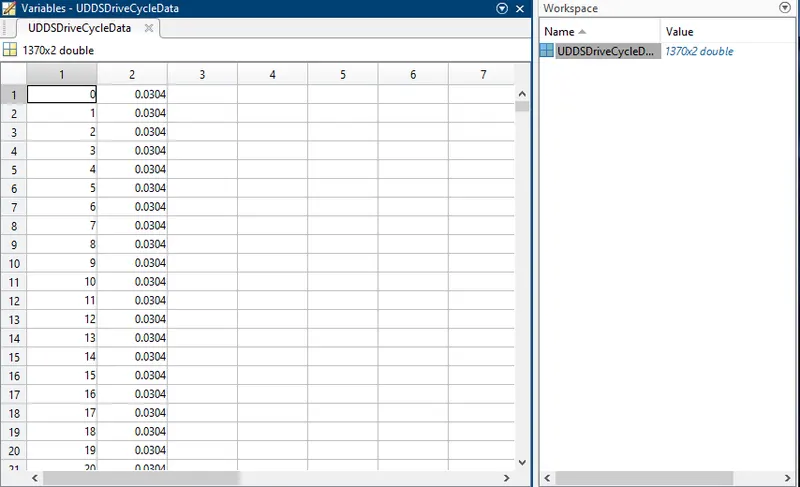
The Relevant Data (Current Requirement vs Time for the UDDS Drive Cycle) loaded to MATLAB Workspace
After the relevant data (Current requirement at a Given Time for the UDDS Drive Cycle) is loaded to the MATLAB Workspace, the Simulink window is opened and the ‘From Workspace’ Block is added. On Double-clicking the ‘From Workspace’ Block, the relevant data is imported from the MATLAB Workspace by typing the name of the file in the ‘Data’ section.
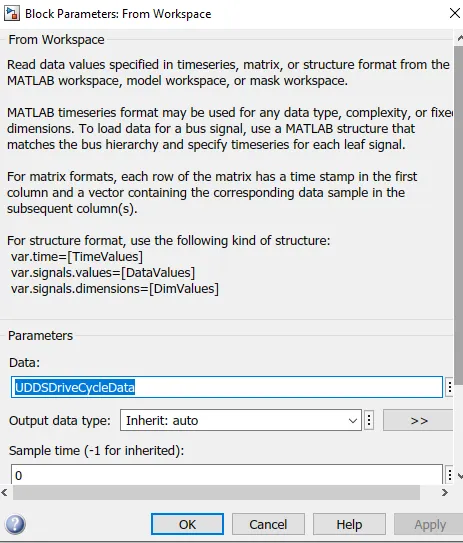
The Relevant Data being loaded to (imported from MATLAB Workspace) the ‘From Workspace’ Block
The Battery Pack with 3S4P Configuration modelled is shown in the picture(s) below:
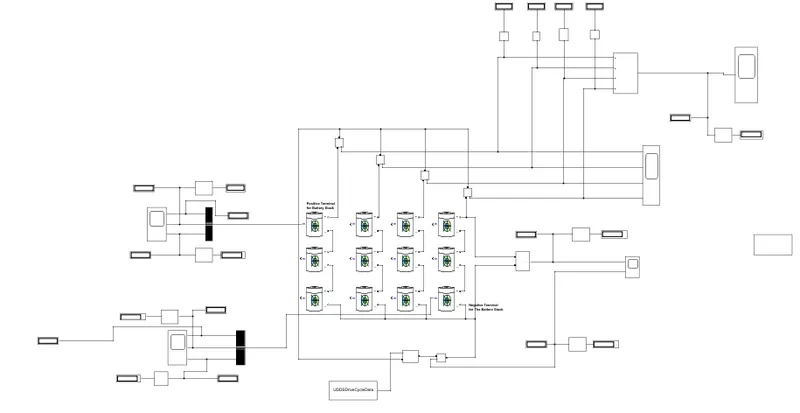
3S4P Battery Stack Model General Pic
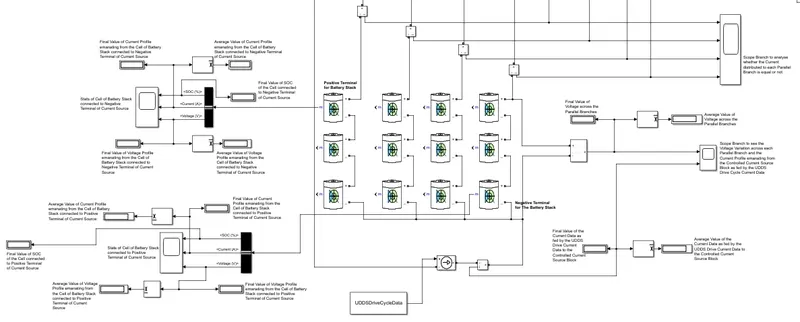
3S4P Battery Stack Model Zoomed Pic 1
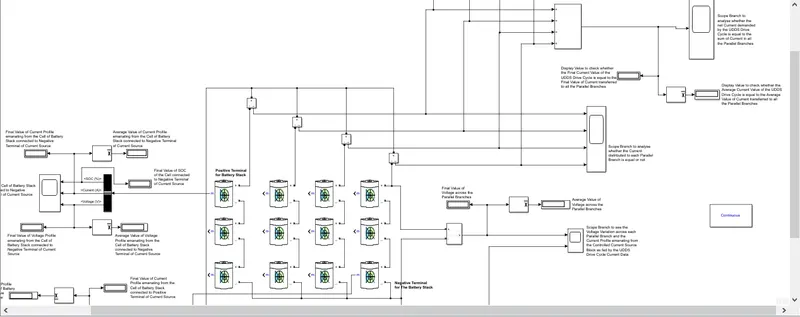
3S4P Battery Stack Model Zoomed Pic 2
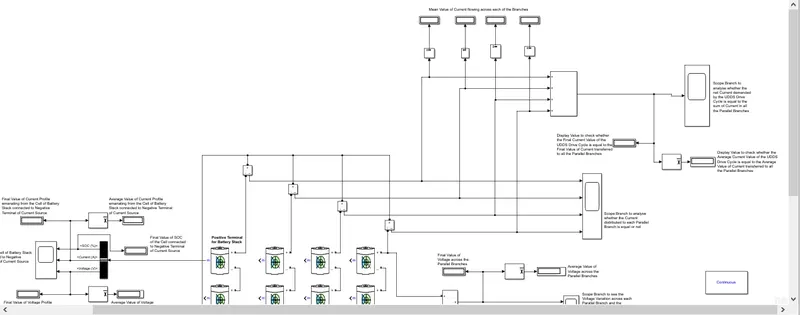
3S4P Battery Stack Model Zoomed Pic 3
Solution to Objective 1(a):
12 Generic Battery Model Blocks (3S4P which indicates that there is a requirement of 3 X 4 = 12 Battery Model Blocks for the Battery Stack) are added in Simulink. Each of these Blocks can be configured to represent the general behaviour of most Rechargeable Batteries.
For these Battery Blocks, a Lithium Ion Cell Model manufactured by a company named EBBS has been used as a reference to configure the Battery Blocks. The datasheet for the Lithium Ion Cell Model can be accessed by the clicking on the following link: https://drive.google.com/file/d/1M7Sc3wHTn8_Qwtz1bC4u7Yfows7TfJww/view?usp=sharing
The relevant parameters in the EBBS Lithium Ion Cell Datasheet for the configuring the Generic Battery Block(s) are as follows:
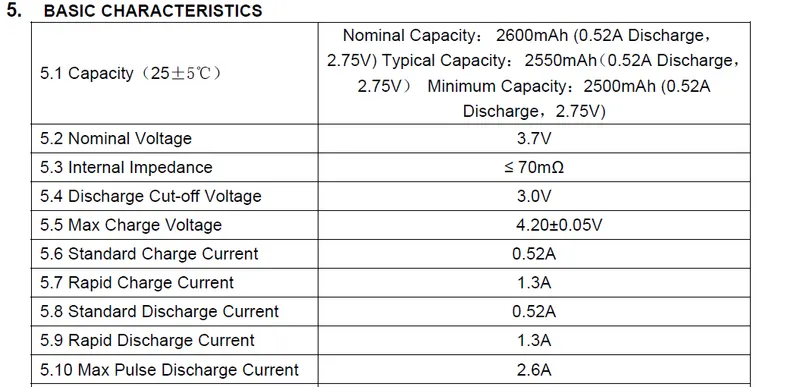
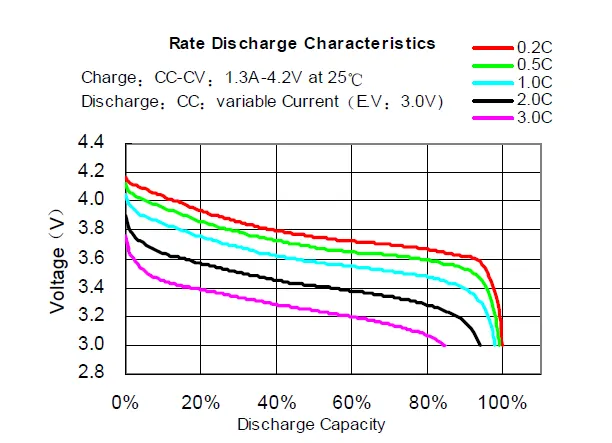
Parameters in the Datasheet that are to be configured in the Generic Battery Model
Each of the Generic Battery Model Block is configured as per the specifications in the EBBS Lithium Ion Datasheet as follows:
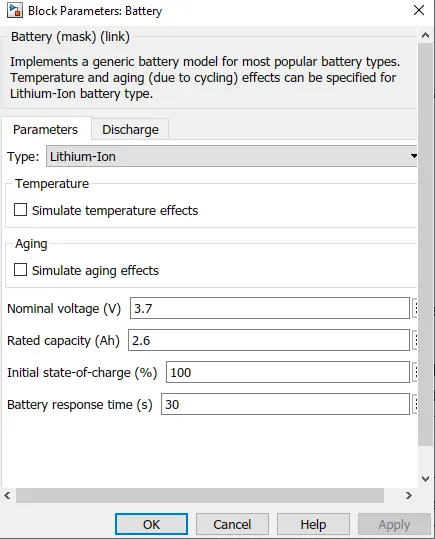
General Parameter values given to each of the Generic Battery Model Block in the Battery Stack
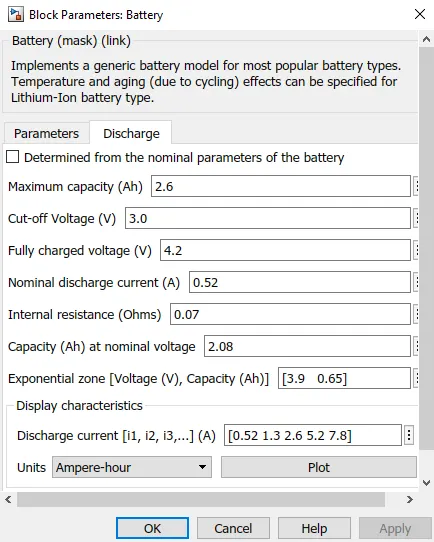
Discharge Parameter Values given to each of the Generic Battery Model Block in the Battery Stack
Solution to Objective 1(b):
The Parameter Values given for each of the Battery Model of the Battery Stack and the reasons for doing so are stated below:
General Parameters of the Cell:
- Nominal Discharge Current: As per the Datasheet, the standard Discharge & Charge Current is 0.52 A.
- Nominal Voltage: As per the Datasheet, it is clearly specified as 3.7 V.
- Initial SOC: The Initial SOC (State of Charge) of any newly manufactured Cell is in general 100%. Hence 100% has been put as input to this parameter.
- Battery Response Time: By default it is taken as 30 seconds as there is no mention of the Battery Response Time in the Datasheet.
Discharge Parameters of the Cell:
- Maximum Capacity: As per the Discharge Characteristics of the Cell in the Datasheet and the specification in the sheet, the maximum capacity of the Cell is 2600 mAh or 2.6 Ah.
- Cut-off Voltage: As per the Discharge Characteristics of the Cell in the Datasheet and the specification in the sheet, the cut-off Voltage of the Cell is 3.0 Volts.
- Fully Charged Voltage: As per the Discharge Characteristics of the Cell in the Datasheet and the specification in the sheet, the Maximum Charge Voltage (Voltage at 100% SOC) is given as 4.2 Volts with a tolerance of ± 0.05 Volts. For input into the Generic Battery Model Block, the value of 4.2 Volts will be taken.
- Nominal Discharge Current: As per the Discharge Characteristics of the Cell in the Datasheet, the Nominal Discharge Current is assumed to be same as Standard Discharge Current which is specified as 0.52 Amperes.
- Cell/Battery Capacity at Nominal Voltage: According to the Charge/Discharge Characteristics of the Cell in the Datasheet, the Cell Capacity at Nominal Voltage (3.7 V). Now considering the Nominal/Standard Discharge Current as 0.52 A and the Nominal Capacity of the Battery as 2.6 Ah, then the C-rate corresponding to the Cell Capacity at Nominal Voltage of the plot is 0.2C. Hence we can consider 0.2C as the Nominal C-Rate. On analysing the curve represented by 0.2 C in the Voltage-Discharge Capacity plot, the Discharged Cell Capacity at Nominal Voltage seems to correspond to 80% Discharge Capacity which is roughly equivalent to (0.8*2.6 Ah)= 2.08 Ah.
- Exponential Zone for Voltage and Capacity: The curve corresponding to the Nominal/Standard Discharge Current (0.52 A) and Nominal Capacity of the Battery (2.6 Ah) which is the curve representing the 0.2 C Rate, visually the exponential zone doesn’t seem clear. But on basis of General Discharge Characteristics of most Lithium Ion Batteries, the estimate seems to point at 3.9 V Discharge Voltage and 25% Discharge Capacity which is equal to 0.65 Ah Discharge Capacity.
- Discharge Current [i1, i2, i3,…]: The user has to give input of the values of the Discharge Currents whose curves they want to see in the Discharge Characteristics Plot (either Discharge Voltage vs Time OR Discharge Voltage vs Battery Capacity) in order to verify the accuracy and precision of the plot generated by the Generic Battery Block and the plot present in the datasheet. Since in the data sheet, the discharge Characteristics plot has curves representing the C Rates, therefore, the Discharge Current is calculated using the Rated Capacity of the Cell and the C-Rate of the Cell. After obtaining the Discharge Current Values, it is given as input.
For 0.2 C Rate, the Discharge Current is 0.52 A (this also happens to be the standard discharge/charge current as specified in the Datasheet).
For 0.5 C Rate, the Discharge Current is 1.3 A.
For 1.0 C Rate, the Discharge Current is 2.6 A.
For 2.0 C Rate, the Discharge Current is 5.2 A.
For 3.0 C Rate, the Discharge Current is 7.8 A.
The Discharge Characteristics (either Discharge Voltage vs Time OR Discharge Voltage vs Battery Capacity) can then selected and the required plot can be obtained for verification with the Discharge Characteristics Plot in the Datasheet.
NOTE: Due to lack of required information about the behaviour of the cell based on Temperature (both of cell and ambient and other temperature related factors) and Aging factors, the Temperature Effects and Aging Effects cannot be simulated.
After entering the values to the required parameters, the plot obtained is as follows:
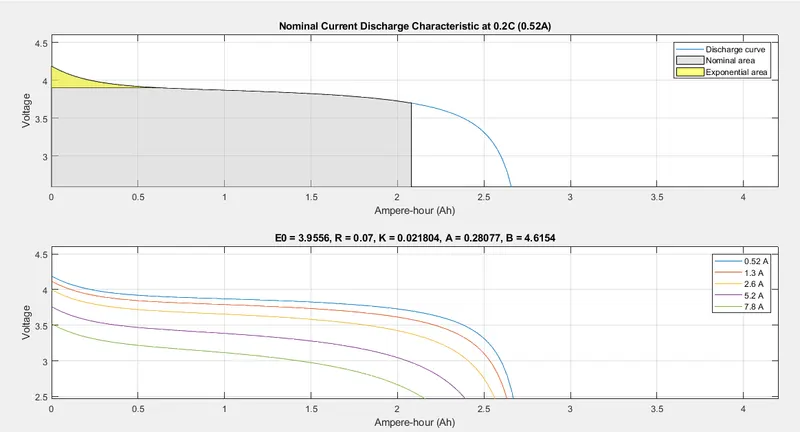
Plot obtained by the Generic Battery Model Block in Simulink after entering the values obtained from the Cell Datasheet.
VS
Discharge Characteristics Plot in the Datasheet
Solution to Objective 1(c):
On simulation of my 3S4P Battery Stack Model for 1370 seconds (corresponds to the no. of Data points for the Imported Current-Time for the UDDS Drive Cycle), the following was observed:
Net Battery Stack Voltage vs Current for the Entire Battery Stack:
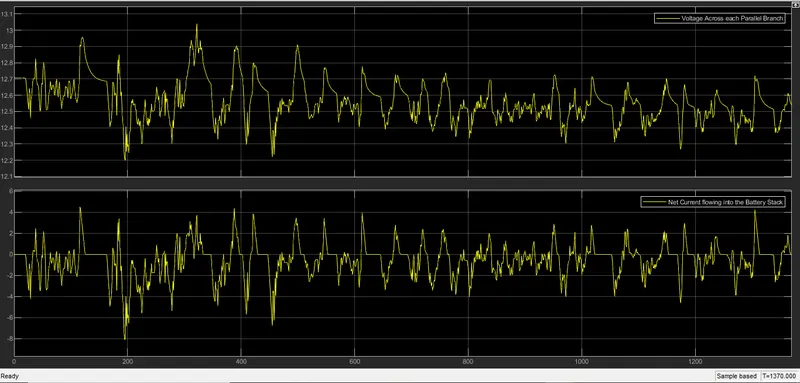
Battery Stack Voltage and Current (demanded By Load) Plot
On the basis of the plot, the following can be observed:
- Except for the values, the Voltage and Current Profile (Values on basis of Load Demand) and Variation is similar for the entire Battery Stack.
- Only in the cases where the Current is constant, the corresponding Voltage Variation for the entire Battery Stack is similar to an exponential decrease for the entire Constant Current Period.
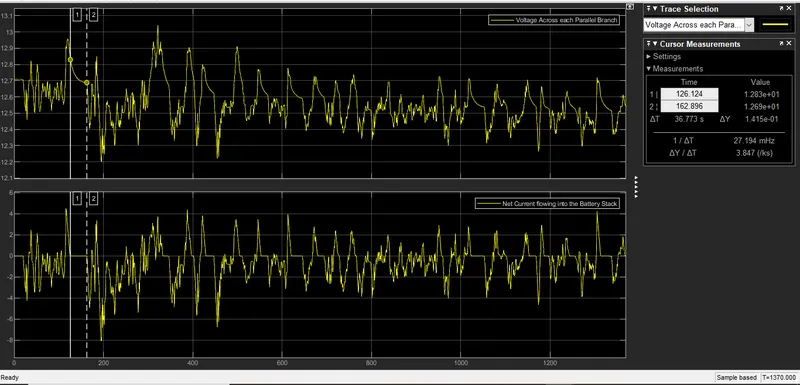
Voltage Variation in cases where the Current is constant (almost equal to 0).
- The average value of current flowing in the Battery Stack is roughly equal to 0.5951 Amperes and the Average Voltage across the Battery Stack is roughly equal to 12.56 Volts.
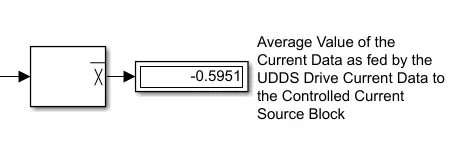
Average Current Value generated on Simulation
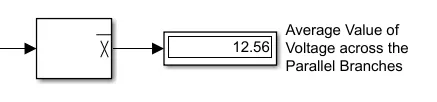
Average Voltage Value generated on Simulation
Lithium Ion Cell Modelled using Generic Battery Block:
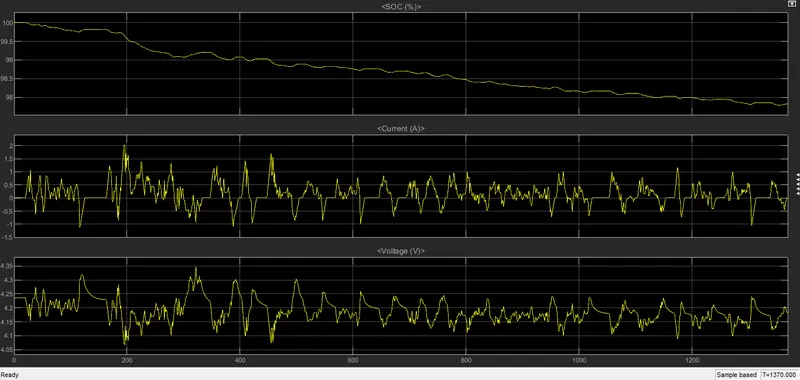
Voltage, Current and SOC (State of Charge) Variation for Each Cell in Battery Stack
On the basis of the plot(s), the following can be observed:
- The Voltage Variation in the Battery is polar opposite (turned upside down) to the Current Variation from the Lithium Ion Cell.
- Only in cases of Constant Current (almost equivalent to 0), the Voltage Variation doesn’t replicate the polar opposite (turned upside down) behaviour of Cell Current. Instead the Cell shows a somewhat exponential or more precisely, the Cell Voltage is decreasing at an increasing rate during the time frame (when Cell Current is constant and almost equivalent to 0).
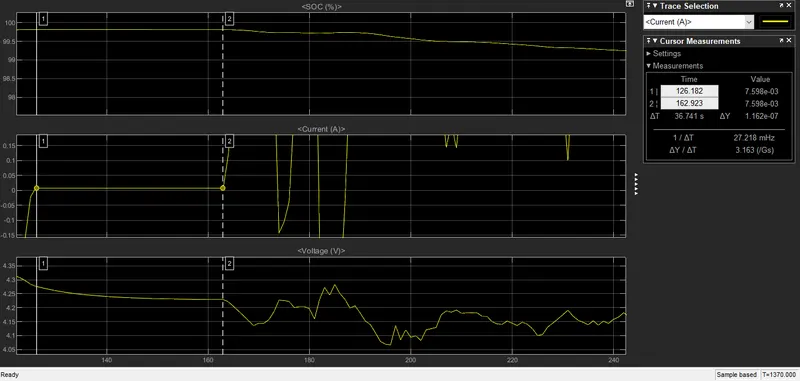
- The State of Charge of the Cell (SOC) remains constant when the Current in the Cell remains Constant (at almost 0 Value). As the Cell Current Discharges/increases, the SOC of the Cell decreases at a very small rate and The Cell voltage also correspondingly decreases.
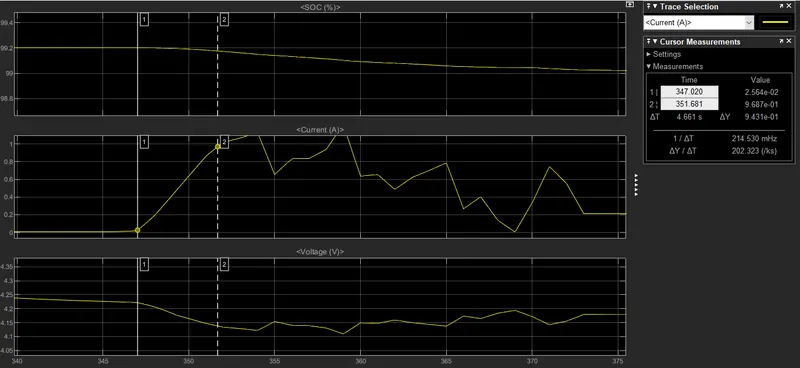
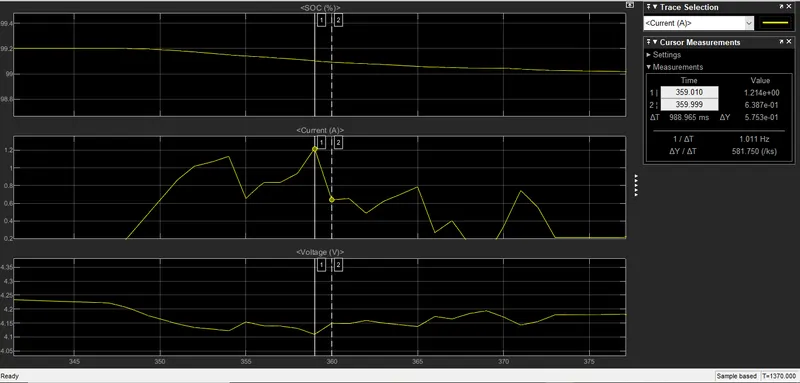
- As the Cell Current decreases, there is a corresponding increase in Voltage (almost polar opposite upside down variation).
- However as the Cell Current is below 0 (negative) and increasing, the Cell Voltage as shows a corresponding decrease (almost polar opposite upside down variation). However it can be seen that the SOC of the Cell is increasing at decreasing rate during this time frame which indicates that the Cell, although is getting charged during this time frame when the Cell Current is below 0, but the rate of Charge is decreasing and as the Cell Current tends to approach the 0 Ampere Value, more the SOC tends to decrease and become constant (although still increasing).
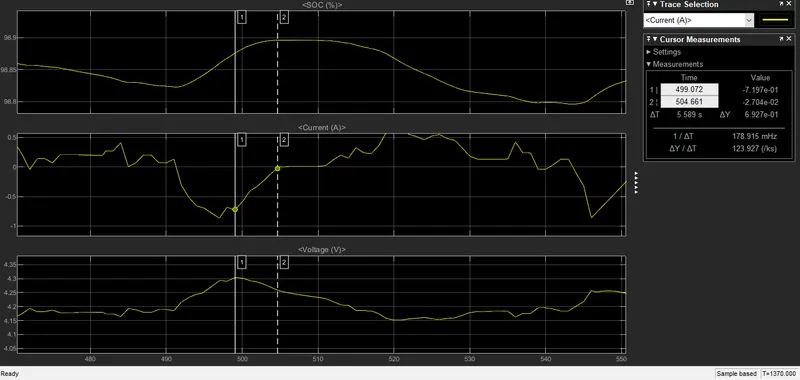
SOC of the Cell increasing when the Cell Current is below 0 and Rate of SOC Increase decreasing as it approaches the 0 Ampere Current Value
- When the Cell Current is below 0 (negative) and decreasing, the Cell Voltage as shows a corresponding increase (almost polar opposite upside down variation). However it can be seen that the SOC of the Cell is increasing at an increasing rate during this time frame which indicates that the Cell, although is getting charged during this time frame when the Cell Current is below 0, but the rate of Charge is increasing and as the Cell Current goes further downwards to the negative side, more the SOC rate tends to increase.
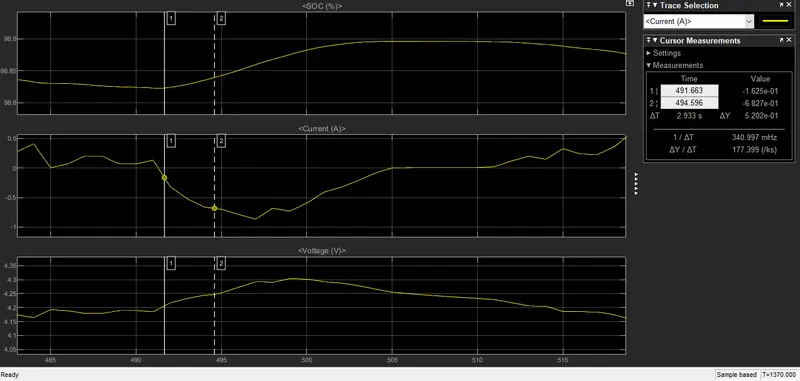
SOC of the Cell increasing when the Cell Current is below 0 and Rate of SOC Increase increasing as it further goes down to the Negative Side.
- The average Value of the Current drawn/given to each Cell in the Battery Stack is 0.1488 Amperes.
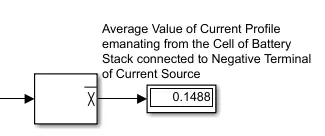
Average Value of Current Flowing from/into each Cell of Battery Stack
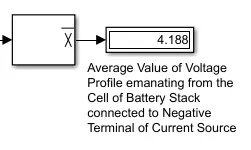
- The average Value of the Voltage in each Cell in the Battery Stack is 4.188 Volts.
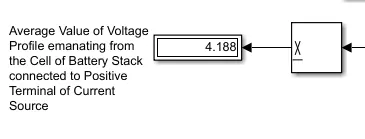
Average Value of Voltage in each Cell of Battery Stack.
General Observations:
As can be seen from the Display Blocks showing the Average Values of Current and Voltage for the Lithium Ion Cell and The Battery Stack, the following can be concluded:
- The Average Value of the Voltage in each Lithium Ion Cell Model is 4.188 Volts. Since there are 3 Lithium Ion Cell Models in Series Connection (In series Connection, The Current remains constant and the Voltage gets added) in each of the Parallel Branches, therefore the Net Voltage of The Battery Stack across each Parallel Branch should be (4.188 X 3)= 12.564 Volts. The Average Voltage Value Obtained from the Voltage Measurement Block connected in Parallel with the Battery Stack has come out to be 12.56 Volts which verifies the 3S4P Battery Modelling has been done as planned.
- The Average Value of the Current in each Lithium Ion Cell Model is 0.1483 Amperes. Since there are 3 Lithium Ion Cell Models in Series Connection (In Parallel Connection, The Voltage remains constant and the Current gets added/multiplied) in each Parallel Branches and there are 4 such Parallel Branches , therefore the Net Current from The Battery Stack for the entire Battery Stack should be (0.1483 X 4)= 0.5932 Amperes. The Average Current Value Obtained from the Current Measurement Block connected in series with the Battery Stack has come out to be -0.5932 Amperes which verifies the 3S4P Battery Modelling has been done as planned. This also verifies that the Battery Stack has been able to provide the required Current demanded by the Load (evident from the negative Avg. Value of Net Current into the Battery Stack which is demanded by the Load [present as Data in the ‘From Workspace Block’] and the Positive Avg. Value of Current from the Battery Stack in the form of results from the Generic Battery Block representing a Lithium Ion Cell).
Solution to Objective 1(d):
The Configuration of the Battery Stack has been changed from 3S4P to 4S3P. The picture(s) of 4S3P Battery Stack modelled by me is given below:
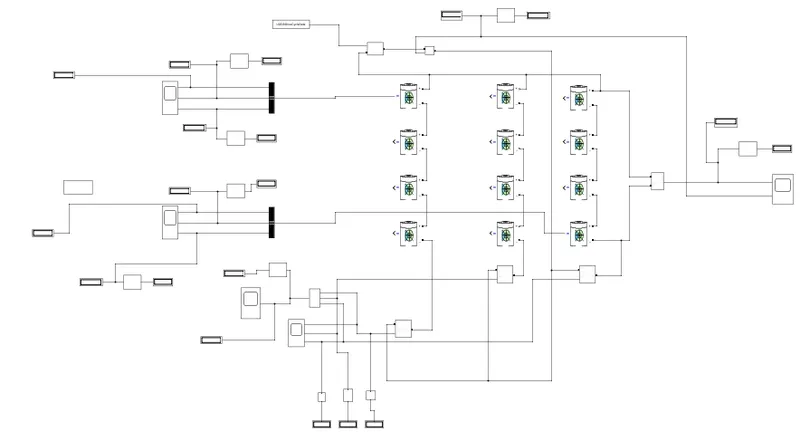
4S3P Battery Stack Configuration General View
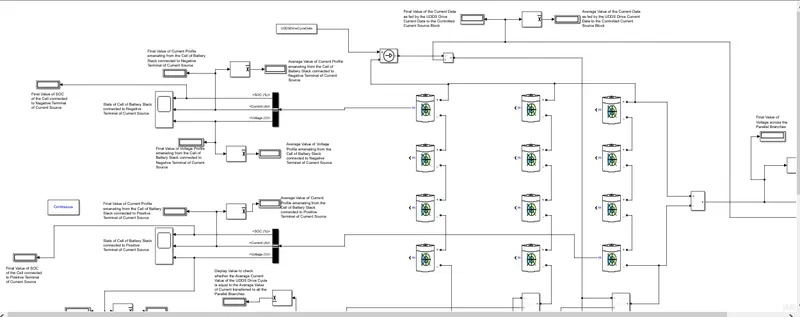
4S3P Battery Stack Configuration Zoomed In View 1
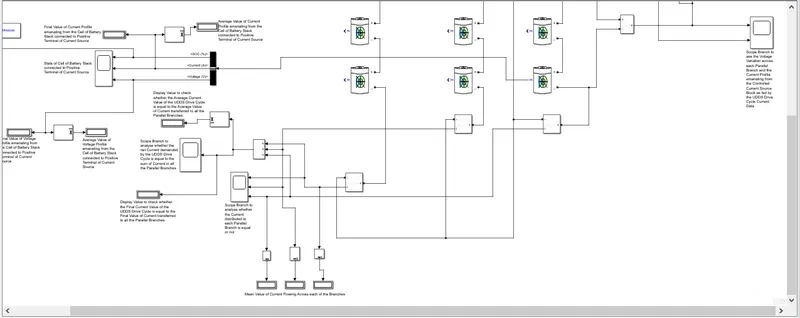
4S3P Battery Stack Configuration Zoomed In View 2
On observation of the changed configuration, nothing much has changed in this configuration compared to the previous configuration. In the previous configuration (3S4P), there were 12 (3 X 4) Generic Battery Blocks which were arranged in 4 Parallel Branches where each of the Parallel Branches had 3 Generic Battery Blocks connected in series. However in this changed configuration (4S3P), there are again 12 (4 X 3) Generic Battery Blocks which are arranged in 3 Parallel Branches where each of the parallel Branches has 4 Generic Battery Blocks connected in series.
The following Observations were seen in the changed configuration of the Battery Stack:
- The Voltage Variation across the Parallel Branches of the Battery Stack Configuration and the net Current demanded by the Load sent via data using the Controlled Current Source is as follows:
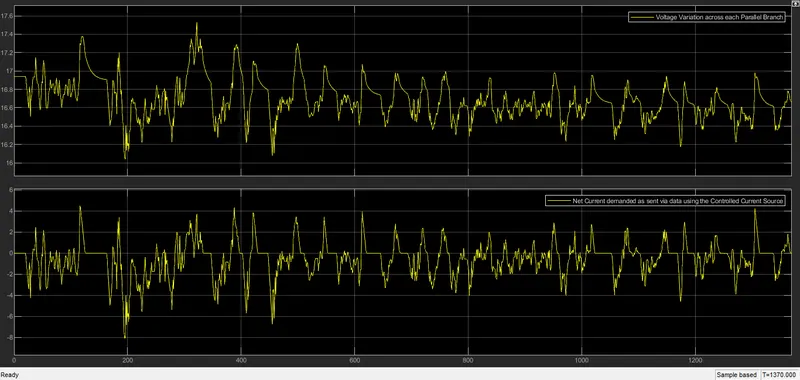
Voltage Variation across each of the Parallel Branches and the Net Current Demand Data sent via the Controlled Current Source Block
- The Average Voltage Value across each of the Parallel Branches is 16.69 Volts and the Average Net Current Value demanded from Battery Stack is -0.5952 Amperes.
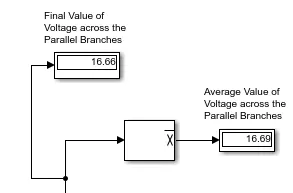
Average and Final Value of Voltage across each of the Parallel Branches for the 4S3P Battery Configuration at the end of simulation.

Average and Final Value of Current demanded from the Entire Battery Stack at the end of Simulation Time
- The Variation of Current demanded from each of the 3 Parallel Branches done using the ‘Current Measurement Block’ connected to each branch is shown below:
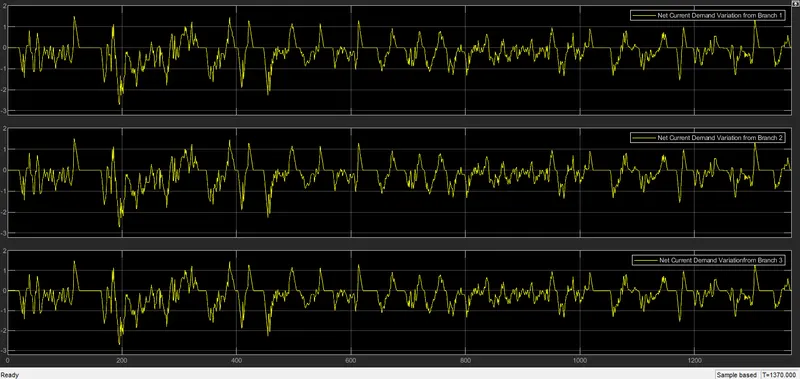
Current Demand Variation from the 3 Parallel Branches
As can be seen from the Plots, the Current Variation and the Values are similar for all the 3 Branches which indicates that all the Generic Battery Models in the branches have been modelled equally.
- The Variation of Net Current Demand has been calculated using the ‘Add Block’ from Current Demand Variation from each of the 3 Parallel Branches by adding them up and this Net Current Variation along with the Average and Final Values at the end of Simulation is compared with the Net Current Variation, Final Value and Average Value emanating from the Controlled Current Source Block.
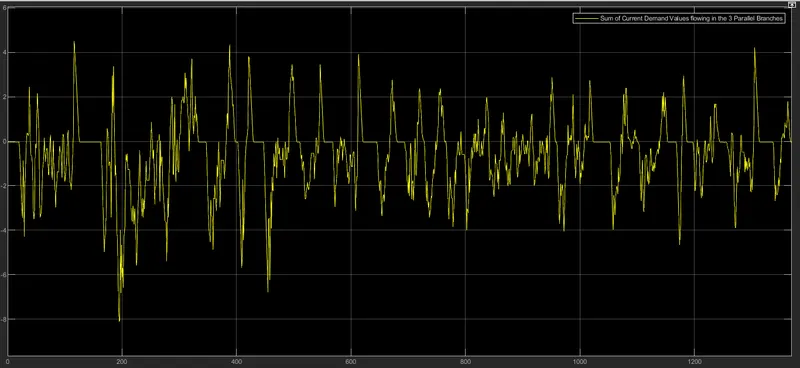
Net Current Demand Variation calculated by adding up the Current flowing into each of the 3 Parallel Branches
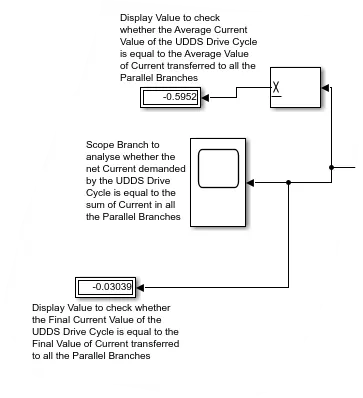
Average and Final values of Current demanded after calculating their sum from the Current flowing in each of the 3 Parallel Blocks
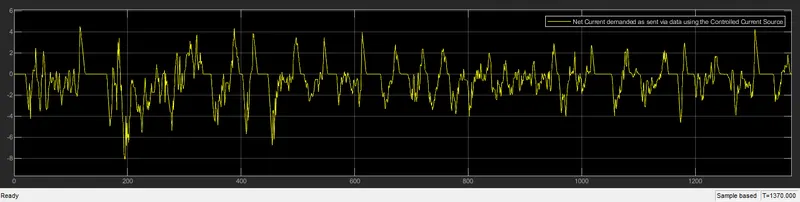
Net Current Demand Variation emanating from the Controlled Current Source Block

Average and Final values of Current demand emanating from the ‘Controlled Current Source Block’ based on the data from the UDDS Drive Cycle
As can be seen from the Plots and the Display Blocks, the Current emanating from the Controlled Source Block is being fully used by the Battery Stack Configuration.
- The Parameters Variation(SOC, Current & Voltage) in each of the Lithium Ion Cell (configured according to the EBBS LIR18650 2600mAh Model) is shown below:
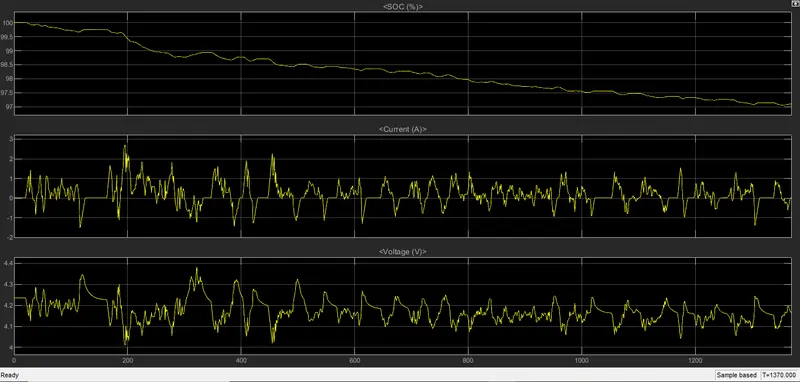
Li-Ion Cell SOC,Current & Voltage Variation as per configuration in Generic battery Model Block
- The Average & Final Values of the Voltage and Current in each Li-Ion Cell(configured according to the EBBS LIR18650 2600mAh Cell Model) at the end of simulation is shown below:
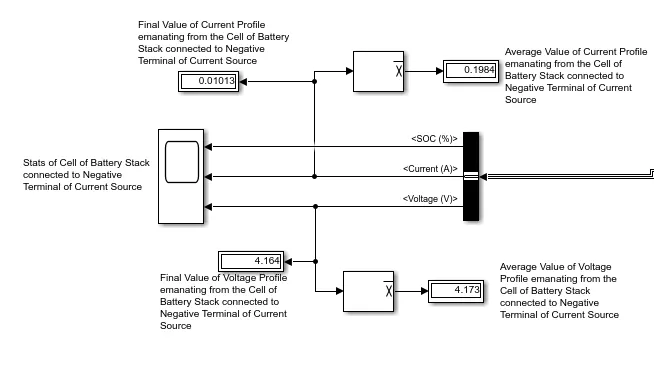
Average & Final Values of the Voltage and Current in each Li-Ion Cell (Generic Battery Model Block) of the Battery Stack
Solution to Objective 1(e):
Between the 3S4P Battery Stack and the 4S3P Battery Stack configuration, the following differences have been observed:
Difference in the Current flowing across each Branch of the Battery Stack:
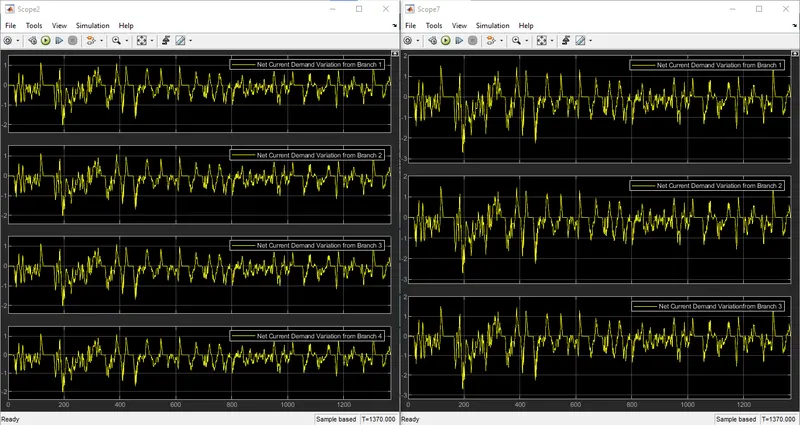
Variation in Current flowing in each Branch of the Battery Stack in the 3S4P Configuration(Left Hand Side) and 4S3P Configuration(Right Hand Side)
As can be seen from the plots, the Current Variation Profile in both the plots, although is same, but the Amplitude of Current for every time instance is greater in case of 4S3P Configuration than the 3S4P Configuration.
- In the 3S4P Configuration, the Average Current flowing in each Branch is roughly 0.1483 Amperes
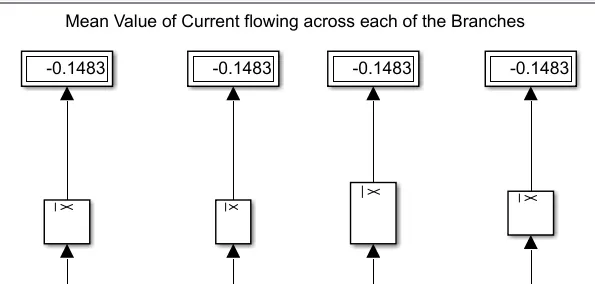
- In the 4S3P Configuration, the Average Current flowing in each Branch is roughly 0.1984 Amperes
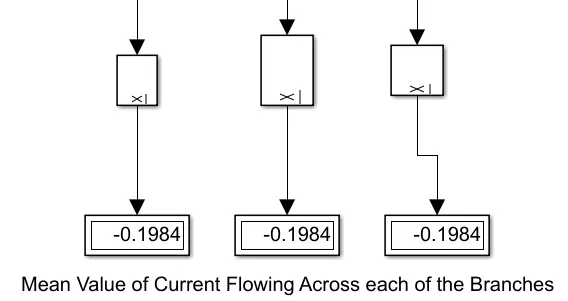
- Since the no. of Parallel Branches in 3S4P Configuration is 4 and no. of Parallel Branches in 4S3P Configuration is 3, the Net Current is distributed in each Branch of 4S3P Configuration is more than Current Distribution in each branch of 3S4P Configuration (considering also the case where the Cell Model Parameters of the Battery Stack in both the Configurations are equal). Since there is 1 more branch in 3S4P Configuration compared to the 3S4P Configuration, hence the Net Current gets an extra Branch to distribute itself leading to lesser Amplitude of Current for each time instance and hence lesser value of Average Current flowing across each Branch in case of 3S4P configuration compared to 4S3P Configuration(which has 1 Lesser Parallel Branch).
Difference in the Voltage across each Branch of the Battery Stack between the the 3S4P Configuration and 4S3P Configuration:
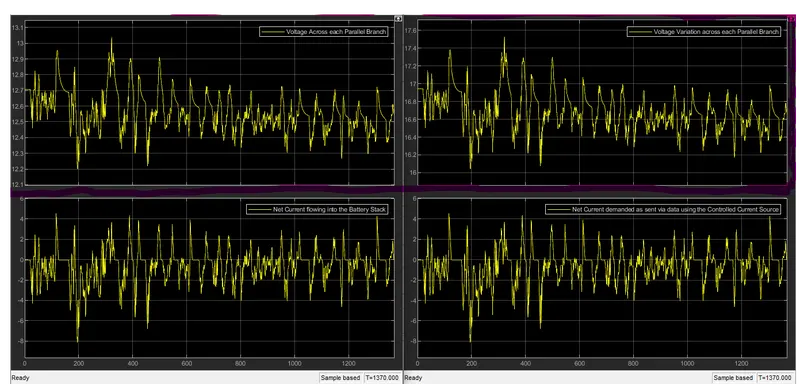
Variation in Voltage across each Branch of the Battery Stack in the 3S4P Configuration(Left Hand Side) and 4S3P Configuration(Right Hand Side)
As can be seen from the plots, the Voltage Variation Profile across the Parallel Branches in both the plots, although is same, but the Amplitude of Voltage for every time instance is greater in case of 4S3P Configuration than the 3S4P Configuration.
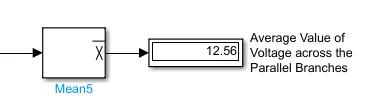
- In the 3S4P Configuration, the Average Voltage across each Branch is roughly 12.56 Volts.
- In the 4S3P Configuration, the Average Voltage across each branch is roughly 16.69 Volts
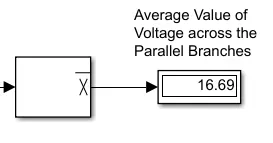
- Since the no. of Cells In Series Connection in each branch for 3S4P Configuration is 3 and no. of Cells In Series Connection in each branch for 4S3P Configuration is 4, the Voltage across each Branch of 4S3P Configuration is more than Voltage across each Branch of 3S4P Configuration as more the no. of Cells in Series connection in a branch, more the Voltage across the branch (considering also the case where the Cell Model Parameters of the Battery Stack in both the Configurations are equal).
Analysis at Cell Level(Each Cell of the Battery Stack)
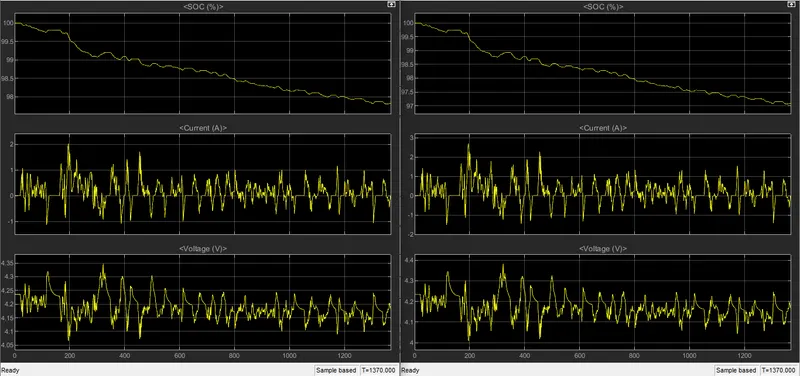
Variation in SOC, Current & Voltage Comparison of each Cell for both the Battery Stack Configurations [3S4P Configuration (Left Hand Side) and 4S3P Configuration (Right Hand Side)]
From General Observation of the Plots, the Final SOC (SOC at end of Simulation) for each Cell in the 3S4P Configuration looks somewhat greater than the Final SOC for the 4S3P Configuration.
Also the Current Variation Profile of each Cell in both the plots, although is same, but the Amplitude of Current for every time instance looks greater in case of 4S3P Configuration than the 3S4P Configuration.
And the Voltage Variation Profile for each cell in both the plots, although is same, but the Amplitude of Voltage for every time instance looks greater in case of 4S3P Configuration than the 3S4P Configuration.
Difference in the SOC for each cell of the Battery Stack between the 3S4P Configuration and 4S3P Configuration:
- In the 3S4P Configuration, the Final SOC (SOC at end of Simulation Time) of each Cell of the Battery Stack at the end of configuration is 97.83%. The Initial SOC of the Cell at the beginning of the Simulation was set to 100%.
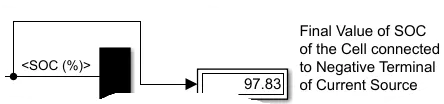
Final SOC of Each Cell of the 3S4P Battery Stack Configuration
- In the 4S3P Configuration, the Final SOC (SOC at end of Simulation Time) of each Cell of the Battery Stack at the end of configuration is 97.1%. The Initial SOC of the Cell at the beginning of the Simulation was set to 100%.

Final SOC of Each Cell of the 4S3P Battery Stack Configuration
- The difference in SOC of each Cell is due to the fact that in 3S4P Configuration, the Current requirement from each cell is 0.1483 Amperes while in 4S3P Configuration, the Current requirement from each cell is 0.1984 Amperes. More the Current requirement from the Cell/Battery, more steeply the SOC will decrease which will ultimately result in lesser final SOC of the Cell/Battery. The Current remains same in series connection and more the number of Parallel Branches, lesser will be the Current flowing in each Branch and hence lesser will be the Current generated from the Cell/Battery in each branch. Since 3S4P has more 1 more parallel branch than 4S3P, the current flowing in each Branch of the 3S4P Battery Stack Configuration is less and hence the current generated by each cell/Battery in each Branch is less and hence more the Final SOC(at the end of simulation) of the Cell.
- It is also to be noted that more the Final SOC of the Cell/Battery, more will be the Cell/Battery Capacity remaining at the end of simulation or use. Hence it can also be concluded that more the number of Parallel Branches in Battery Stack, more will be the Battery Capacity remaining at the end of simulation or use.
Difference in the Current in each cell of the Battery Stack between the 3S4P Configuration and 4S3P Configuration:
- In the 3S4P Configuration, the Average Current flowing in each cell of the Battery Stack is roughly 0.1483 Amperes.
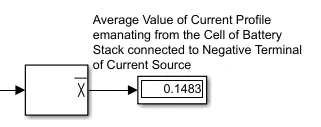
- In the 4S3P Configuration, the Average Current flowing in each cell of the Battery Stack is roughly 0.1984 Amperes.
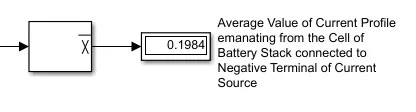
- Since the no. of Parallel Branches in 3S4P Configuration is 4 and no. of Parallel Branches 4S3P Configuration is 3, the Net Current is distributed in each Branch of 4S3P Configuration is more than Current Distribution in each branch of 3S4P Configuration (considering also the case where the Cell Model Parameters of the Battery Stack in both the Configurations are equal). Since there is 1 more branch in 3S4P Configuration compared to the 3S4P Configuration, hence the Net Current gets an extra Branch to distribute itself leading to lesser Amplitude of Current for each time instance and hence lesser value of Average Current flowing across each Branch in case of 3S4P configuration compared to 4S3P Configuration (which has 1 Lesser Parallel Branch). And in since in each Branch, the Cells are connected in series and current remains same in Loads/Cells connected in series, therefore the Current in each of the cells in 3S4P Configuration is lesser than the Current in each of the cells in 4S3P Configuration.
Difference in the Voltage in each cell of the Battery Stack between the 3S4P Configuration and 4S3P Configuration:
- In the 3S4P Configuration, the Average Voltage in each cell of the Battery Stack is roughly 4.188 Volts.
- In the 4S3P Configuration, the Average Voltage in each cell of the Battery Stack is roughly 4.173 Volts.
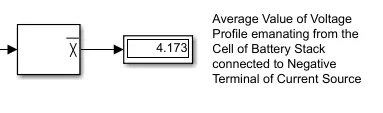
- Although the difference between the Voltage in each cell between the 2 Battery Stack Configurations is not that great, still the difference arises due to the fact that the current in each cell is greater for the 4S3P Configuration (has an avg. Current of 0.1984 Amperes flowing from each Cell) than the current in each cell for the 3S4P Configuration (has an avg. Current of 0.1483 Amperes flowing from each Cell). Since a Battery/Cell is an energy source having a Certain Limit of Energy/Capacity and as the Load (in this case the Current Demand from the Controlled Current source for the UDDS Drive Cycle) keeps drawing current, more the current drawn by the Load, the Voltage of the Battery will reduce. The Current Demand for running this load is supplied by the Cell/Battery and as a consequence greater the Current drawn from the Battery/Cell (for fulfilling the Load Current requirements), lesser the Voltage across the Battery. Hence greater the Current drawn from the Cell/Battery, lesser will be the Voltage across the Cell/Battery and vice-versa.
REFERENCES:
- https://www.youtube.com/watch?v=eQX-iobIYmw
- https://in.mathworks.com/videos/how-to-develop-battery-management-systems-in-simulink-part-3-state-of-charge-estimation-1574416618095.html
- https://skill-lync.com/challenges/yourgrade/63303/568/230597
- https://skill-lync.com/knowledgebase/how-to-model-generic-battery-model-using-udds-drive-cycle