Week 9 Tension and Torsion test challenge
Stress Concentration in Tension and Torsion Test
OBJECTIVES:
To carry out an Explicit Dynamic Analysis of Tension and Torsion of the specimen for the given materials and determine the stress, deformation, and temperature.
MATERIAL:
The Explicit Dynamic Analysis was carried out on the given specimen. The material used for this analysis was STEEL 1006 and the analysis was carried out using ANSYS Mechanical Enterprise. The model for Tension Test was imported to ANSYS Workbench software and is shown in the figure below.
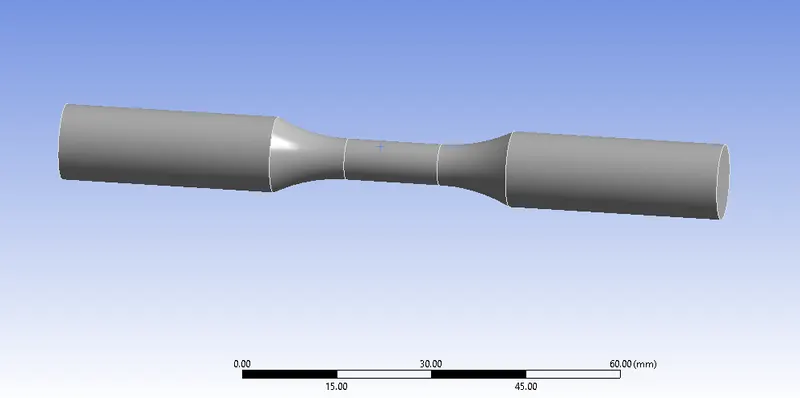
Fig.1 Tension and Torsion test Specimen
Later the material was assigned and the material and its properties used for this analysis are specified below.
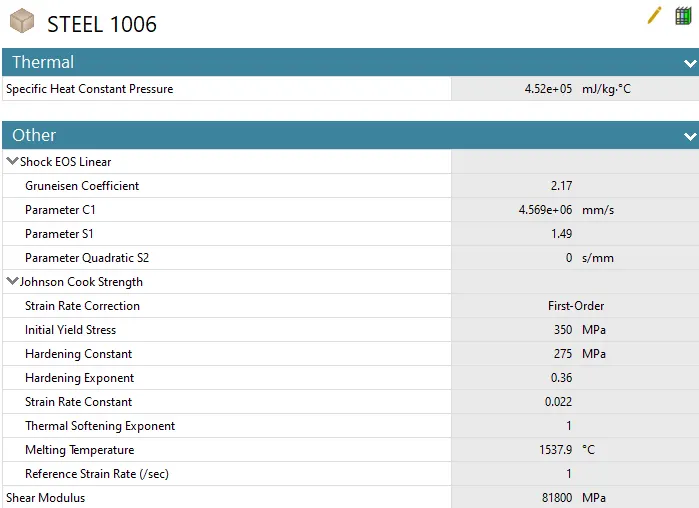
Fig.2 Material Data
|
Material |
Steel 1006 |
|
Density |
7.896e-6 kg/mm3 |
|
Shear Modulus |
81800 MPa |
|
Specific Heat |
4.52e+5 mJ/kg°C |
|
Initial Yield Strength |
350 MPa |
|
Hardening Constant |
275 MPa |
|
Components |
Specimen |
Coordinate System – Tension Test:
Two separate Coordinate systems were created in addition to the Global Coordinate system on either end face of the specimen as shown below.
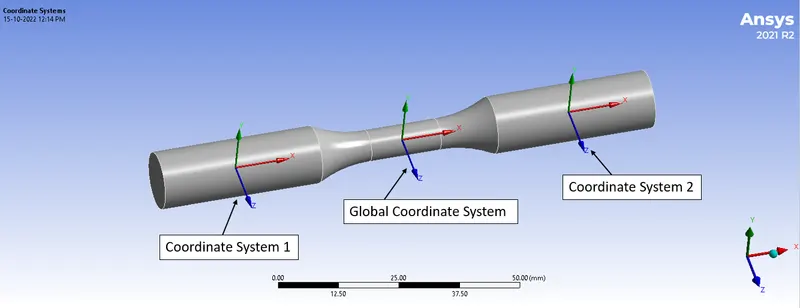
Fig.3 Coordinate System for Tension Test
Coordinate System – Torsion Test:
Additional Cylindrical Coordinate systems were created in addition to the Global Coordinate system and Two Coordinate systems as in the Tension Test on the Middle Necking Region face of the specimen as shown below.
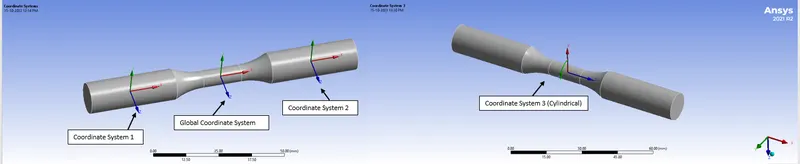
Fig.4 Coordinate System for Torsion Test
MESHING – Tension Test:
- Method: Tetrahedron for the entire specimen
- Face Sizing: Left cylindrical face
- Type: Sphere of Influence
- Centre: Coordinate System 1
- Sphere Radius: 22mm
- Element Size: 3mm
- Face Sizing: Right cylindrical face
- Type: Sphere of Influence
- Centre: Coordinate System 2
- Sphere Radius: 22mm
- Element Size: 3mm
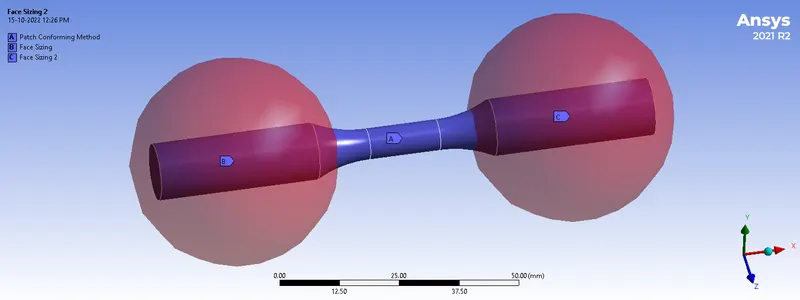
Fig.5 Face Sizing and Method
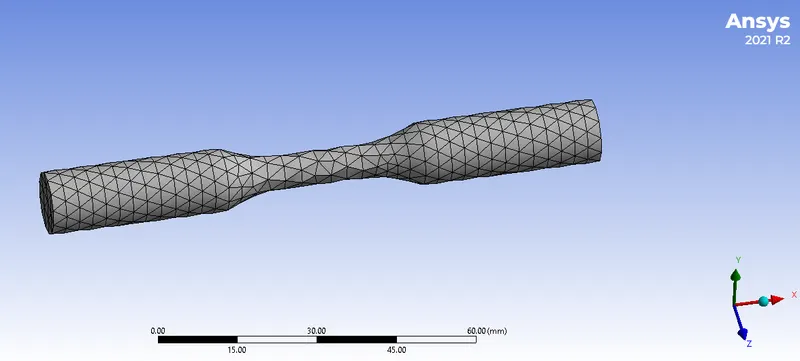
Fig.6 Meshed Specimen
A mesh metric that identifies elements according to their quality was employed and it can be seen that the elements of the lowest quality are minimal. Most of the elements have very high quality in the range of 0.88 to 1. Hence, the mesh is of acceptable quality. The meshed model is shown below.
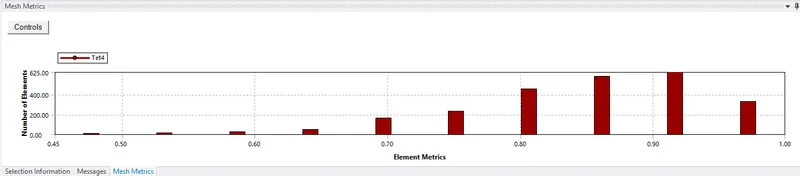
Fig.7 Element Quality
MESHING – Torsion Test:
In addition to the Method and Face Sizing applied to the specimen in the Tension Test, the following data were also applied to the Mesh for Torsion Test.
- Face Sizing: Both Shoulder Faces
- Element Size: 5mm
- Face Sizing: Middle Necking Region Cylindrical Face
- Type: Sphere of Influence
- Centre: Global Coordinate System
- Sphere Radius: 8mm
- Element Size: 1mm
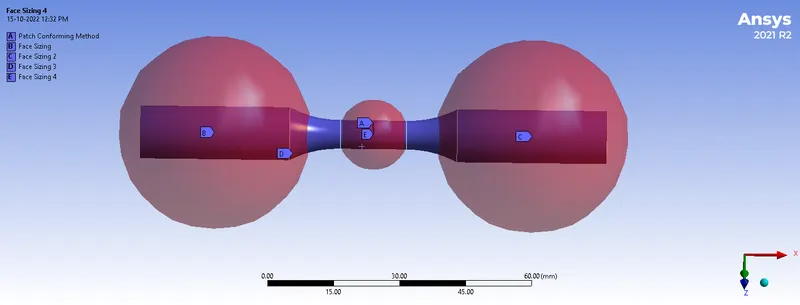
Fig.8 Face Sizing and Method
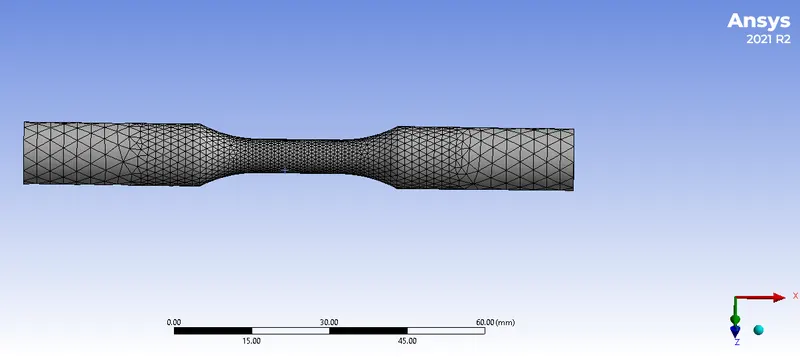
Fig.9 Meshed Specimen
A mesh metric that identifies elements according to their quality was employed and it can be seen that the elements of the lowest quality are minimal. Most of the elements have very high quality in the range of 0.8 to 1. Hence, the mesh is of acceptable quality. The meshed model is shown below.
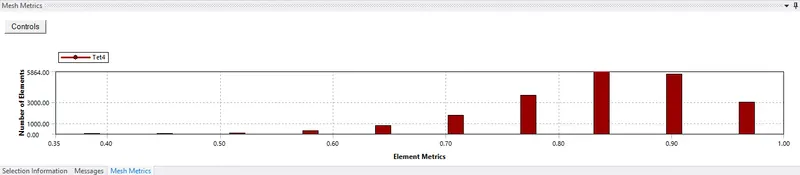
Fig.10 Element Quality
ANALYSIS SETTING – Tension and Torsion Test:
- of Steps: 1
- Load Step Type: Explicit Time Integration
- End Time: 1e-3s
- No. of Cycles: 1e+7
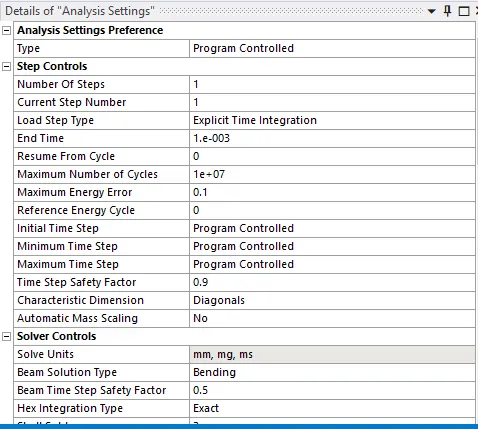
Fig.11 Analysis Setting
BOUNDARY CONDITIONS AND LOAD – Tension Test:
- Fixed Support: Left End Faces
- Displacement: Right End Faces
- X Component: Tabular Data – 18mm Displacement given.
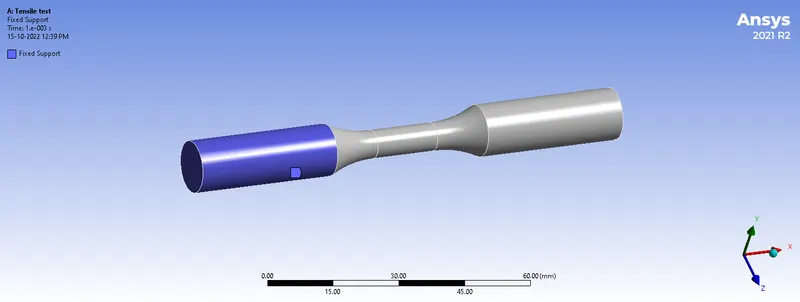
Fig.12 Fixed Support
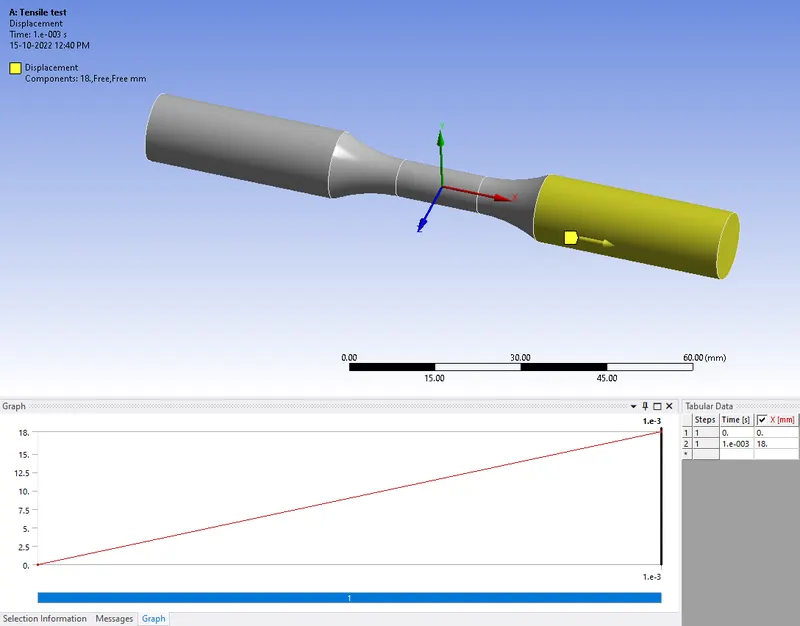
Fig.13 Displacement Load
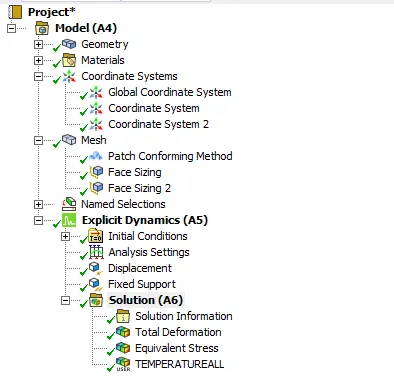
Fig.14 Case Setup – Tension Test
BOUNDARY CONDITIONS AND LOAD – Torson Test:
- Fixed Support: Left End Faces
- Displacement: Right End Faces
- Coordinate System: Coordinate System 3
- X and Z Component: Constant 0mm
- Y Component: Tabular Data – 1200° rotation
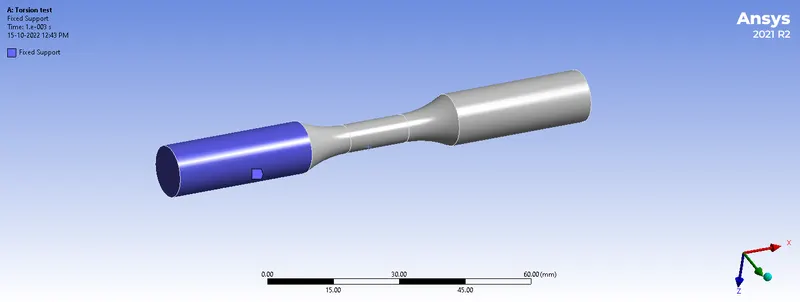
Fig.15 Fixed Support
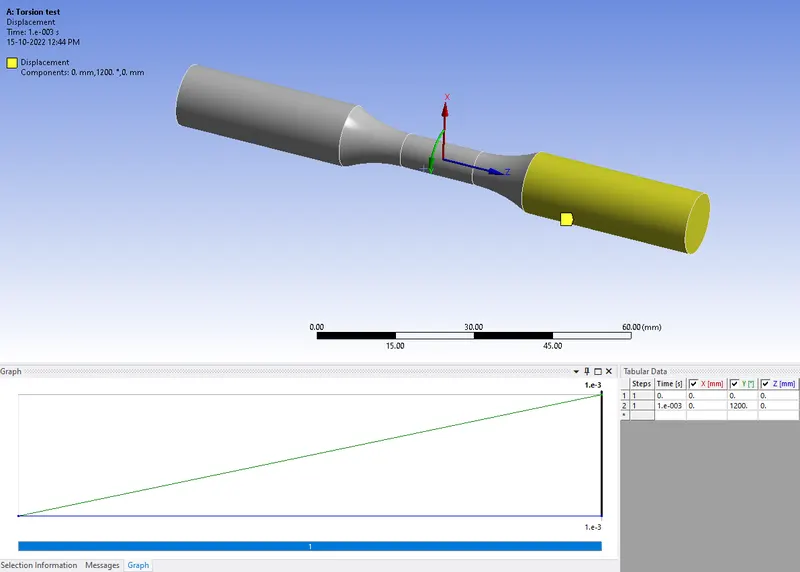
Fig.16 Displacement Load
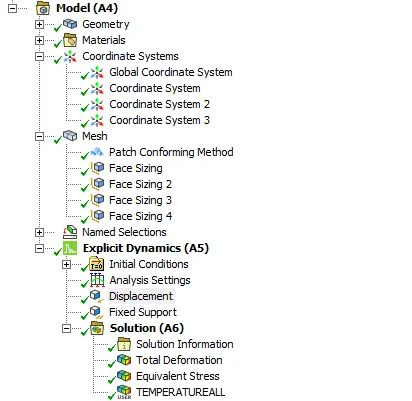
Fig.17 Case Setup – Torsion Test
RESULTS - TENSION TEST:
The Total Deformation obtained from the analysis is shown below.
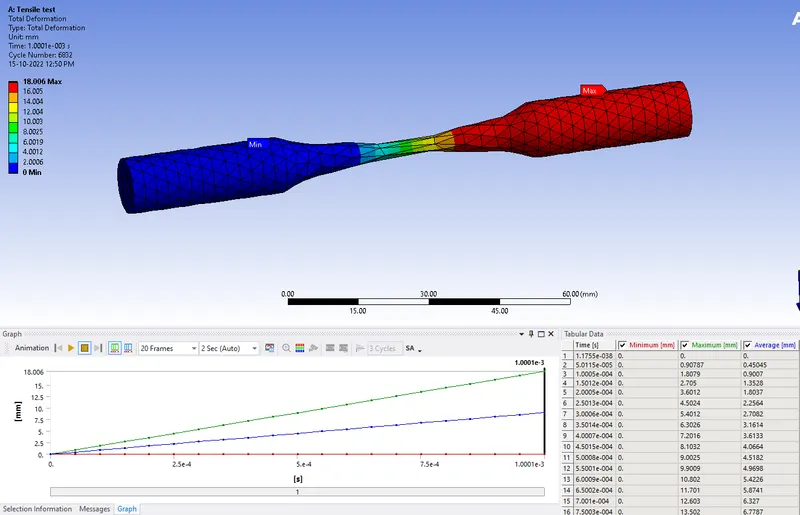
Fig.18 Total Deformation Contour Plot
The Equivalent (Von-Mises) Stress obtained from the analysis is shown below.
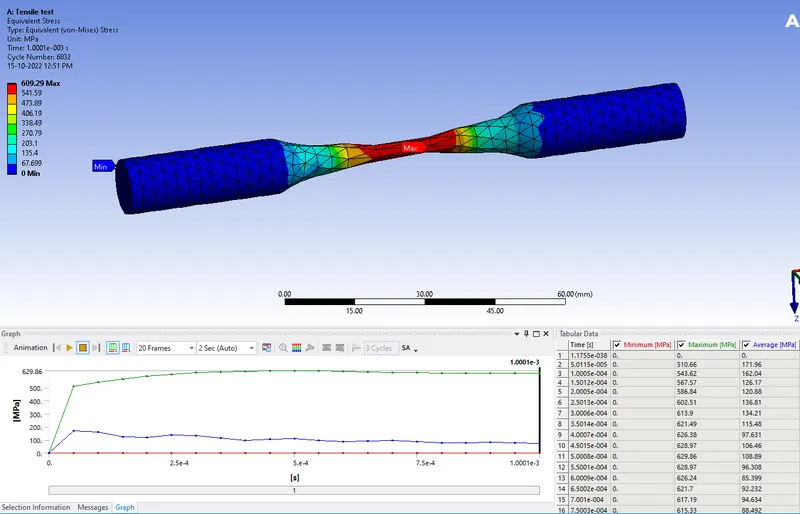
Fig.19 Equivalent Stress Contour Plot
The Temperature of the Specimen obtained from the analysis is shown below
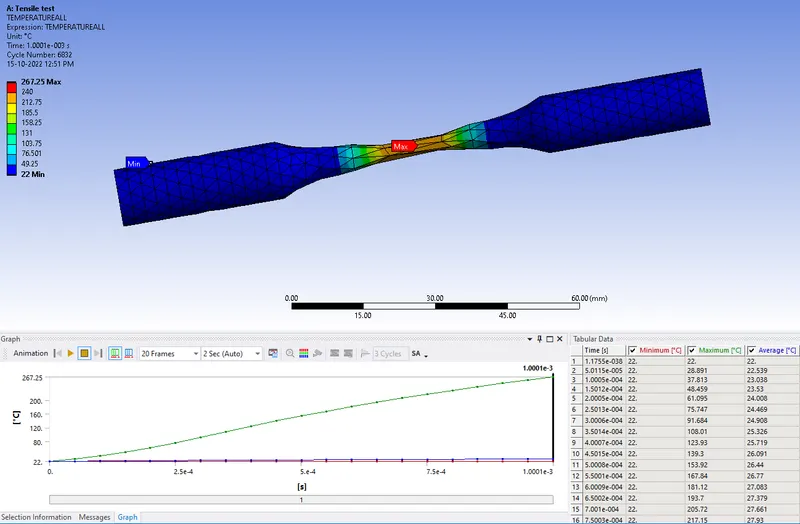
Fig.20 Specimen Temperature Contour Plot
RESULTS - TORSION TEST:
The Total Deformation obtained from the analysis is shown below.
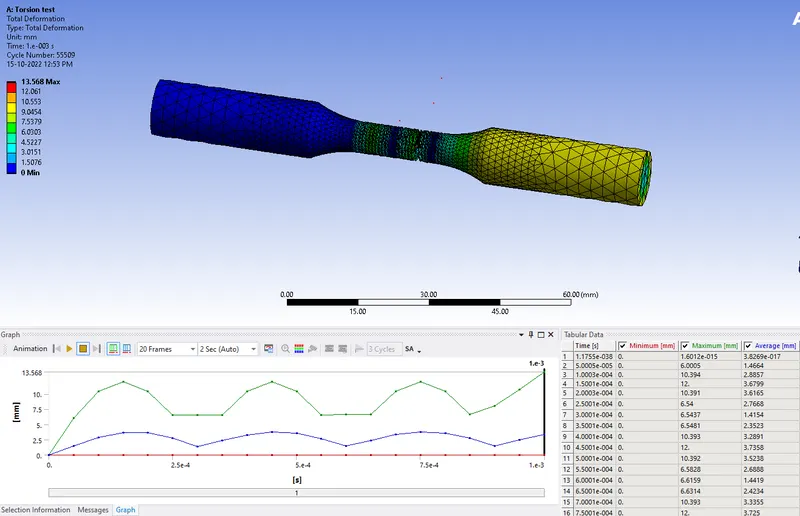
Fig.21 Total Deformation Contour Plot
The Equivalent (Von-Mises) Stress obtained from the analysis is shown below.
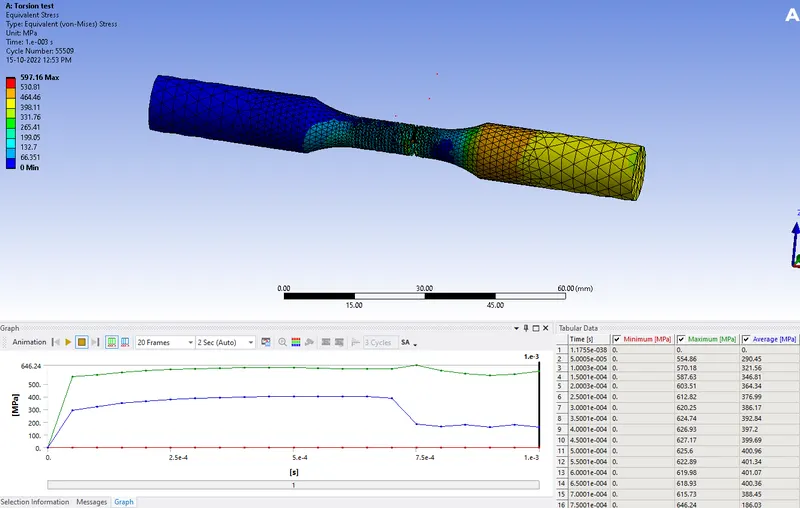
Fig.22 Equivalent Stress Contour Plot
The Temperature of the Specimen obtained from the analysis is shown below
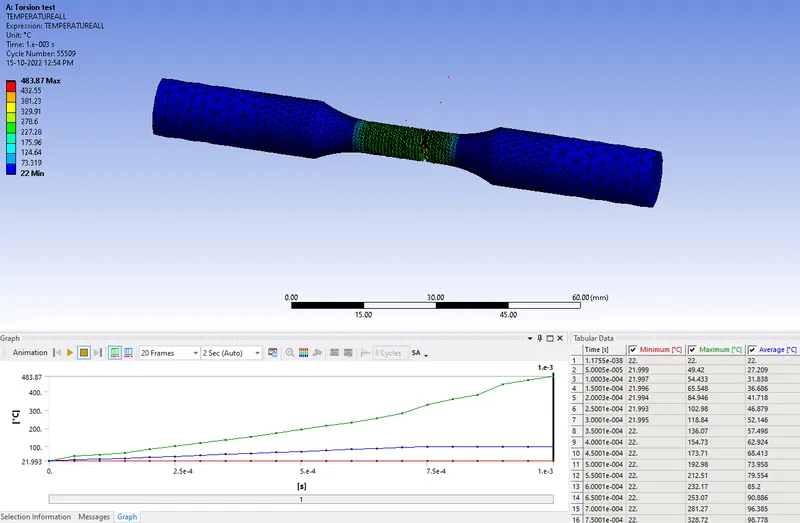
Fig.23 Specimen Temperature Contour Plot
The simulation was run and the results are tabulated below.
|
Output |
Tension Test |
Torsion Test |
|
Total Deformation Max. [mm] |
18.006 |
13.568 |
|
Equivalent Stress Max. [MPa] |
629.86 |
646.24 |
|
Temperature Max. [°C] |
267.25 |
483.47 |
CONCLUSION:
The analysis was run successfully and results were obtained and tabulated.
- The Maximum Deformation of the Specimen was 18.006 mm obtained in the TENSION TEST
- The Maximum Stress of the Specimen was 646.24 MPa obtained in the TORSION TEST
- The Maximum Temperature of the Specimen was 483.47°C obtained in the TORSION TEST
From both Tension and Torsion Tests, it was observed that Stress and Temperature are higher in Torsion Test due to twisting or rotating Load, while the Deformation is lesser in Torsion Test.