Week 9 - Senstivity Analysis Assignment
In this challenge, it is required to write a code that takes all the reactions from the GRI mechanism and calculates the 10 most sensitive reactions. The sensitivity parameter is considered with respect to the temperature. The program is going to show the reaction strings in the order of greatest sensitivity to the least sensitivity.
Introduction
As we know any combustion reaction consists of a number of intermediate chemical reactions and chemical species before complete combustion takes place which affects the entire reaction process. The bunch of such reaction can be called a reaction mechanism. Since there are many parameters involved in the chemistry of combustion, it is needed to understand the effects of each parameter on the system. One of the best technique is to analyze it by performing a sensitivity check for a given chemistry mechanism.
Sensitivity analysis is nothing but getting a relationship between the sensitivities of reaction and the parameters like temperature or in mathematical term it is the study of change of dependent variable with respect to the independent variable i.e. slope of the curve. The aim behind this sensitivity analysis process is to estimate the sensitivity for parameter which indirectly tells about ignition delay in the combustion process for intermediate reactions. In the analysis, the reaction with more sensitivity results in less ignition delay and by analyzing the behaviour of intermediate reactions we can regulate the mechanism reactions to tune the ignition delay.
As the combustion process is extremely complicated to model and also requires high computation cost and time to simulate the complete process accurately. In a combustion reaction, there are almost 325 intermediate reactions and 53 species as per GRI 3.0 mechanism. So it will become tremendously hectic and expensive to simulate each and every reaction. Hence to reduce the computational cost only a few reactions are taken into account while studying. To find these reactions we carry out sensitivity analysis. The reactions which highly affect parameters has maximum sensitivity and only those reactions are considered in the study.
Coding Methodology
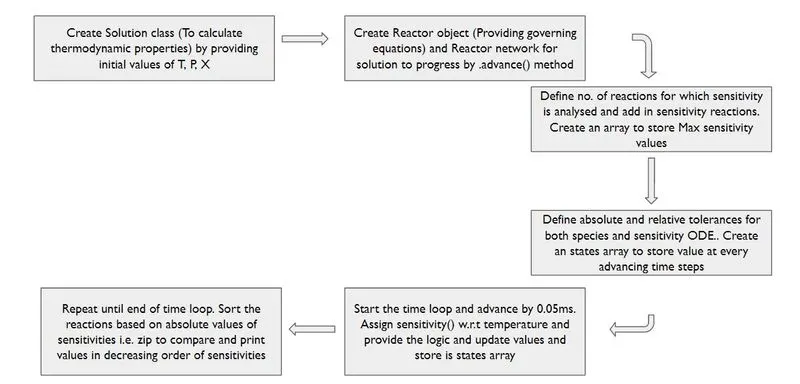
We create “gas" as an instance of the “Solution" class based on the mechanism from the “gri30.xml" file.
The initial conditions are given by, Initial temperature = T = 1500k , Initial temperature = P = 1atm.
Species concentrations as per methane’s stoichiometric combustion reaction which is given by,
`CH_4+2(O_2+3.76N_2)⇔CO2+2H_2O+7.52N_2`
The initial conditions are specified for the reactor (TPX) using 'gas.TPX' command.
We create an ideal gas constant pressure reactor 'r' from the 'gas' object.
A reactor network 'sim' from the 'r' instance is created.
Consider the number of reaction to take into account from the GRI 3.0 mechanism using the 'gas.n_reactions' command.
We extract the reactions from 'r' and add them to the 'reac_n' array for the sensitivity analysis using for loop.
Set the relative and absolute tolerance of the reactor solver to 10−6 and 10-15
Set the relative and absolute tolerance of the sensitivity solver to 10−6 and 10-6
Create a solution array called 'states' to store the thermodynamic state of 'gas' at every time-step.
Create a time domain for simulation. The time domain is 0 to 2 milliseconds and with 5 micro-second timestep size.
Then advance time to get results at various time steps i.e. at various states using 'sim.advance(time)' command.
We use 'for loop' inside 'time advancement loop’ to obtain sensitivities for each reaction at that time step using 'sim.sensitivity('temperature',i)' command.
Use ‘if loop’ to get maximum sensitivity values inside ‘space – for loop’
Append states object to store values.
Take absolute values of sensitivities to compare the most sensitive reactions.
Use the 'sorted' and 'zip' function appropriately to sort and find out the most sensitive reactions with their sensitivities.
Add comments for post-processing and visualization.
Python Code
'''
Code to compute sensitivities of reactions in GRI 3 mechanisms

'''

import cantera as ct
import numpy as np
import matplotlib.pyplot as plt

#Creating gas object with solution class
gas = ct.Solution('gri30.xml')

# Reactor initial conditions
T = 1500
P = ct.one_atm


# Providing initial values to gas object
gas.TPX = T, P, {'CH4':1,'O2':2,'N2':7.52}

# Consider constant pressure ideal gas reactor
r = ct.IdealGasConstPressureReactor(gas,name='R1')

# Preapare reactornetwork
sim = ct.ReactorNet([r])

# Number of gas reaction to be consider
n = gas.n_reactions


# Reaction array
reac_n = []

# Maximum sensitivity array
s_max =[0]*n

# Loop for appending reaction
for i in range(n):

	# Adding sensitivity reactions
	r.add_sensitivity_reaction(i)
	reac_n.append(gas.reaction_equations([i]))

# Providing tolerences for numerical calculations
sim.rtol = 1e-6
sim.atol = 1e-15

sim.rtol_sensitivity = 1e-6
sim.atol_sensitivity = 1e-6

# Creating solution array for storing each state data
states = ct.SolutionArray(gas, extra = ['t_ms'])


# Time array
time = np.arange(0,2e-3,5e-6)

# Time loop
for t in time:

	# Advancing time
	sim.advance(t)

	# Loop for various reactions sensitivity
	for i in range(n):
		s = sim.sensitivity('temperature',i)

		if np.abs(s_max[i]) <= np.abs(s):
			s_max[i] = s

	states.append(r.thermo.state, t_ms = t*1e3)

# Loop for printing all reaction with their sensitivities
for i in range(n):
	print('For reaction '+str(reac_n[i])+' sensitivity is '+str(s_max[i]))

# Number of reactions required to show in plot
N = 10
# Absolute values of sensitivities
s_abs = np.abs(s_max)

# Sorting logic using zip function
reac_n = [p for q, p in sorted(zip(s_abs,reac_n), reverse = True)]
s_max = [p for q, p in sorted(zip(s_abs,s_max), reverse = True)]

# Array to store top N sensitive reactions
max_reactions = reac_n[0:N]
# Array to store top N sensitivities
max_sensitivity = s_max[0:N]

# Loop to print top N sensitive reactions with their sensitivities
print('nTop '+str(N)+' maximum sensitive reactions in GRI3 mechanism in first '+str(n)+' reactions are as follows:')
for i in range(N):
	print('For reaction '+str(max_reactions[i])+' sensitivity is '+str(max_sensitivity[i]))

# Plotting
plt.figure(1)
plt.subplot(2,3,1)
plt.plot(states.t_ms,states.T)
plt.grid()
plt.xlabel('Time (ms)')
plt.ylabel('Temperature (K)')
plt.subplot(2,3,2)
plt.plot(states.t_ms,states('OH').X)
plt.grid()
plt.xlabel('Time (ms)')
plt.ylabel('OH Mole Fraction')
plt.subplot(2,3,3)
plt.plot(states.t_ms,states('H').X)
plt.grid()
plt.xlabel('Time (ms)')
plt.ylabel('H Mole Fraction')
plt.subplot(2,3,4)
plt.plot(states.t_ms,states('CH4').X)
plt.grid()
plt.xlabel('Time (ms)')
plt.ylabel('$CH_4$ Mole Fraction')
plt.subplot(2,3,5)
plt.plot(states.t_ms,states('N2').X)
plt.grid()
plt.xlabel('Time (ms)')
plt.ylabel('$N_2$ Mole Fraction')
plt.subplot(2,3,6)
plt.plot(states.t_ms,states('CO2').X)
plt.grid()
plt.xlabel('Time (ms)')
plt.ylabel('$CO_2$ Mole Fraction')
plt.suptitle("Sensitivities of various species")
plt.tight_layout()

plt.figure(2)
plt.gca().invert_yaxis()
plt.barh(range(N), max_sensitivity)
plt.yticks(range(N),max_reactions)
plt.grid()
plt.ylabel('Chemical Reactions')
plt.xlabel('Temperature Sensitivity')
plt.suptitle('Top '+str(N)+' reactions with higher sensitivities')
plt.tight_layout()
plt.show()
Results and Discussion
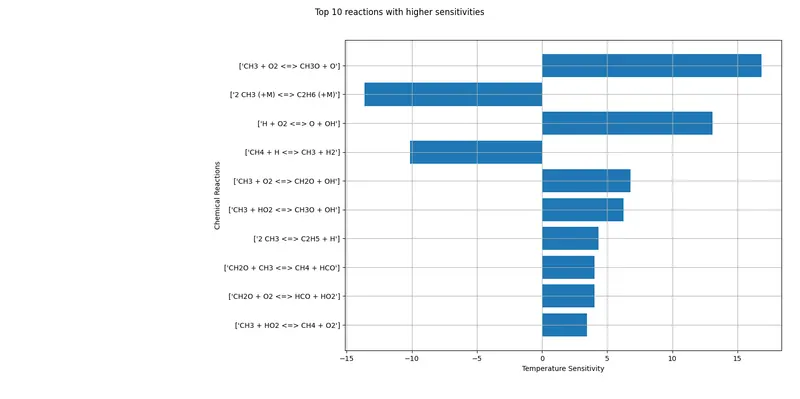
The above plot gives the most temperature-sensitive 10 reactions. It can be seen that the sensitivity has both positive and negative values. The positive sensitivity implies that if the temperature is increased the reaction rate increases for that particular reaction. For negative sensitivity, if the temperature increases the reaction rate decreases.
By increasing the sensitivities of second and fourth reactions, the ignition delay will be increased. While increasing the sensitivities of the rest of the reactions will lead to a decrease in ignition delay.
The positive sensitivity coefficient of a certain reaction indicates if that reaction rate is increased there is a greater rise in temperature value i.e. time taken to achieve ‘`T_("init")`+ 400 K’ is lowered. So, the ignition delay time period can be lowered.
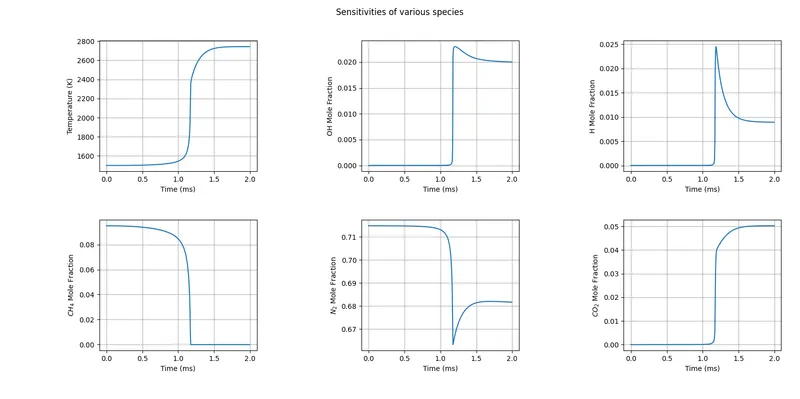
The above plots show the mole fractions of various species. The temperature is seen rising from 1500 K to 2775 K at 1.15 ms. This shows that the mixture is auto ignited. The `CH_4` concentration was seen lowering down to 0, indicating that all fuel was spent. The `N_2`mole fraction is seen to lower down and then rising up very little, indicating the formation of NOx. The other species variations are also seen in the figure.
Conclusions
The sensitivity analysis is essential in optimizing the performance of IC engines, especially the CI engines where the combustion process is initiated by the auto-ignition of charge. In such types of the combustion process, the auto-ignition delay needs to precisely controlled with the movement of the piston to obtain optimum efficiency. Here, the most sensitive reactions are determined and the reaction rates are altered to get the desired ignition delay.
The sensitivity indicates the influence of the reaction on the output parameter such as temperature or molar fraction of species. The positive sensitivity indicates that increase in temperature which results in ignition delay. And on another side to increase ignition delay, the reactions with negative sensitivity are considered.
The code is generated for computing sensitivities and it is parameterized for 'N' which is the number of reactions with maximum sensitivities.