Week 9 - Senstivity Analysis Assignment
AIM:
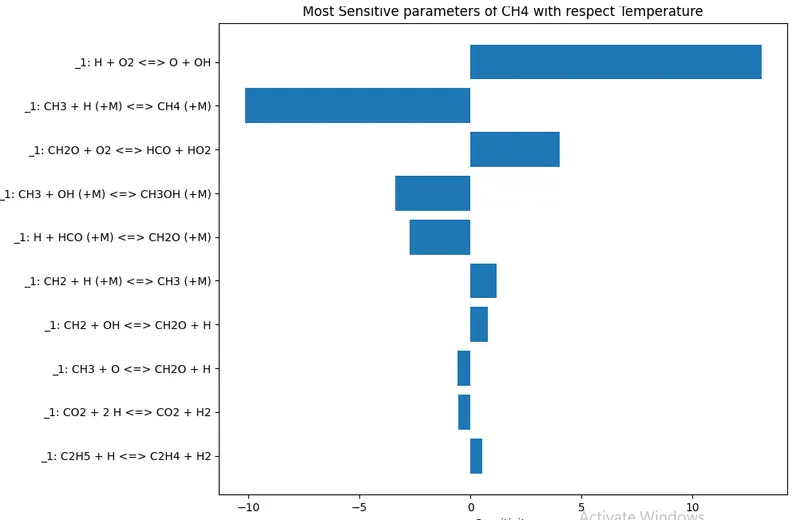
To write a code that takes all the reactions from the GRI mechanism and calculates 10 most sensitive reactions by making sensitivity parameter with respect to the Temperature.
To show the reaction strings in the order of greatest sensitivity to the least sensitivity.
Introduction:
Sensitivity Analysis:
Sensitivity Analysis nothing but is a set of processes to get a relationship between the parameters and the output model. The main aim of this process to calculate the ignition delay in the combustion and sensitivity analysis with respect to temperature tells which reaction cause more sensitivity ignition delay and we can adjust the mechanism reaction tuning.
Initial Conditions:
Temperature = 1500
Pressure = 1atm
CODE:
"""
Sensitivity Analysis
"""
import sys
import numpy as np
import cantera as ct
import matplotlib.pyplot as plt

gas = ct.Solution('gri30.xml')
T = 1500
P = ct.one_atm

gas.TPX = T,P, 'CH4:1,O2:2,N2:7.52'
r = ct.IdealGasConstPressureReactor(gas)
sim = ct.ReactorNet([r])

n = 325
N = 10
# Enable sensitivity analysis with respect to the temperature of the first 10.
for i in range(n):
	r.add_sensitivity_reaction(i)

# Set the tolerances for the solution and for the sensitivity coefficients
sim.rtol = 1e-6   # Relative change in solution should be less than this number
sim.atol = 1e-15  # Absolute change in solution should be less than this number

sim.rtol_sensitivity = 1e-6   # Relative change in solution should be less than this number
sim.atol_sensitivity = 1e-15  # Absolute change in solution should be less than this number

s_max = [0]*n
states = ct.SolutionArray(gas, extra=['time_in_ms','t'])
for t in np.arange(0,2e-3,5e-6):
	sim.advance(t)

	for j in range(n):
		s = sim.sensitivity('temperature', j)
		states.append(r.thermo.state,time_in_ms = t*1000,t=t)
		print('%10.3e %10.3f %10.3f %14.6e' % (sim.time,r.T,r.thermo.P,r.thermo.u))
		if np.abs(s)>=np.abs(s_max[j]):
			s_max[j] = s

s_plot = []
s = np.zeros((N))

for m in range(N):
	maximum = np.max(s_max)
	minimum = np.min(s_max)

	if np.abs(maximum)>np.abs(minimum):
		s[m] = maximum
		Reaction_index = s_max.index(maximum)
		s_plot.append(sim.sensitivity_parameter_name(Reaction_index))
		print('%0.3s %10.3f'%(s_plot,maximum))
		s_max.remove(maximum)

	else:
		s[m] = minimum
		Reaction_index = s_max.index(minimum)
		s_plot.append(sim.sensitivity_parameter_name(Reaction_index))
		print('%0.3s %10.3f'%(s_plot,minimum))
		s_max.remove(minimum)

for k in range(N):
	s_plot[k] = s_plot[k].replace('IdealGasConstPressureReactor','')

reactions = list(reversed(s_plot))
sensitivity = list(reversed(s))

plt.subplot(4,1,1)
plt.plot(states.t,states.T)
plt.xlabel('Simulation Time')
plt.ylabel('Temperature')

plt.subplot(4,1,2)
plt.plot(states.t,states('OH').X)
plt.xlabel('Simulation Time')
plt.ylabel('OH Mole Fraction')

plt.subplot(4,1,3)
plt.plot(states.t,states('O2').X)
plt.xlabel('Simulation Time')
plt.ylabel('O2 Mole Fraction')

plt.subplot(4,1,4)
plt.plot(states.t,states('CH4').X)
plt.xlabel('Simulation Time')
plt.ylabel('CH4 Mole Fraction')

plt.figure(2)
plt.barh(reactions,sensitivity)
plt.tight_layout()
plt.xlabel('Sensitivity')
plt.title('Most Sensitive parameters of CH4 with respect Temperature')
plt.show()
Results:
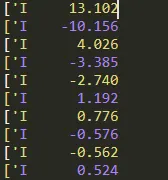
The below graph shows the reactions and temperature sensitivity analysys of 10 most sensitive reactions with respect to temperature.
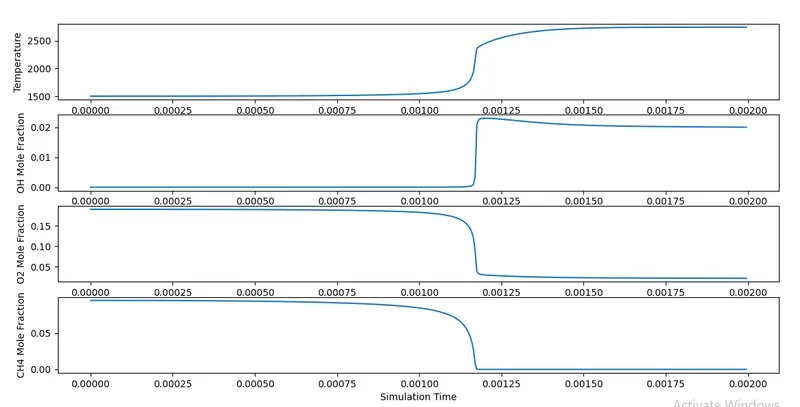
The below graphs shows the behaviour of Temperature and mole fractions of OH, O2, CH4 with respect to simulation time from where we can calculate combustion and ignition values.