Week 9 - Parametric study on Gate valve.
Aim: To perform a parametric study on the gate valve simulation and post-process the results.
Objectives:
1. To perform the simulation for diferrent gate valve opening (10% to 80%).
2. To investigate mass flow rate for each of the cases.
3. To calculate the flow coefficient and flow factor for each opening.
4. To understand and discuss the results obtained.
Introduction:
In this project the intend is to perform a steady state simulation for a gate valve problem. Gate valve is a flow control device which is used to adjust mass flow rate in a pipe flow. It is also known as sluice valve. It is a valve that opens by lifting a barrier (gate) out of the path of the fluid. The lifting of barrier adjusts the flow rate at the outlet.
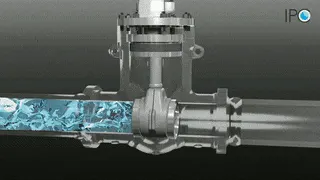
Working of gate valve
The simulation for different openings of gate valve can be done separately, however it would consume extensive analysis time. To set-up same simulation repetatively for a single different input condition is not the ideal way. In order to avoid this, parametric analysis is used in ANSYS Fluent which can be used to simulate all the cases with little work. The varying parameter in this case is the lift of the gate valve which can be set as "input parameter" and mass flow rate at the outlet can be set as "output parameter". This reduces monotonous work and calculates desired output for different cases.
Moreover, the flow coeffcient and flow factor can be calculated using output parameters (mass flow rate and pressure drop) assigned for each case.
Theory:
A] Flow coefficient (Cv):
- Flow coefficient of a device is a relative measure of the efficiency to allow the fluid flow.
- It describes the relationship between the pressure drop across an orifice valve or other assembly and the corresponding flow rate.
- It is also called as flow capacity rating of the valve.
- Mathematically flow coefficient can be given as,
`Cv = Q(sqrt (SG)/(nablap))`
where, Cv = Flow coefficient (US gallons/min)
Q = Flow rate (US gallons/min)
SG = Specific gravity of the fluid.
`nablap` = Pressure drop (Psi)
- In more practical terms, the flow coefficient (Cv) is the volume (in US gallons) of water at `60^0F` that will flow per minute through a valve with a pressure drop of 1Psi across the valve.
- The use of flow coeffcient offers a standard method of comparing valve capacities and sizing valves for specific applications that is widely accepted by industry.
B] Flow Factor (Kv):
- The metric equivalent is called as flow factor (Kv).
- Flow factor can be given as,
`Kv = Q(sqrt(SG)/(nablap))`
where, Kv = Flow factor (`(m^3)/(hr)`)
Q = Flow rate (`(m^3)/(hr)`)
SG = Specific gravity of the fluid.
`nablap` = Pressure drop (bar)
- Flow factor (Kv) can be calculated from flow coefficient (Cv) using the equation,
`Kv = 0.865*Cv`
- The flow factor (Kv) inidcates "The water flow in (`(m^3)/(hr)`), at a pressure drop across the valve of `1(Kgf)/(cm^2)` when the valve is completely open.
Project Methodology:
Initially the gate valve geometry was imported in SpaceClaim and cad clean-up (removal of extra edges) was performed. Subsequently lift of the gate valve was set to be as parameter and volume was extracted. Then the geometry was updated in meshing module and the mesh was generated. The meshed geometry was imported into the Fluent set-up by defining initial conditions, boundary conditions, materials, selecting turbulence model, and activating gravity in the negative z-direction. The report definition of mass flow rate at the outlet was created and set as an output parameter for the simulation. After resulting converged solution, the design points were created in the "Parameters" tab for the varying lift of the gate valve from 20 % to 80 %. Subsequently after running each case the results were extracted (Mass flow rate at the outlet and Pressure drop) and were plotted against opening percentage of lifting of the gate valve.
I] Pre-processing:
A] Geometry:
The geometry was imported in "SpaceClaim" and visualized all the components in the gate valve assembly. Unwanted features like extra edges, short edges etc were cleaned off from the geometry.
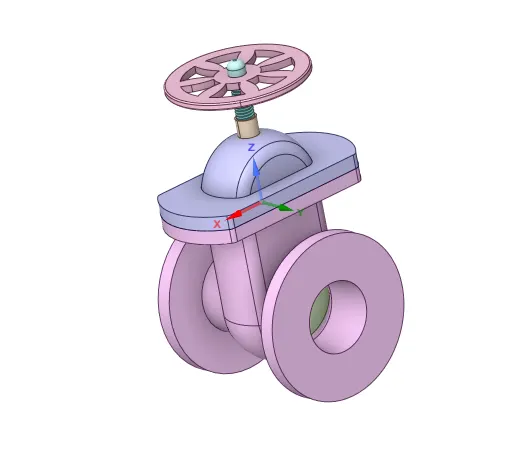
a) Nomenclature:
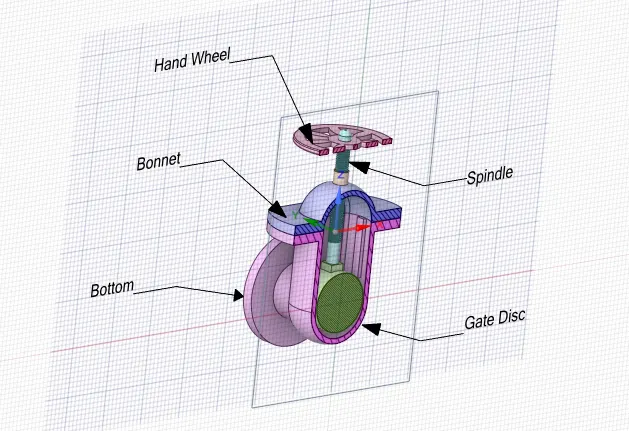
b) Bottom Elongation:
The bottom inlet and outlet pipes were elongated using "Pull" tool to have sufficient length for the fluid flow. Outlet section was intently kept long to have a fully developed region which will be free from flow characteristics fluctuations.
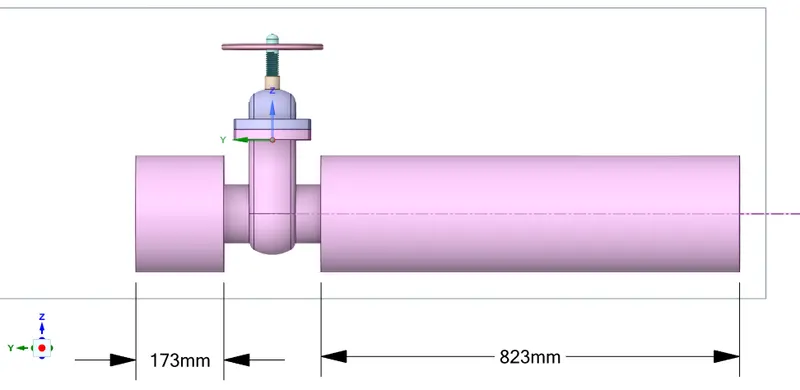
c) Lifting the Gate Disc:
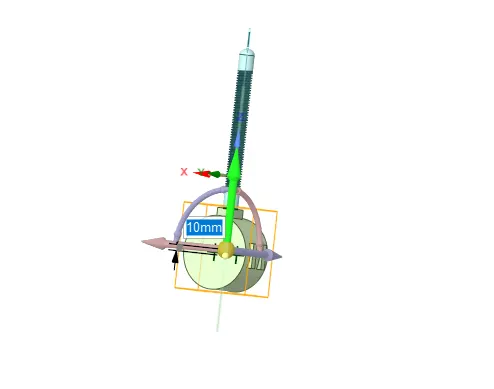
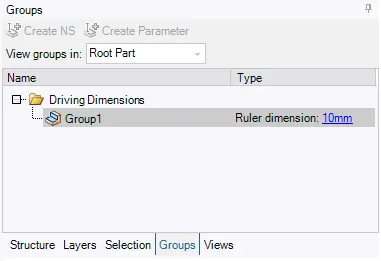
In order to lift the gate disc all the components except spindle and gate disc were selected to hide for convenience. Using "Move" tool the gate disc component was selected by choosing upward direction and was lifted by 10 mm. In groups "Create Parameter" tab was selected and parameter group got created with ruler dimension of 10 mm. So this lifting movement of the gate disc is parameterized and can be varied for all the cases in the "Parameters" tab in the Workbench window.
d) Volume Extraction:
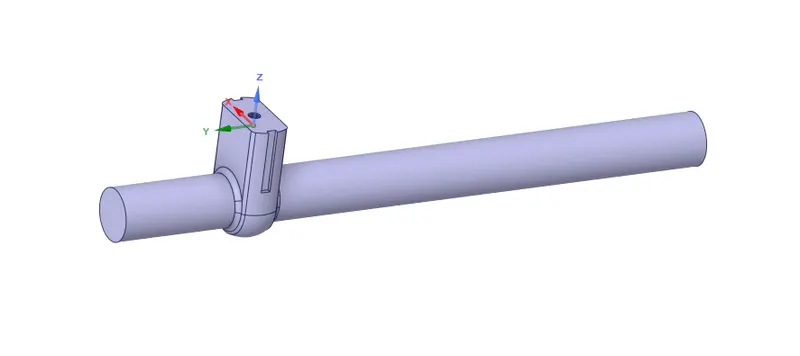
Volume has been extracted using "Volume Extract" tool. As the lift of gate disc is parameterized, volume will automatically get updated as per the case in SpaceClaim.
B] Named Selections:
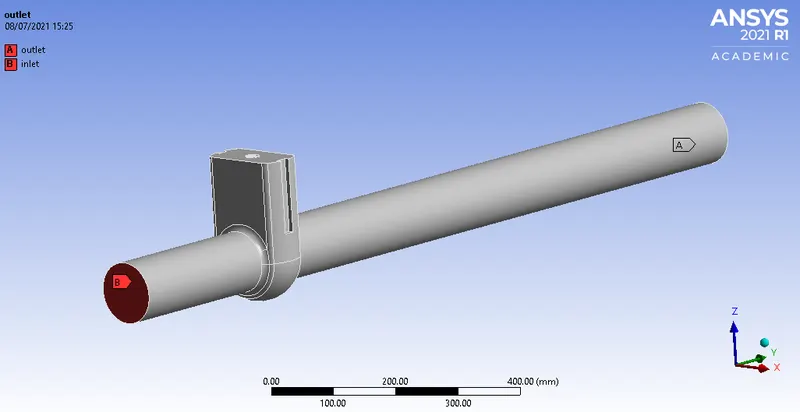
The red colored patches are assigned as an inlet and outlet. This facilitates to define the boundary condition into the Fluent solver while setting up the numerical case.
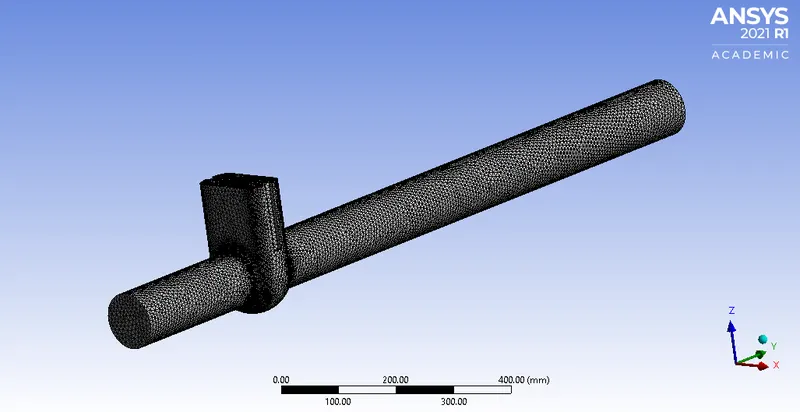
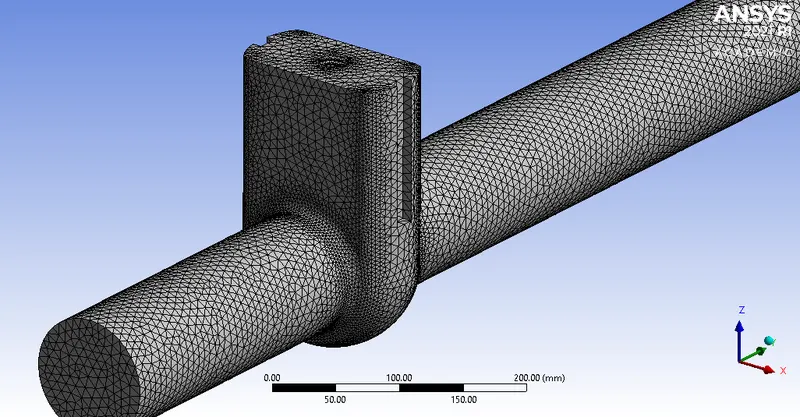
C] Mesh Details:
| Mesh Type | Unstructured mesh (Tetrahedrons) |
| Element Size | 8 mm |
| Maximum Element Size | 10 mm |
| Nodes | 46,418 |
| Elements | 2,27,027 |
D] Mesh:
E) Magnified View:
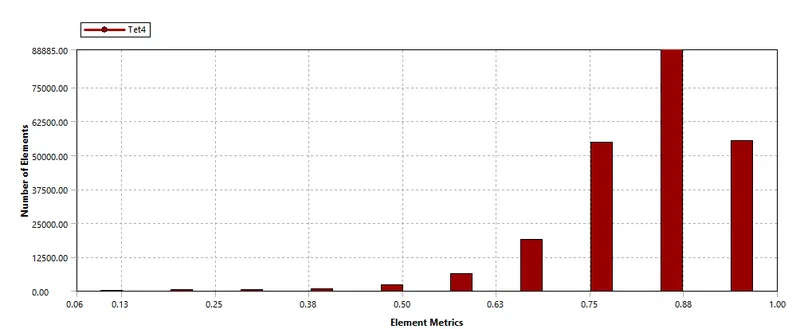
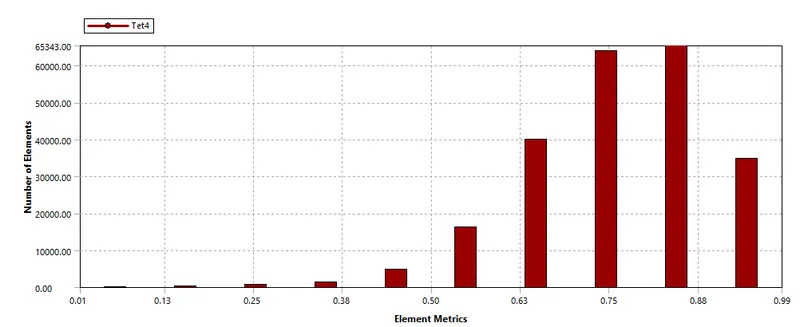
F] Mesh Metric:
1) Element Quality:
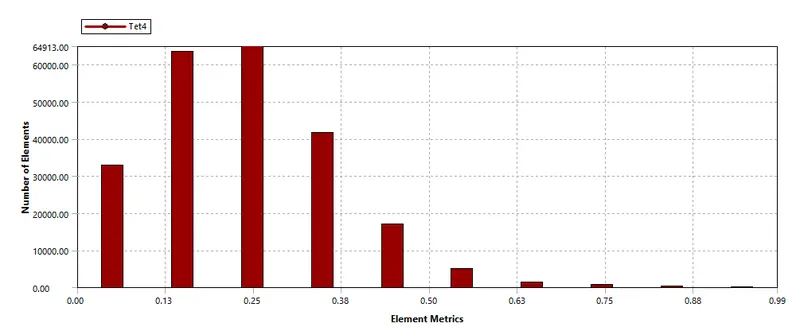
2) Skewness:
3) Orthogonal Quality:
II] Processing:
Procedure:
Initially the numerical case set-up was simulated for 10 mm lift of the gate valve.
1. Solver: Pressure-based solver
2. Type of simulation: Steady state simulation.
3. Enabled gravity in negative z-direction.
4. Turbulence model: K-epsilon (Realizable) with scalable wall functions.
5. Fluid material: Water
6. Boundary conditions:
6.1. Inlet: Pressure inlet (Gauge total pressure = 10 Pa)
6.2. Outlet: Pressure outlet (Gauge pressure = 0 Pa)
6.3. Walls: Stationary wall with no-slip condition.
7. Solution method for pressure-velocity coupling: Coupled
8. Report definitions: Flux report for mass flow rate at the outlet and select "create an output parameter" to get mass flow rate output for all the cases in the parametric study.
9. Initialization: Standard initialization
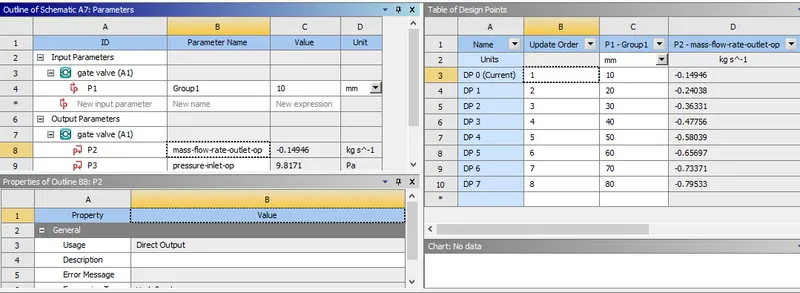
After getting the results, created design points for different opening percentage in the "Parameters" tab. In order to get the results for all the specified design points, selected "update the selected design point" individually. To view the calculated results for a desired design point, selected "set as current" and results were post-processed in the Fluent project.
Parameters Tab:
III] Post-processing:
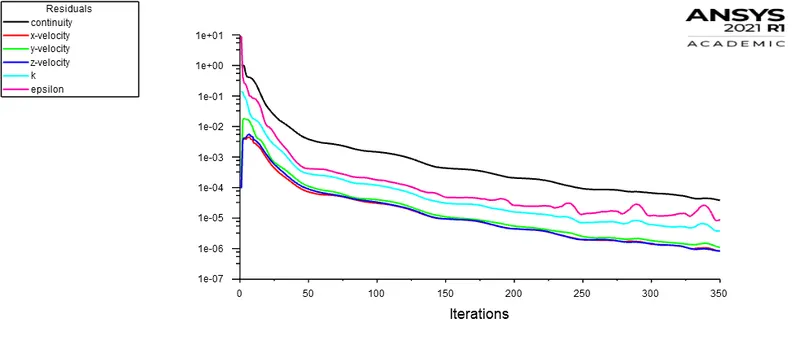
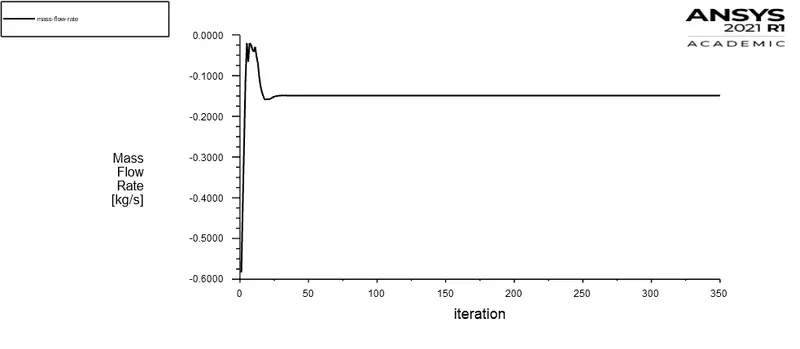
A] 10 % Opening;
1. Residuals:
2. Mass Flow Rate:
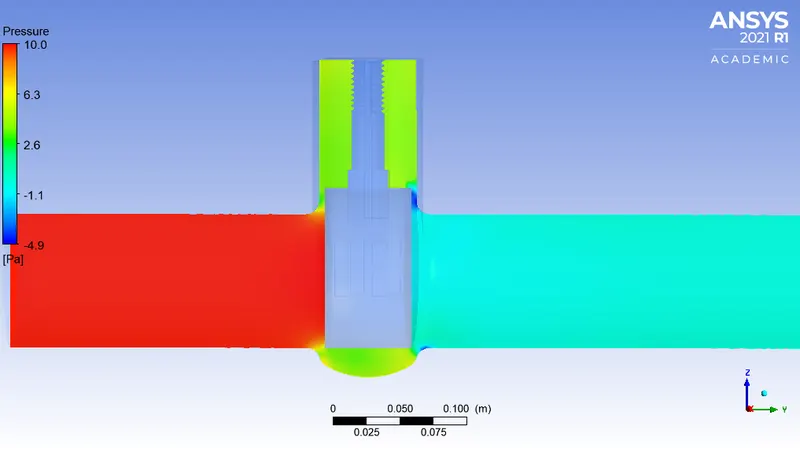
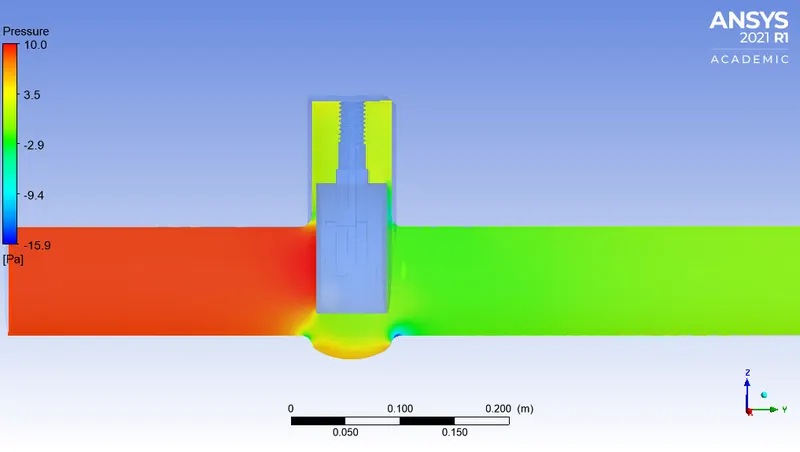
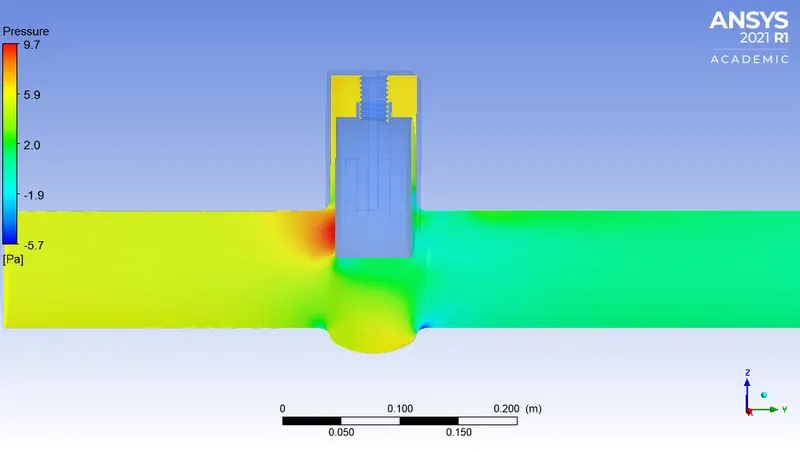
3. Pressure Contour:
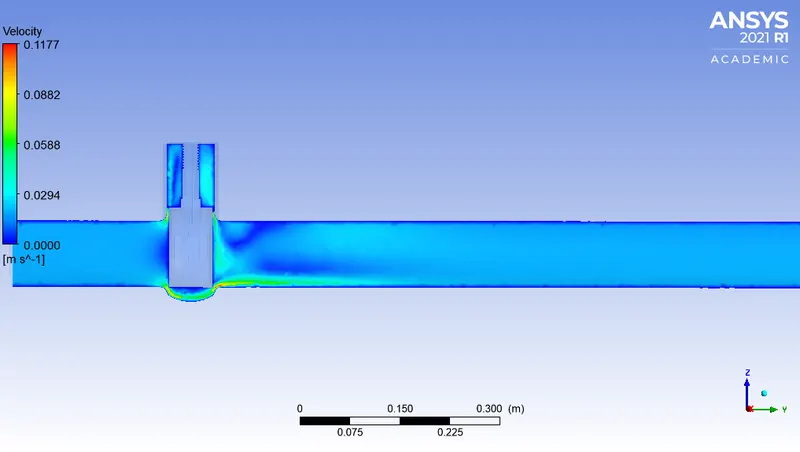
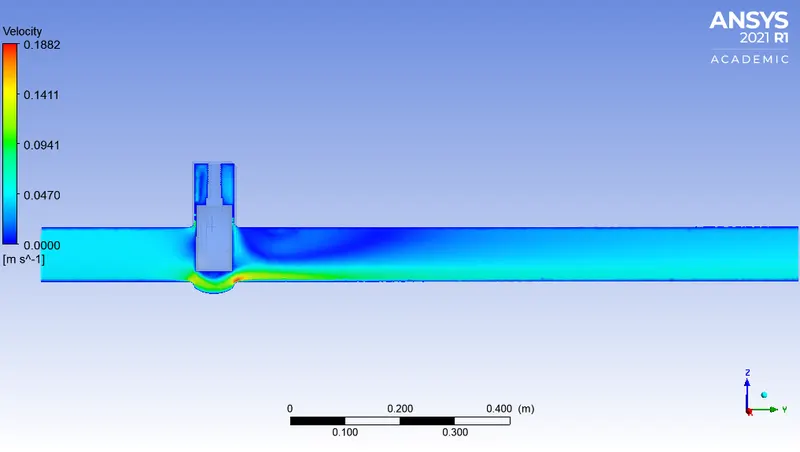
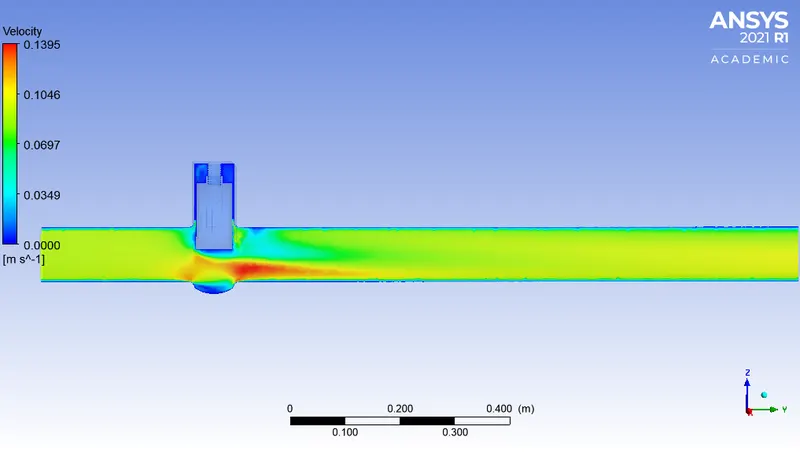
4. Velocity Contour:
B] 20 % Opening:
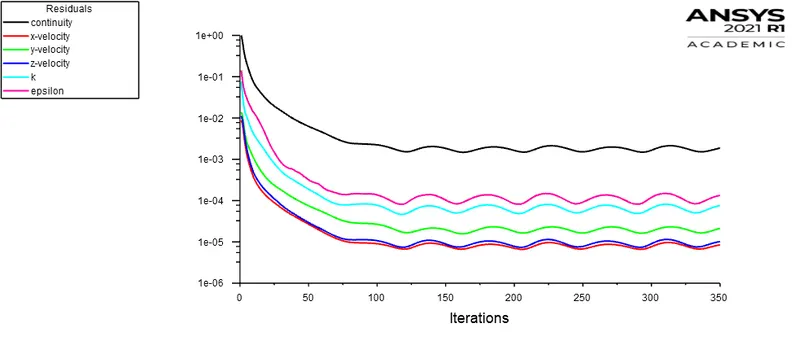
1. Residuals:
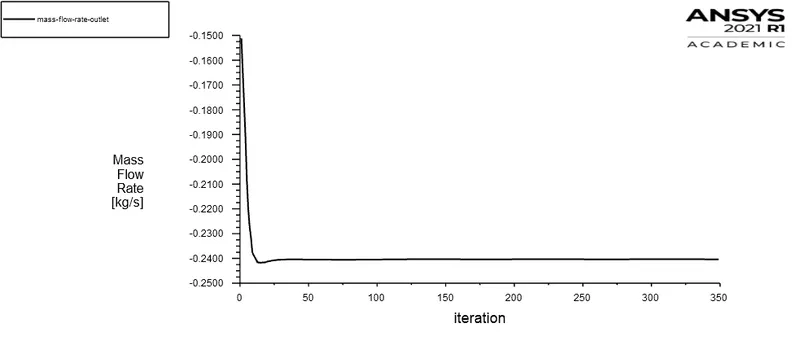
2. Mass Flow Rate:
3. Pressure Contour:
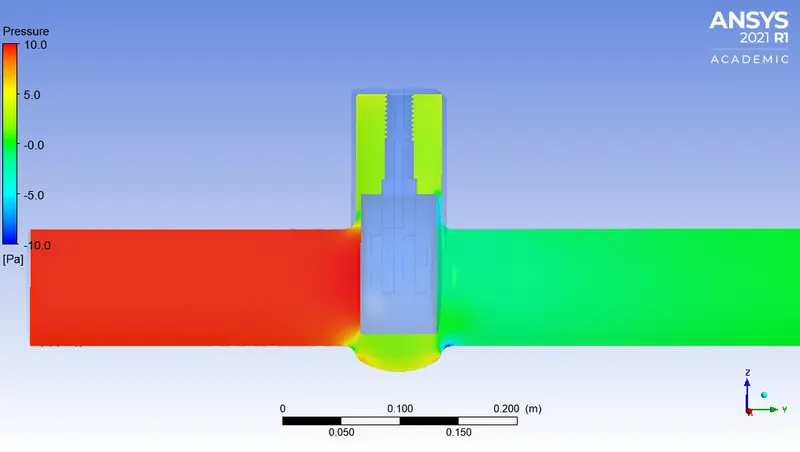
4. Velocity Contour:
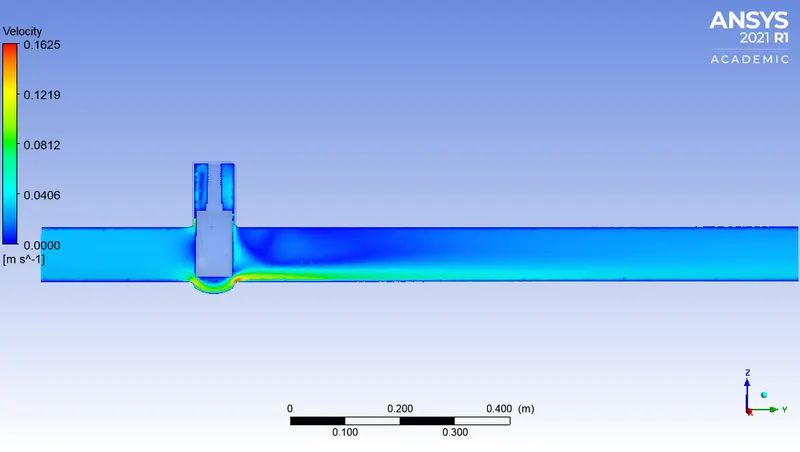
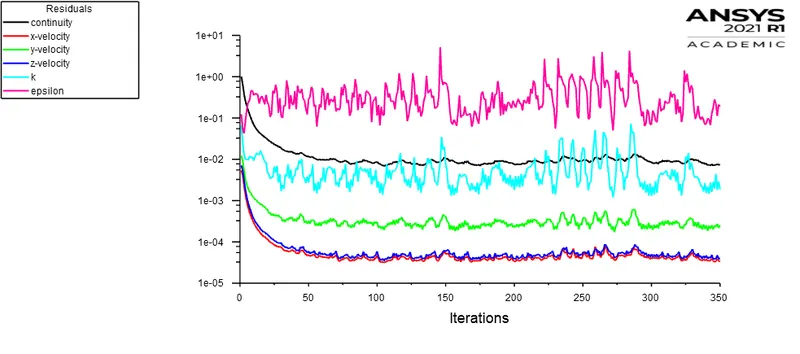
C] 30 % Opening:
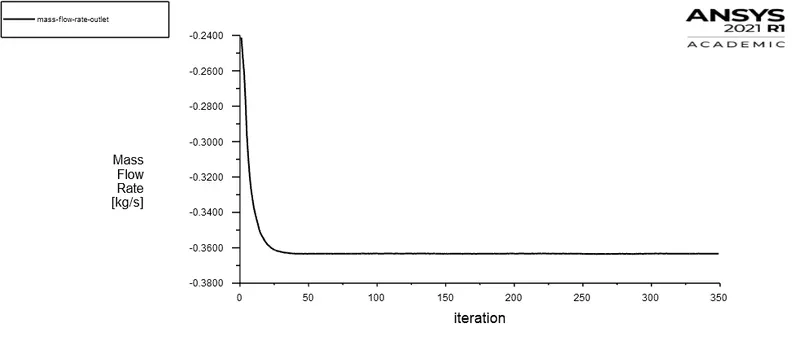
1. Residuals:
2. Mass Flow Rate:
3. Pressure Contour:
4. Velocity Contour:
D] 40 % Opening:
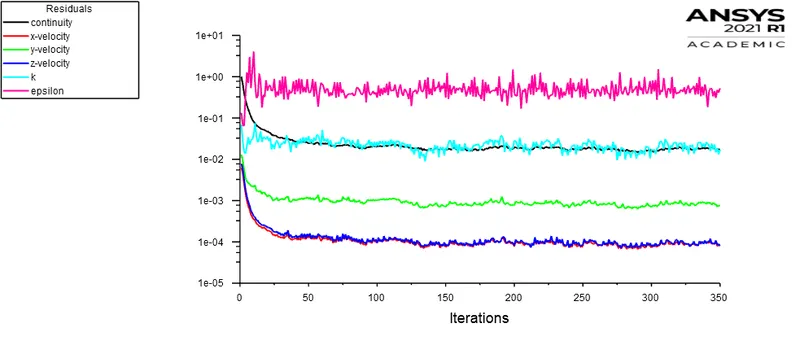
1. Residuals:
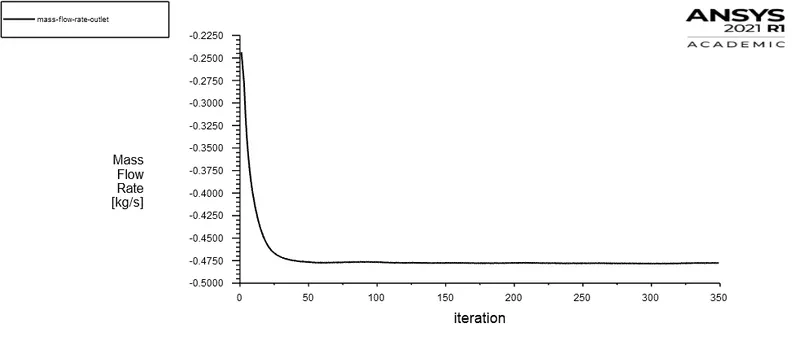
2. Mass Flow Rate:
3. Pressure Contour:
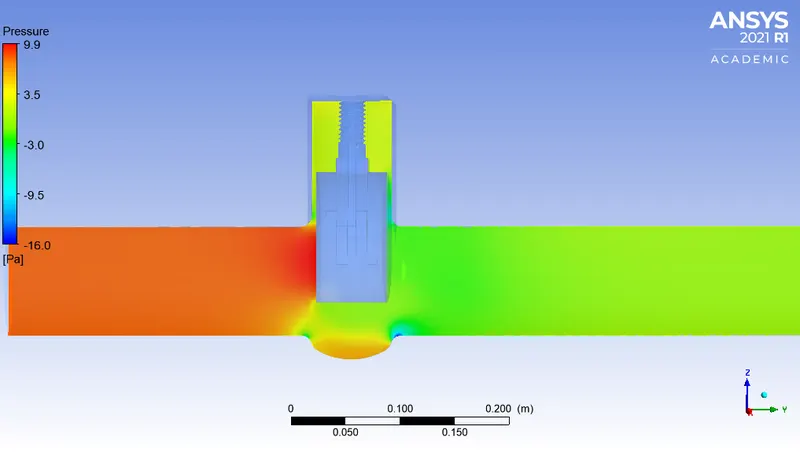
4. Velocity Contour:
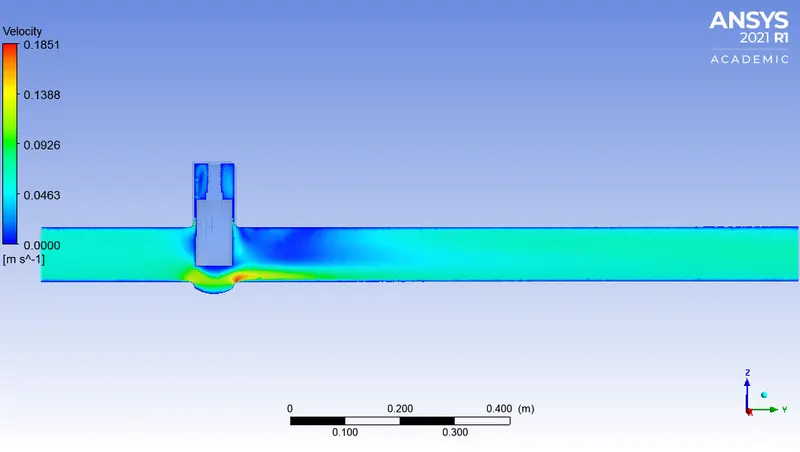
E] 50 % Opening:
1. Residuals:
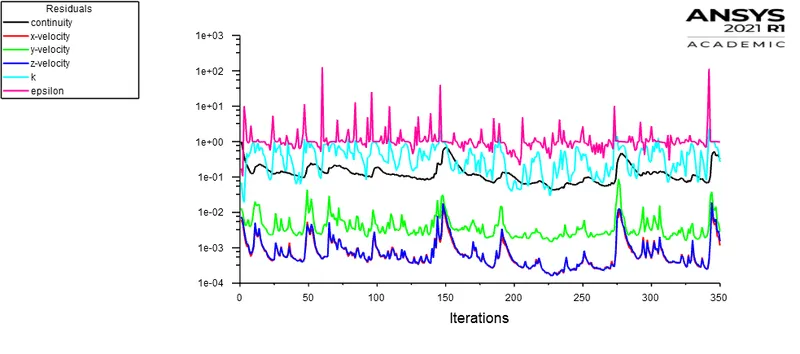
2. Mass Flow Rate:
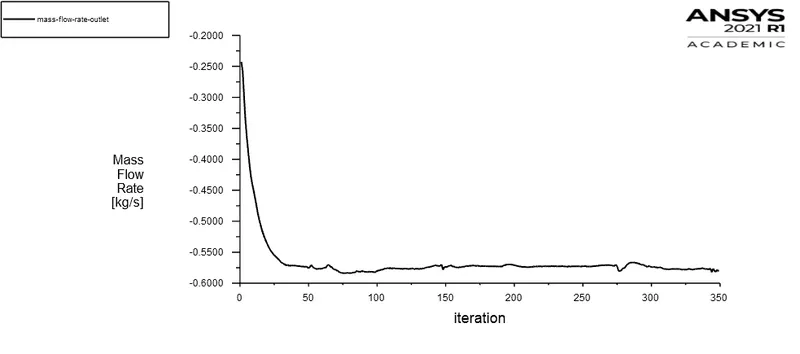
3. Pressure Contour:
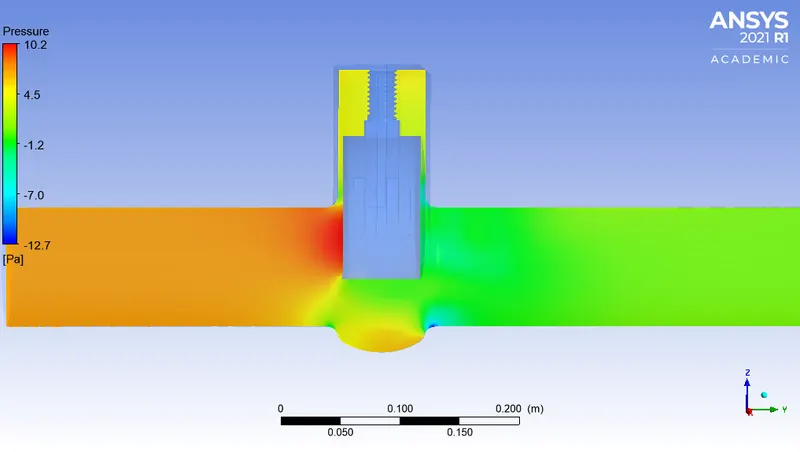
4. Velocity Contour:
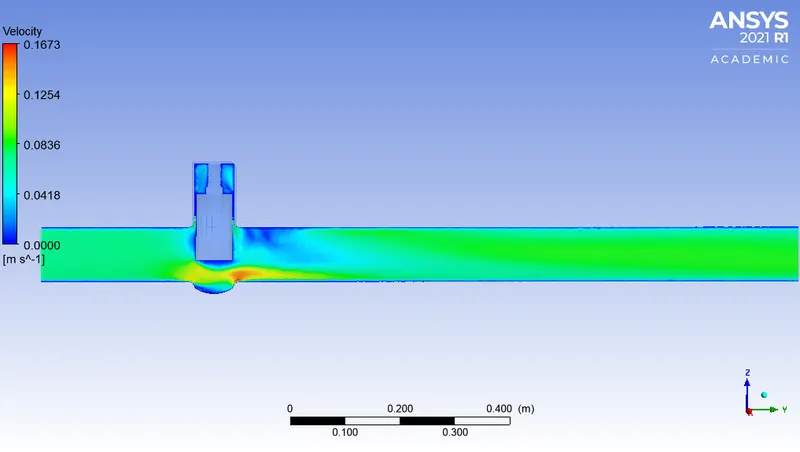
F] 60 % Opening:
1. Residuals:
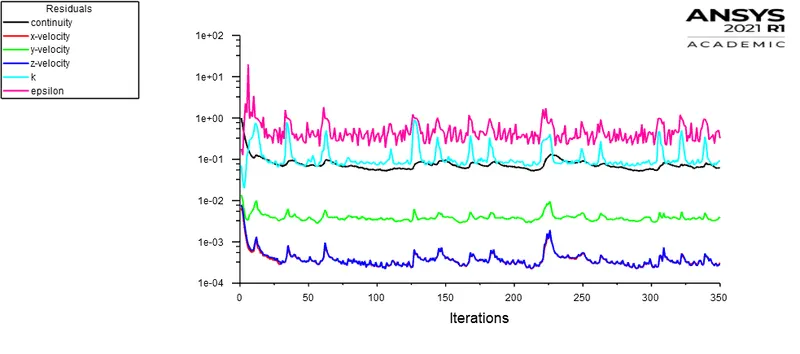
2. Mass Flow Rate:
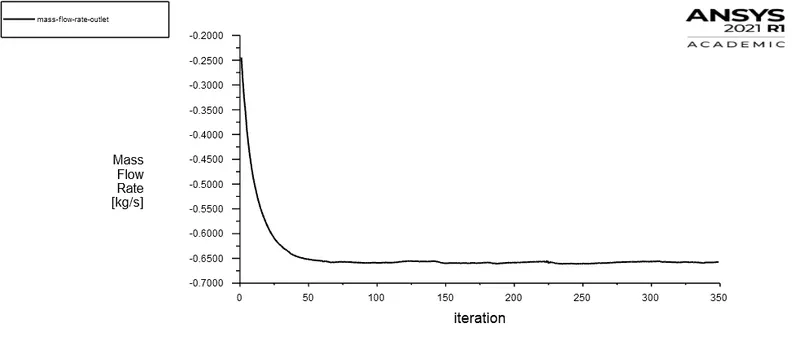
3. Pressure Contour:
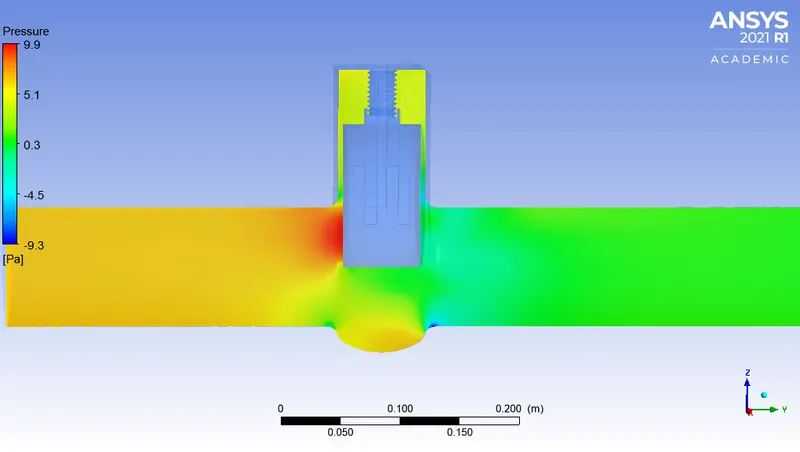
4. Velocity Contour:
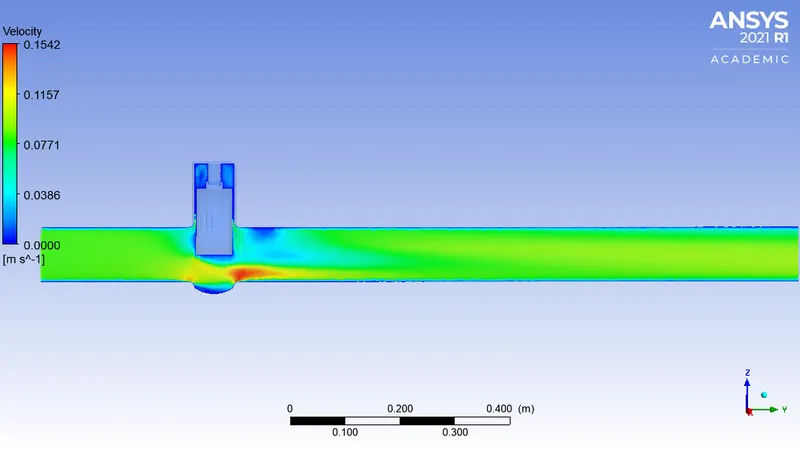
G] 70 % Opening:
1. Residuals:
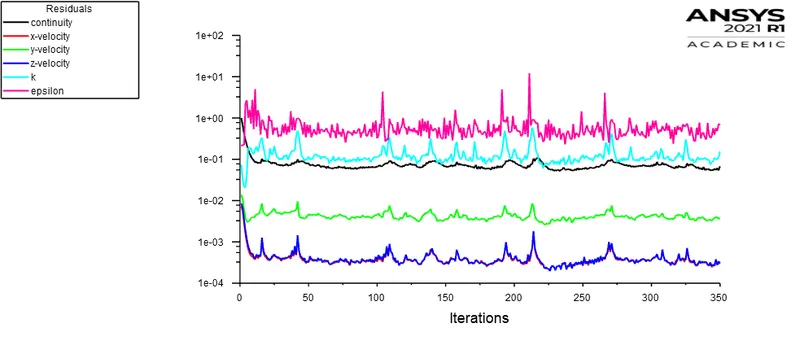
2. Mass Flow Rate:
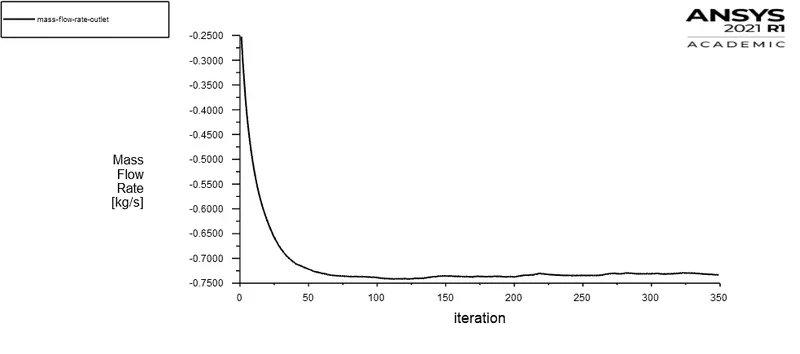
3. Pressure Contour:
4. Velocity Contour:
H] 80 % Opening:
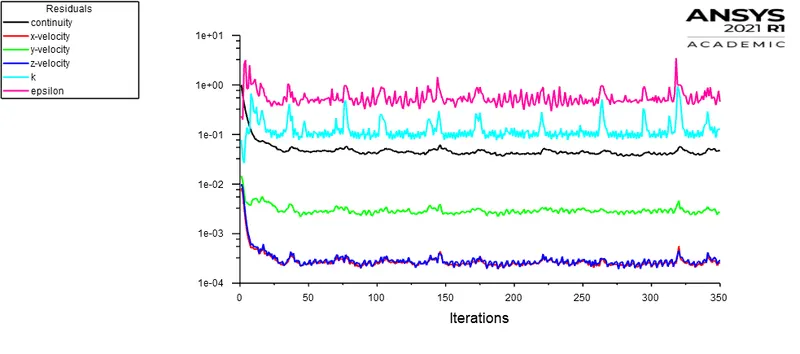
1. Residuals:
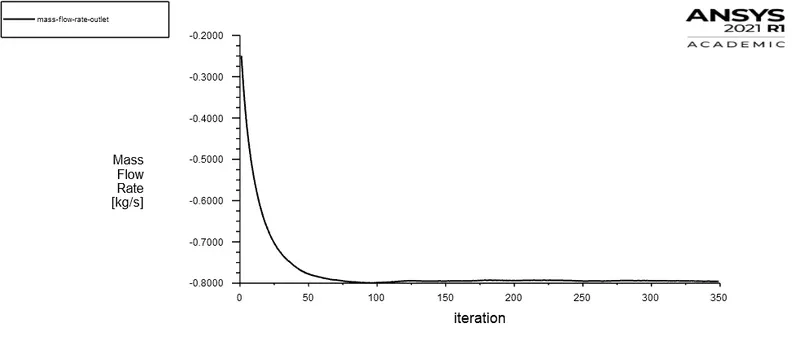
2. Mass Flow Rate:
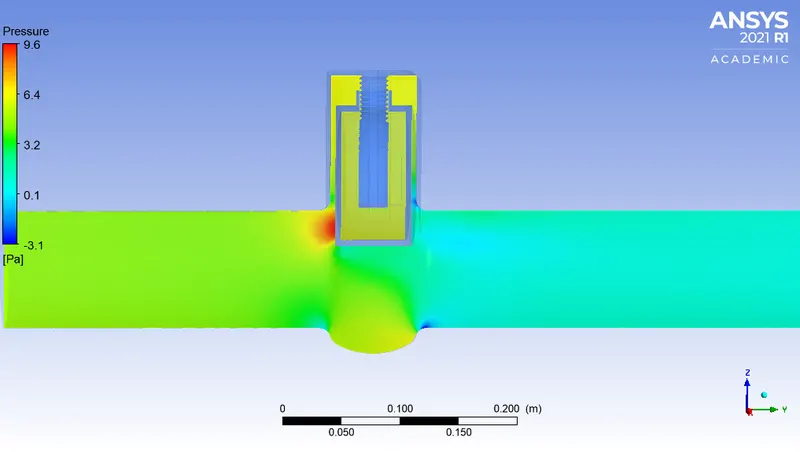
3. Pressure Contour:
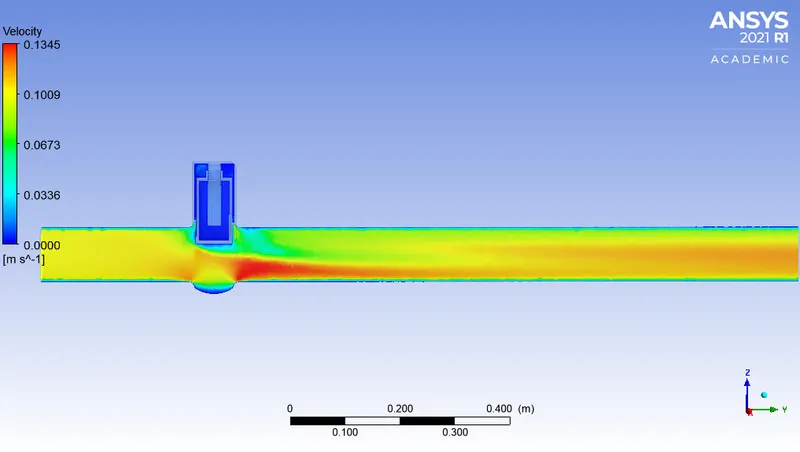
4. Velocity Contour:
Observation Table:
|
Lift of the Gate Valve (mm) |
Mass Flow Rate (Kg/s) |
Mass Flow Rate (US gallons/min) |
Pressure Drop (Pa) |
Pressure Drop (Psi) |
Flow coefficient (Cv) |
Flow Factor (Kv) |
| 10 | 0.14946 | 2.368941 | 9.8149567 | 0.001423489 | 62.78807732 | 54.31168688 |
| 20 | 0.24038 | 3.810023 | 9.5191195 | 0.001380583 | 102.5407152 | 88.69771867 |
| 30 | 0.36331 | 5.758463 | 8.9030663 | 0.001291235 | 160.2521814 | 138.6181369 |
| 40 | 0.47756 | 7.569326 | 8.1047713 | 0.001175456 | 220.7770688 | 190.9721645 |
| 50 | 0.58039 | 9.1991810 | 7.1850688 | 0.001042069 | 284.9711253 | 246.5000234 |
| 60 | 0.65697 | 10.412974 | 6.3931960 | 0.000927222 | 341.9660017 | 295.8005915 |
| 70 | 0.73371 | 11.629303 | 5.5282582 | 0.000801778 | 410.7018704 | 355.2571179 |
| 80 | 0.79533 | 12.605980 | 4.7195408 | 0.000684487 | 481.8300632 | 416.7830047 |
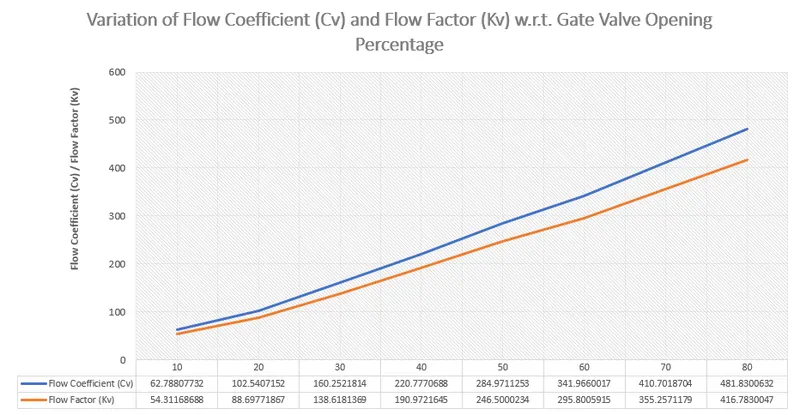
Graph:
Technical Discussion:
The obtained results in this study are intuitive and obey appropriate physics. The above observation table shows relationship between the flow field variables for all the cases. It can be clearly seen that mass flow rate at the outlet increases as the barrier to flow is uplifted. It is sensible that if there is less restriction to flow, mass flow rate at the oulet will increase and vice versa. The lift of the barrier and mass flow rate shows linear relationship. Additionally there is decrease in pressure drop in the fluid flow as the barrier is uplifted. The pressure distribution is balanced along the flow when the flow is less restricted. The flow coefficient (Cv) and flow factor (Kv) increases with respect to the lift of the gate valve. This is because more volume of water is allowed to pass per unit time through the vena contracta (restricted section).
Conclusion:
The parametric study on a gate valve with different valve lift was successfully studied. The mass flow rate and flow coefficient / flow factor varies directly with the lift of the gate valve. However, there is inverse relationship between the pressure drop and gate valve lift. The flow coefficient / flow factor changes according to the gate valve dimensions and it is important to account for these quantities to select gate valve for an appropriate application.
References: