Parsing NASA Thermodynamic Data using File Parsing Technique in MATLAB.
AIM: Write a MATLAB program that extracts the 14 co-efficients and calculates the enthalpy, entropy and specific heat for all the species in the data file (NASA Thermodynamic data).
Introduction:
NASA introduced polynomials that can be used to calculate the thermodynamic properties such as Specific heat(Cp), Enthalpy (H) and Entropy(S) of the elements and their species. They also have documented some co-efficients that are required to evaluate these polynomials for 1000+ species of elements.
In order, to calculate the thermodynamic properties of such elements and their species, we will require the data file of NASA. Similarly, we will be using the technique of "file parsing" to read and evaluate the data.
What is file parsing?
- Parsing in computer languages refers to the syntactic analysis of the input data normally from a file into its components parts in order to facilitate the writing of compilers and interpreters. In simple words, it refers to how information can be read from a text file or any type of file. And how that information can be used in a computer program.
- By using file parsing, we will be able to read data from external files and we can include data in our calculation.
- When we talk about data processing there is a interface between the program and large amount of data. So how we can carryout file parsing?
- We can use various efficient softwares or we can program it in a programming interface platform. As far as our project is concerned, we will be parsing technique in MATLAB i.e.(Programming interface platform).
Theory:
In our project, we will be calculating various thermodynamic properties of the elements and their species. So let's get fundamental recap of such thermodynamic properties.
1. Specific Heat(Cp): Specific heat is defined as the amount of heat that must be added to one unit mass of the substance in order to cause an increase of one unit in temperature. The unit of specific heat is J/Kg K.
2. Enthalpy(H): Enthalpy is the sum of internal energy(U) and product of pressure and volume(PV). In simple terms, it tells how much heat and work was added or removed from the substance. It is similar to energy, but not the same. The unit of ethalpy is KJ/kg.
3. Entropy(S): Entropy is the measure of system's thermodynamic energy per unit temperature that is unavailable for doing useful work. Because work is obtained from ordered molecular motion, the amount of entropy is also a measure of molecular disorder or randomness, of a system. The unit of entropy is KJ/Kg K.
Objectives:
1. Write a MATLAB program to calculate specific heat, enthalpy and entropy of the species.
2. Calculate the molecular weight of each species and display it in the command window.
3. Plot the specific heat, enthalpy and entropy for the local temperature range.
4. Create separate folders for each species and save the plots as images.
Commands used in this project:
A] fopen - This MATLAB command opens the file or obtain information about open files.
B] fgetl - This command reads the line from file or remove newline characters.
C] strfind - It search for strings within other strings.
D] str2double - It convert strings to double precision values.
E] strsplit - This MATLAB command splits the string or character vector at specified delimiter.
F] linspace - It generates linearly spaced vector.
G] for - It repeates the loop for specified number of times.
H] if - It executes the statement "if" condition is true.
I] sprintf - This MATLAB command formats data into string or character vector.
J] mkdir - This command makes new folder.
K] cd - It changes the current folder.
L] saveas - This MATLAB command saves figure to specific file format.
Function coding for formula of the "Cp", "H" and "S":
- Initially, we will create a ".m file" with a function, where we will write the dedicated formulae for specific heat, enthalpy and entropy. Here, (a1,a2,....,a7) are coefficients for the local high temperatures whereas (a8,a9,...a14) are coefficients for local low temperatures.
- Then we will create a "for loop" for the local temperature range of species.
- In addition to it we will create "if loop" inside the "for loop" in which conditions will be assigned. "If" condition states that if Temperature(T) exceeds beyond the local mid temperature then Cp,H and S will be calculated for local high temperature with their respective coefficients. However, "else" condition states that if the temperature(T) does not exceed beyond local mid temperature then calculate the Cp, H and S for the local low temperature with their dedicated coefficients.
Formula:

MATLAB CODE:
function [Cp,H,S] = file_func(T,R,local_mid_temp,a1,a2,a3,a4,a5,a6,a7,a8,a9,a10,a11,a12,a13,a14)

for i = 1:length(T)
if T(i)>local_mid_temp
    Cp(i) = (a1 + a2*T(i) + a3*T(i)^2 + a4*T(i)^3 + a5*T(i)^4).*R;
    H(i) = (a1 + (a2*T(i))/2 + (a3*T(i)^2)/3 + (a4*T(i)^3)/4 + (a5*T(i)^4)/5 + (a6/T(i))).*T(i)*R;
    S(i) = (a1*log(T(i)) + a2*T(i) + (a3*T(i)^2)/2 + (a4*T(i)^3)/3 + (a5*T(i)^4)/4 + a7).*R;

else
    Cp(i) = (a8 + a9*T(i) + a10*T(i)^2 + a11*T(i)^3 + a12*T(i)^4).*R;
    H(i) = (a8 + a9*T(i)/2 + (a10*T(i)^2)/3 + (a11*T(i)^3)/4 + (a12*T(i)^4)/5 + (a13/T(i))).*T(i)*R;
    S(i) = (a8*log(T(i)) + (a9*T(i)^1) + (a10*T(i)^2)/2 + (a11*T(i)^3)/3 + (a12*T(i)^4)/4 + a14).*R;
end

end
end
Function coding for formula of the molecular weight:
- A separate ".m file" is created for the molecular weight calculations. Function command is used for the calculations.
- The atomic weight and species name is input for our function.
- The values of basic elements are given as inputs. For later calculations of the molecular weight of species, these values are useful.
- After that, a for loop is created for calculating molecular weight of the species individually.
Note: Two loops are created because the species are the part of elements. The atomic weight of elements are datum for the species, by which they are getting evaluated.
- "strcmp" command is used to compare species with the elements and to calculate their molecular weight.
- "str2double" command is used to convert the strings into numbers.
MATLAB CODE:
function [molecular_weight_0] = molecular_func(species_name)
species = species_name;
elements = ['H','C','O','N','A','S'];
atomic_weight = [1.00784,12.0107,15.999,14.0067,39.948,32.065];
molecular_weight_0 = 0;
for i = 1:length(species)
    for j = 1:length(elements)
        if strcmp(species(i),elements(j))

   molecular_weight_0 = molecular_weight_0 + atomic_weight(j);
   x = j;

        end
    end
    n = str2double(species(i));
    if n>1
       molecular_weight_0 = molecular_weight_0 + (atomic_weight(x)*(n-1));
    end
end
end
Main Program:
In this program, we will code all the step by step syntax in order to execute the problem statement with appropriate commands and logic.
Step by step procedure:
a) First we will open the "THERMO.dat" data file by using "fopen" command and we will assign a variable to it for further requirement.
b) Then we will use "fgetl" command to get the first line of the file(z). Similarly, we will get the second line of the file which nothing but the global temperature header line and assign a variable "temp_header" to it.
c) From this temp_header we are going to get the string of global low, mid and high temperature by using "strfind" command and we will search for '.' (Fullstop) position in that respective line. "K" is the variable assigned to find the string.
d) After getting the position of "." in temp_header, we will be calculating global low temperature by inserting the position of the "." (fullstop) and manipulating the position to get the values before and after the "." (fullstop). Similarly, we will calculate global mid and high temperature and will assign independent variable for the calculation. Finally, we will convert the string into a number by using "str2double" command. Now, we have all the global temperatures.
e) In order to skip unwanted lines, we will create a "for loop" by inserting "fgetl" command and will iterate it from 3rd to 5th line.
f) As stated in the data file, we have 53 species, therefore assigning the "num_species = 53".
"For loop started"
g) Now, we will create a loop which will be having the syntax that will execute the calculations for each and every species and will be closed at the end of the program.
h) We are on 6th line, which is the header line of the species. Here again we will use "fgetl" command to get the header line printed and will assign a variable to it. Based on the logic for the global temperature calculations i.e.[step (d)], we will calculate the local low, mid and high temperature.
i) In order to get, the species name printed for all the iterations, we have to split the string using "strsplit" command and assign a independent variable to it. After that, the string gets splitted into cell arrays from which have to extract the first cell which shows the name of the species.
j) Our next aim is to calculate the coefficients of the species which are in equally spaced in three consecutive lines. For this, we have to get the first line of coefficients by using "fgetl" command and assign a variable to the syntax. Accordingly, find the common character in each and every coefficients, which nothing but "E". So let's find the position of "E" by using "strfind" command in the first coefficient line and after getting that modify the values such that we get the whole coefficient. Accordingly the extracted coefficient is in the form of string, however, we have to convert the string into number. So we will use "strdouble" command for the conversion. Similarly, we will execute this syntax for each and every coefficient and for other two coefficient line.
k) Now we have all the coefficient calculations in our program. Next step is to calculate the specific heat, enthalpy and entropy for the given i.e. local temperature range. So we need to define the local temperature range using linspace command and universal gas constant. Then we will insert the call the function of Cp,H and S, which have created above. We must verify our function working by pressing "F5" key. We will be getting one hundred independent values of Cp, H and S for one hundred linearly spaced different local temperature range.
l) Before plotting the values of Cp, H and S, we have to create a directory (Folder) in which all the images of the plots will be saved accordingly. Here, we have to use "mkdir" and "cd" command.
m) We will plot the values of Cp, H and S with respect to temperature variation, label the x and y axis and and will save the images of the plot by using "saveas" command.
n) Finally, we will calculate the molecular weight by using the molecular weight function, which have created previously as a independent ".m file". We will the same function and will print the molecular weight by using "sprintf" command with %s %f so that the string and the floating number which is nothing but the value of molecular mass will be displayed.
NOTE: The for loop runs in such a way that if there is numeric value in the species name, then it willl extract that value, convert it into a number and adds the previous character preceding the number that number of times to get the molecular weight.
E.g: For O2, it will extract 2 from the string, convert it into the numeric value and add O two times (O+O), which will result into the molecular weight of O2.
"For loop ended"
o) Press "F5" key to run the program and after execution, open the directory stated in the program and visualize the results.
MATLAB CODE:
clear all
close all
clc

z = fopen('THERMO.dat','r');
fgetl(z);
temp_header = fgetl(z);
K = strfind(temp_header,'.');

% To calculate global low temperature.
% e = temp_header((7-3):7+3)
e = temp_header((7-3):K(1)+3);
global_low_temp = str2double(e);

% To calculate global high temperature.
% f = temp_header(10:17+3)
f = temp_header(K(1)+6:K(2)+3);
global_mid_temp = str2double(f);

% To calculate global mid temperature.
% g = temp_header(20+3:(27+3))
g = temp_header(K(2)+6:K(3)+3);
global_high_temp = str2double(g);

% For loop for neglecting unwanted lines.
for i = 3:5
    skip_lines = fgetl(z) ;
end

% Total number of species.
num_species = 53;

for j =1:num_species;
% To get the species and local low, mid and high temperature.
species_header = fgetl(z);
A = strfind(species_header,'.');
% To get the local low temperature
% local_temp_1 = species_header(52-3:52+3)
local_temp_1 = species_header(A(1)-3:A(1)+3);
local_low_temp = str2double(local_temp_1);

% To get the local high temperature
% local_temp_2 = species_header(52+6:62+3)
local_temp_2 = species_header(A(1)+6:A(2)+3);
local_high_temp = str2double(local_temp_2);

% To get the local mid temperature
% local_temp_3 = species_header(62+6:72+3)
local_temp_3 = species_header(A(2)+6:A(3)+3);
local_mid_temp = str2double(local_temp_3);

% To get the species name
q = strsplit(species_header,' ');
species_name = q{1};

% To calculate all coefficients in line 1.
coeff_line_1 = fgetl(z);
B = strfind(coeff_line_1, 'E');

% Coefficients from line 1
% 1st coefficient
a1 = coeff_line_1(1:B(1)+3);
a1 = str2double(a1);
% 2nd coefficient
a2 = coeff_line_1(B(1)+4:B(2)+3);
a2 = str2double(a2);
% 3rd coefficient
a3 = coeff_line_1(B(2)+4:B(3)+3);
a3 = str2double(a3);
% 4th coefficient
a4 = coeff_line_1(B(3)+4:B(4)+3);
a4 = str2double(a4);
% 5th coefficient
a5 = coeff_line_1(B(4)+4:B(5)+3);
a5 = str2double(a5);

% To calculate all coefficients from line 2.
coeff_line_2 = fgetl(z);
C = strfind(coeff_line_2, 'E');

% Coefficients from line 2
% 6th coefficient
a6 = coeff_line_2(1:C(1)+3);
a6 = str2double(a6);
% 7th coefficient
a7 = coeff_line_2(C(1)+4:C(2)+3);
a7 = str2double(a7);
% 8th coefficient
a8 = coeff_line_2(C(2)+4:C(3)+3);
a8 = str2double(a8);
% 9th coefficient
a9 = coeff_line_2(C(3)+4:C(4)+3);
a9 = str2double(a9);
% 10th coefficient
a10 = coeff_line_2(C(4)+4:C(5)+3);
a10 = str2double(a10);

% To calculate all coefficients from line 3.
coeff_line_3 = fgetl(z);
D = strfind(coeff_line_3, 'E');

% Coefficients from line 3
% 11th coefficient
a11 = coeff_line_3(1:D(1)+3);
a11 = str2double(a11);
% 12th coefficient
a12 = coeff_line_3(D(1)+4:D(2)+3);
a12 = str2double(a12);
% 13th coefficient
a13 = coeff_line_3(D(2)+4:D(3)+3);
a13 = str2double(a13);
% 14th coefficient
a14 = coeff_line_3(D(3)+4:D(4)+3);
a14 = str2double(a14);


% To calculate specific heat, Enthalpy and Entropy
% Local temperature range
T = linspace(local_low_temp, local_high_temp,100);
% Universal gas constant
R = 8.314;
% Function to calculate specific heat, enthalpy and entropy.
[Cp,H,S] = file_func(T,R,local_mid_temp,a1,a2,a3,a4,a5,a6,a7,a8,a9,a10,a11,a12,a13,a14);

% Creating folder
mkdir(['C:UsersStudent loginDesktopTANMAYMATLABFile Parsing',species_name])
cd(['C:UsersStudent loginDesktopTANMAYMATLABFile Parsing',species_name])

% Plotting
figure(1)
plot(T,Cp,'linewidth',3);
xlabel('Temperature [K]');
ylabel('Specific Heat [KJ/Kg K]');
grid on
title('Temperature vs Specific heat')
saveas(1,'Specific Heat','jpg');

figure(2)
plot(T,H,'linewidth',3);
xlabel('Temperature [K]');
ylabel('Enthalpy [KJ/Kg]');
grid on
title('Temperature vs Enthalpy')
saveas(2,'Enthalpy','jpg');

figure(3)
plot(T,S,'linewidth',3);
xlabel('Temperature [K]');
ylabel('Entropy [KJ/Kg K]');
grid on
title('Temperature vs Entropy')
saveas(3,'Entropy','jpg');

% To calculate the molecular weight
[molecular_weight] = molecular_func(species_name);
sprintf('Molecular weight of %s is %d', species_name,molecular_weight)
end

fclose(z);
Results:
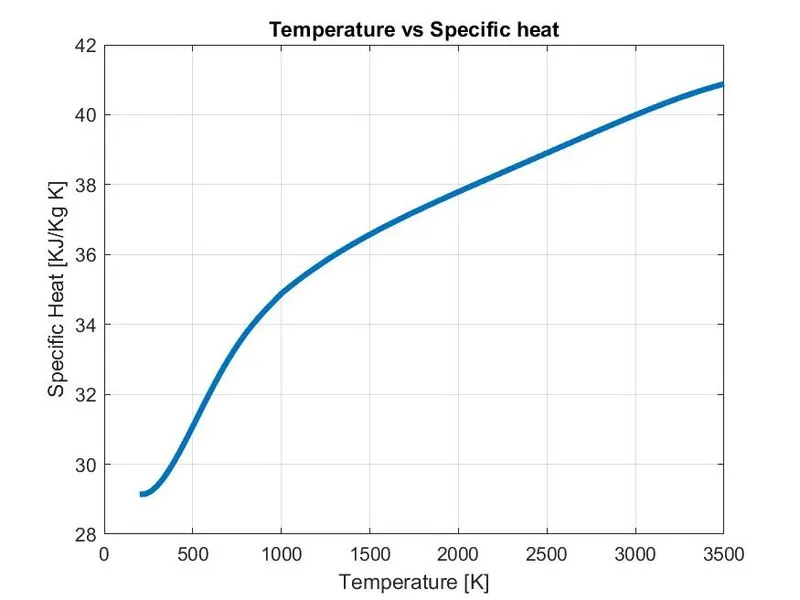
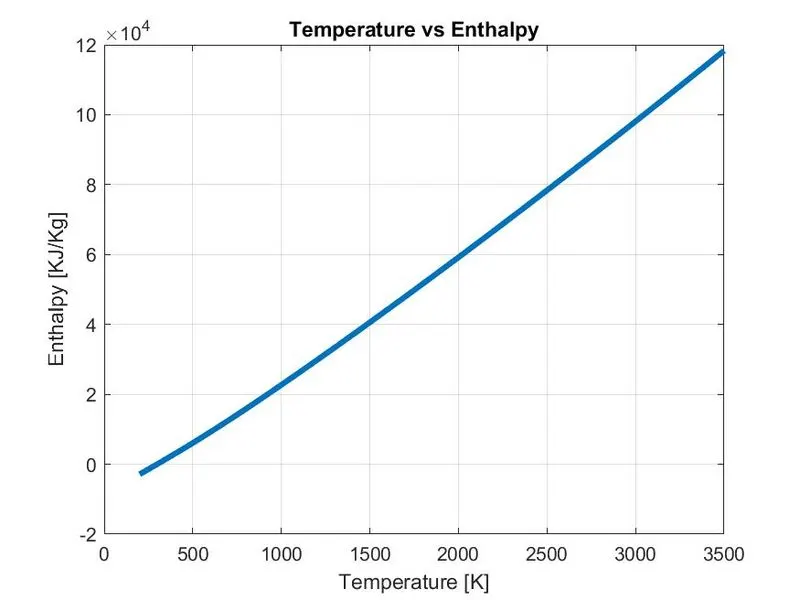
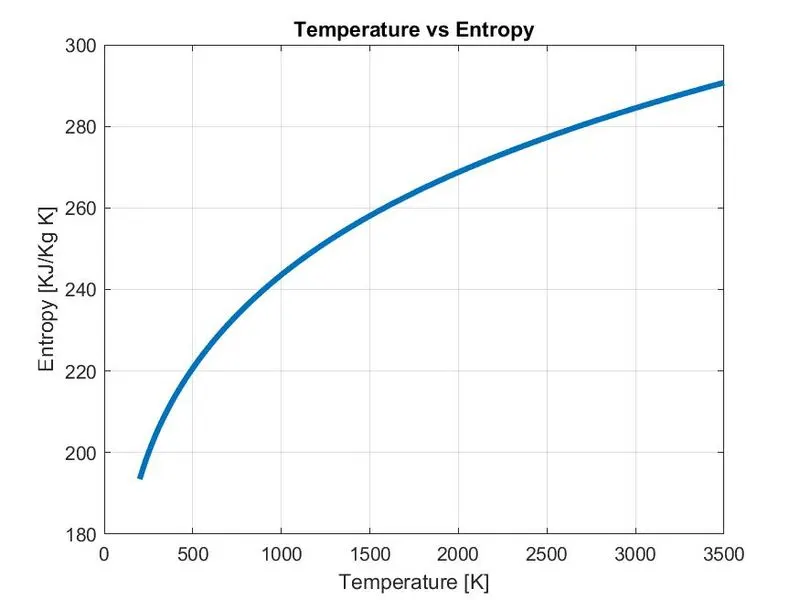
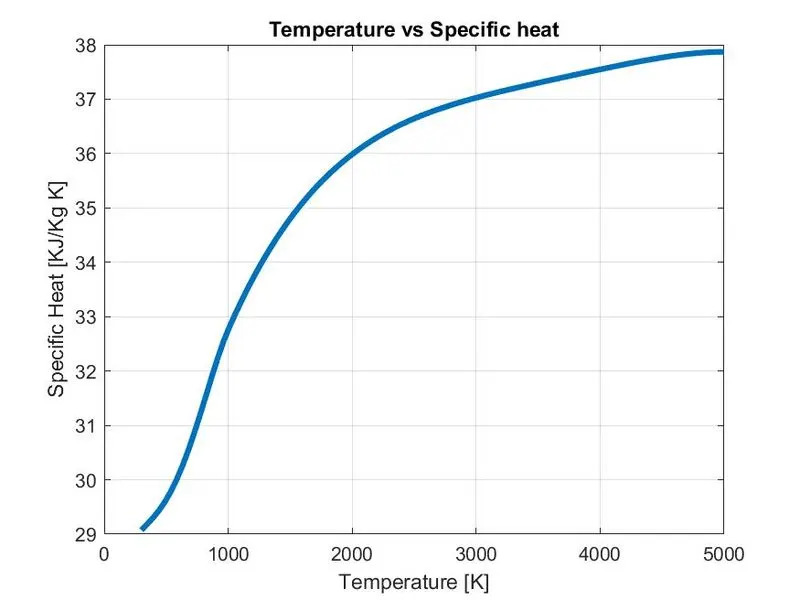
1. Plots of O2,N2 and CO2 species.
A. Plots of O2:
Temperature vs Specific Heat
Temperature vs Enthalpy
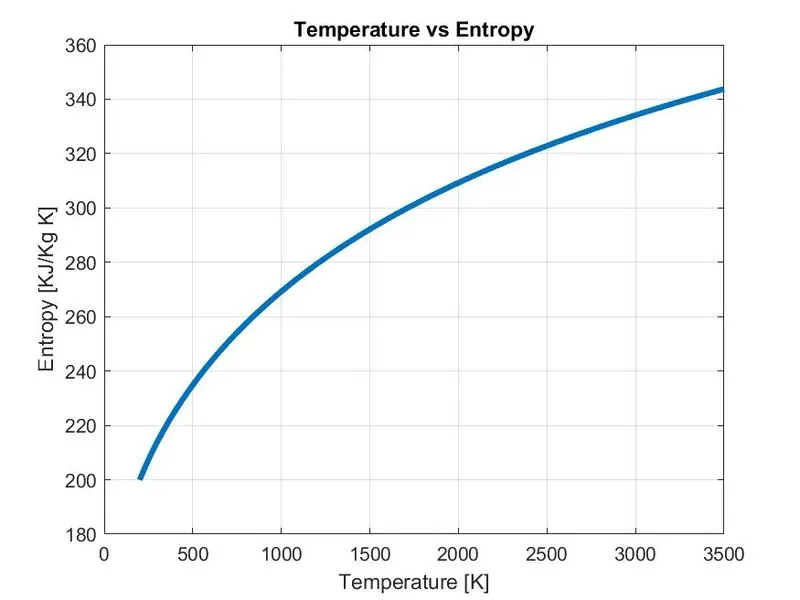
Temperature vs Entropy
Molecular weight:

B. Plots of N2:
Temperature vs Specific Heat
Temperature vs Enthalpy
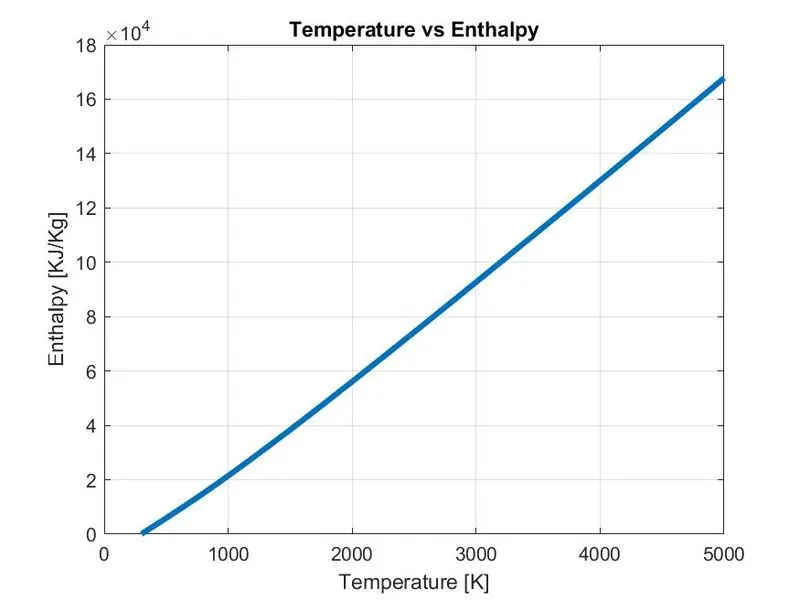
Temperature vs Entropy
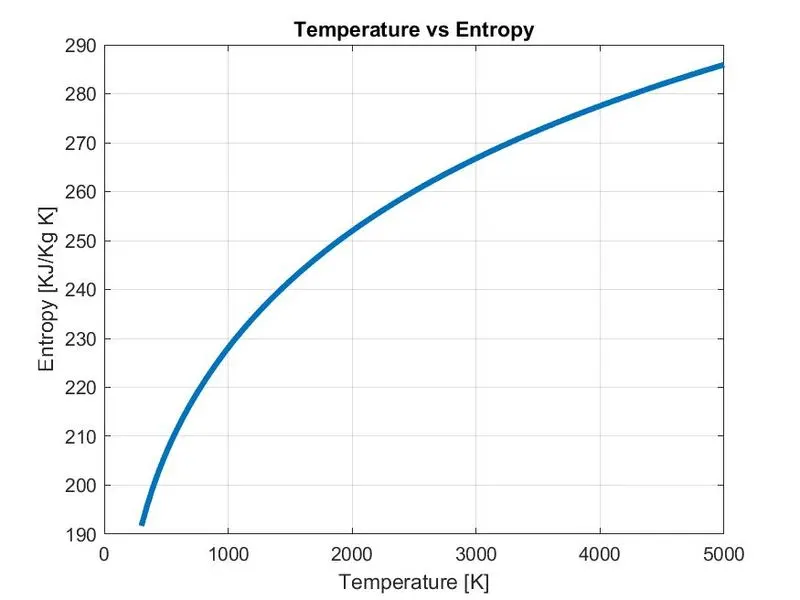
Molecular weight:

C. Plots of CO2:
Temperature vs Specific Heat
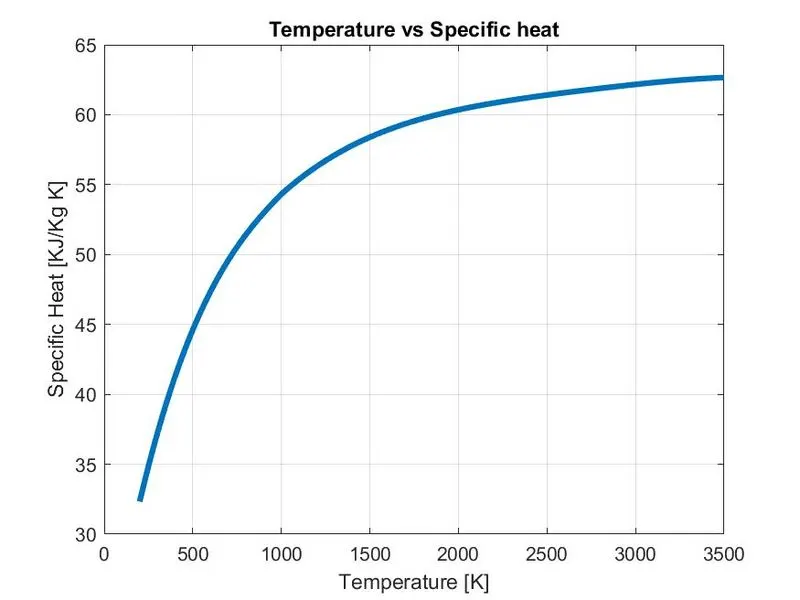
Temperature vs Enthalpy
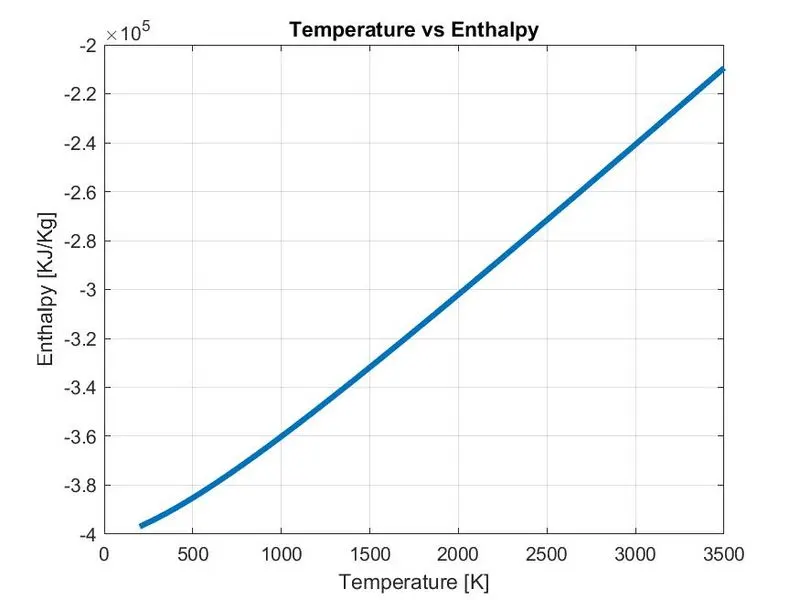
Temperature vs Entropy
Molecular weight:

All the Cp,H and S plots are stored in their species folder in the directory.

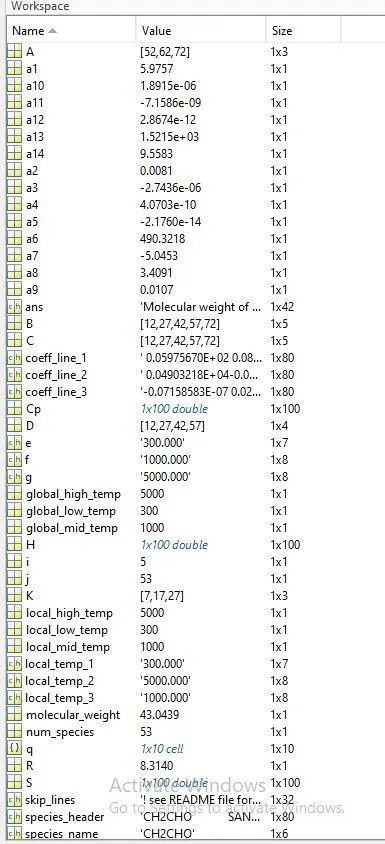
Snapshot of the workspace:
Errors Encountered:
I encountered many errors while executing the program, for now I am sharing some of them:
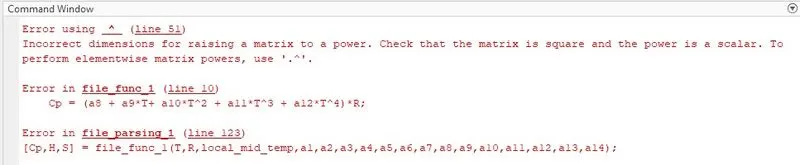
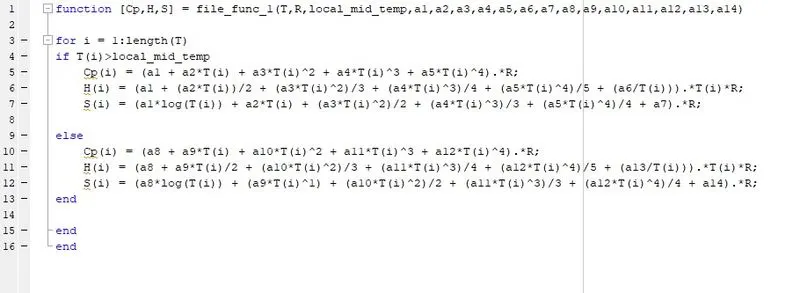
1. Error pertaining to "dot product":
I did not use dot product while multiplying matrix and as temperature is linearly spaced array it need to specified as array respectively. And I did not used array function for Cp, H and S, which means the properties did not get calculated for all the temperature range. Only single answer for Cp, H and S was resulted.
Command window:
Editor Window:
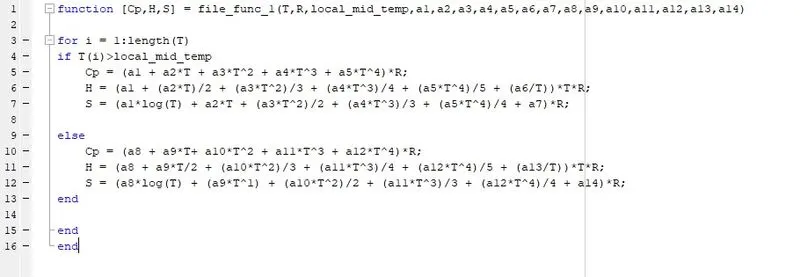
Solution: So to correct the cause, I used the "." dot product for matrix multiplication and calculated Cp, H and S for all temperature range. The snapshot of correction is shown below,
Editor window:
2. Error regarding invalid syntax:
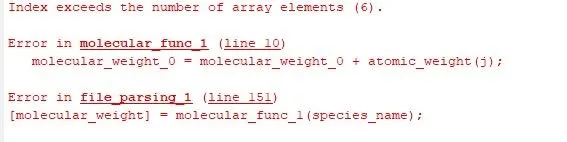
While inserting various elements, I inserted element as "AR" i.e. (Argon). However my program executed till the index was equilibrium with the number of array elements. But suddenly it crashed and an error pop up came out in my command window.
Command window:
Editor window:
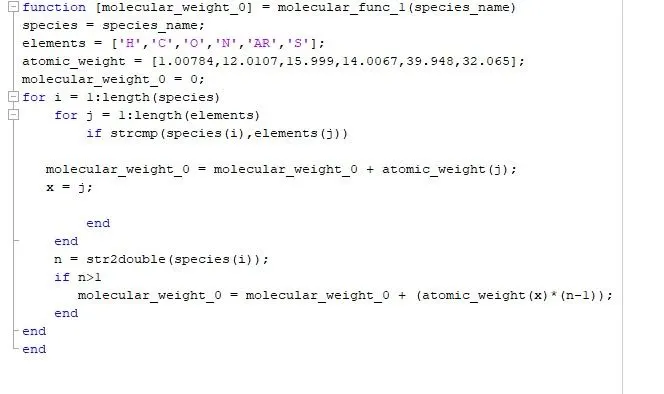
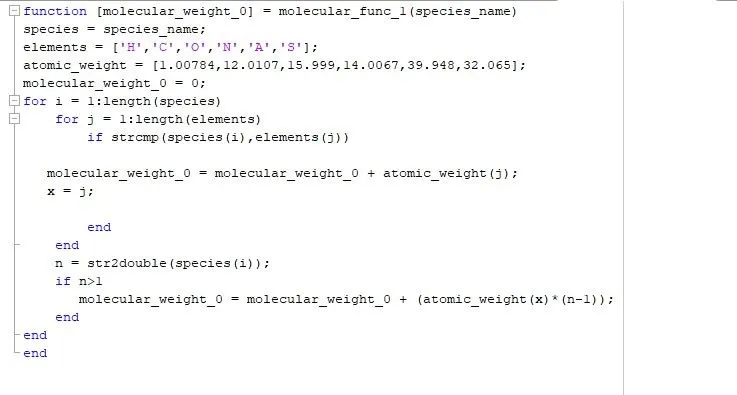
Solution: After various trial and errors I figured it out that all the elements have one letter string but AR is having two letters. As I gave instruction that it should read first letter for all the elements, means the two letters string was considered as species by MATLAB and it was unable to perform molecular weight calculation. Because there is no "R" element defined, so it was showing error. So I deleted the "R" and defined "A" as a symbol for argon. Then further calculations for all the species were executed.
Editor window:
Conclusion:
In this project, we successfully calculated given thermodynamic properties of the respective species. The logic for approaching towards the solution is that, break the whole problem into certain intervals and code accordingly. It is better to code the whole program for a single species then move forward, make changes accordingly by adding for loop and execute it for all the species. Additionally, approach the data file in step by step i.e.(line by line) manner. It is possible to execute this whole project with good MATLAB basic knowledge. Conclusively, the given thermodynamic properties with their respective plots and molecular weight calculations were resulted by using MATLAB programming.
References:
1. https://www.webelements.com/