Week 9 - Parametric study on Gate valve.
CHALLENGE FOR GATE VALVE SIMULATION:
Aim :
For this challenge, you will have to perform a parametric study on the gate valve simulation by setting the opening from 10 % to 80%.
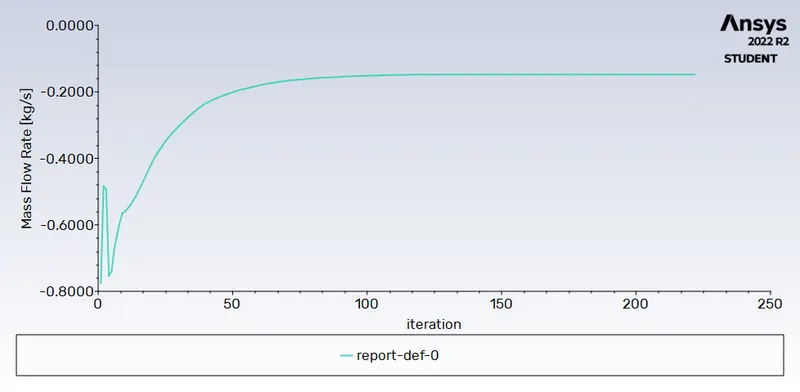
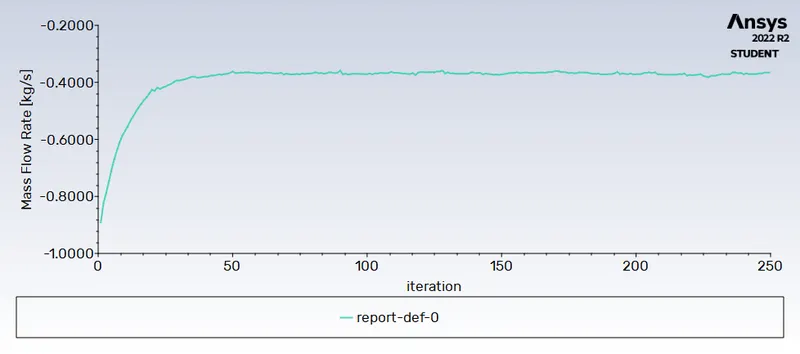
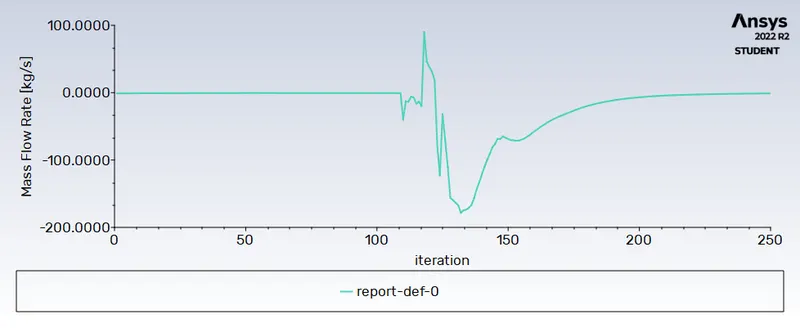
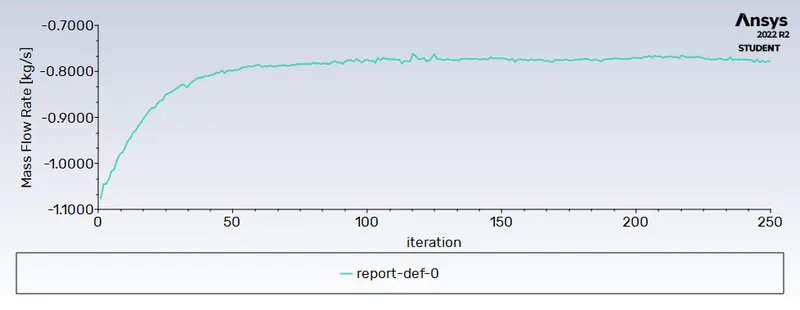
- Obtain the mass flow rates at the outlet for each design point.
- Calculate the flow coefficient and flow factor for each opening and plot the graph.
- Discuss the results of the mass flow rate and flow coefficient.
INTRODUCTION
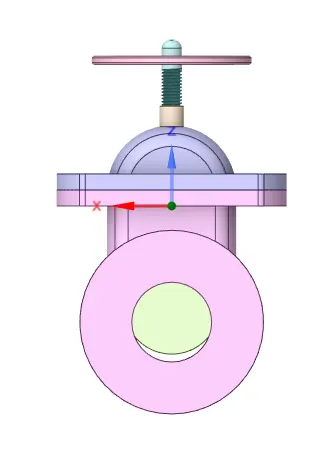
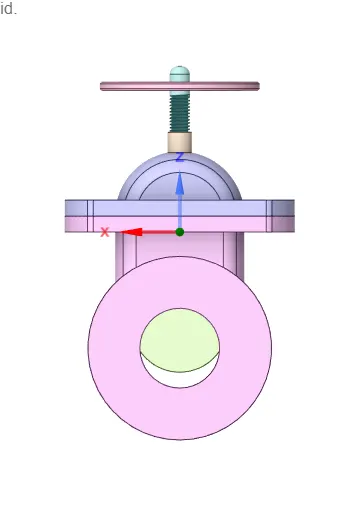
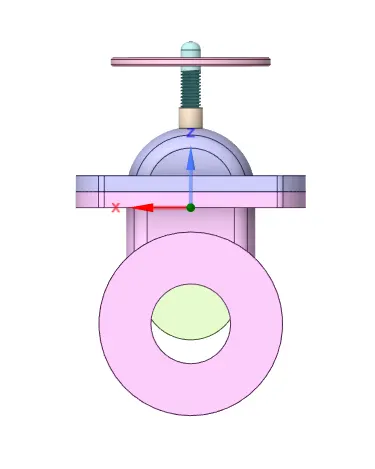
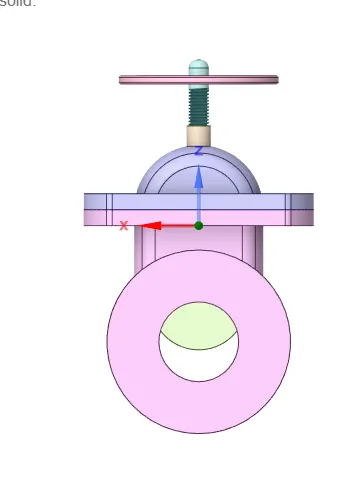
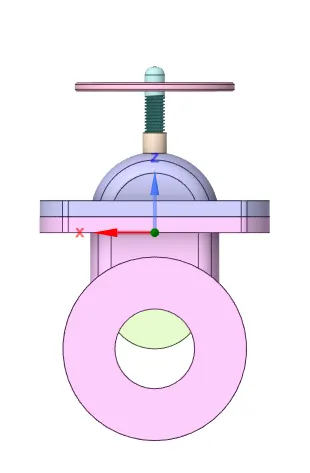
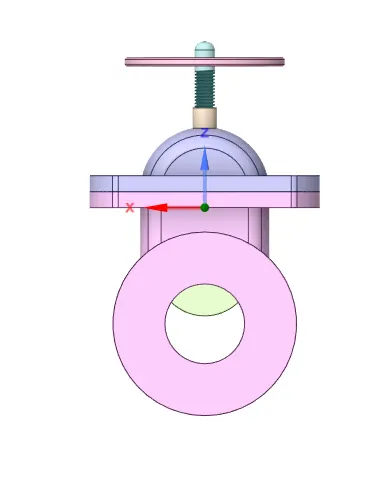
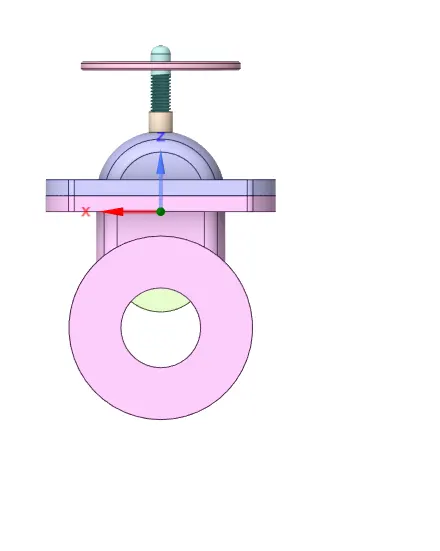
A gate valve controls the media's flow by lifting the gate (open) and lowering the gate (closed). A gate valve's distinct feature is the straight-through unobstructed passageway, which induces minimal pressure loss over the valve. The unobstructed bore of a gate valve also allows for a pig's passage in cleaning pipe procedures, unlike butterfly valves. Gate valves are available in many options, including various sizes, materials, temperature and pressure ratings, and gate and bonnet designs. A gate valve's main components are body, seat, gate, stem, bonnet, and actuator (Figure 2). The primary operation mechanism is straightforward. Turning the handwheel rotates the stem, which moves the gate up or down via the threads. They require more than one 360° turn to fully open/close the valve. Lifting the gate from the path of the flow, the valve opens. Lowering the gate to its closed position seals the bore resulting in a full closure of the valve.
For a gate valve, the relationship between the gate's vertical travel and the flow rate is nonlinear, with the highest changes occurring near shutoff. When used to regulate flow, the relatively high velocity of the flow at partial opening results in gate and seat wear, which along with possible vibrations of the gate, shortens the valve's service life.
Flow Coefficient:
A device's flow coefficient is a measure of how well it allows fluid to flow. It explains the connection between the corresponding flow rate and the pressure drop via an orifice valve or other component.
The flow coefficient Cv, often known as the flow-capacity rating of the valve, can be mathematically stated as:

where:
- Q is the rate of flow (expressed in US gallons per minute),
- SG is the specific gravity of the fluid (for water = 1),
- ΔP is the pressure drop across the valve (expressed in psi).
The use of the flow coefficient provides an industry-accepted standard method for comparing valve capacity and sizing valves for particular applications. The discharge coefficient can be used to extend the generic definition of the flow coefficient into equations that simulate the flow of liquids, gases, and steam.
The Cv for the same assembly can be combined with a more complicated equation to model gas flow in a pneumatic system. For gas, absolute pressures (psia) must be employed instead of only differential pressure.
Flow Factor:
A flow factor (Kv), also known as a flow coefficient, is the amount of water flowing through a device in cubic metres per hour (m3/h) at a temperature of 16°C with a pressure drop of 1 bar across the valve or other restricting device. The head drop (h) or pressure drop (P) over the valve is related to the flow rate by the Kv (Q).
Kv = 0.865 * Cv
Critical Flow Factor:
Cf, or critical flow factor, is a coefficient that describes how pressure will rise after falling to its lowest point inside the control valve. For the purpose of sizing valves, the flow coefficient (Cv) or flow rate must be calculated, and this factor is called Cf.
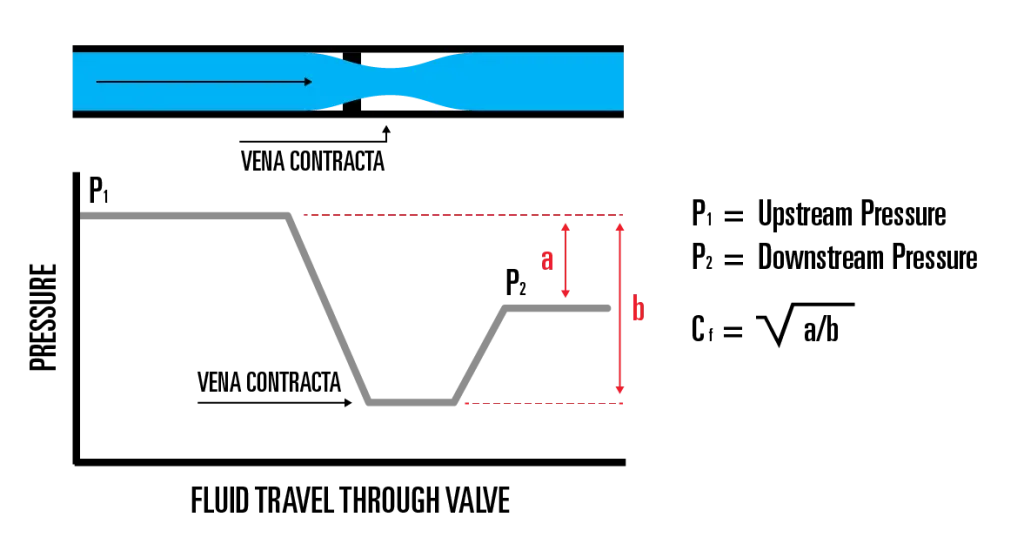
First, liquid or gas enters a control valve (seen above in light blue). As a result, the pressure decreases until it reaches the lowest point, or the vena contracta. After that, it flows downstream, and the pressure returns (or recovers).
Parametric analysis
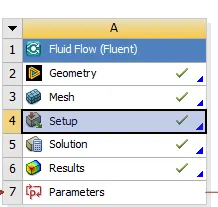
You can define the parameter range, describe the design restrictions, and evaluate the effects of each parameter variation using parametric studies. To do a parametric study, you must: Parametric Dimensions is selected as the Design Objective. Nominated variables to be used in the simulation. The height of the gate valve is the parameter specified for this specific simulation.
Gate Valve simulation :
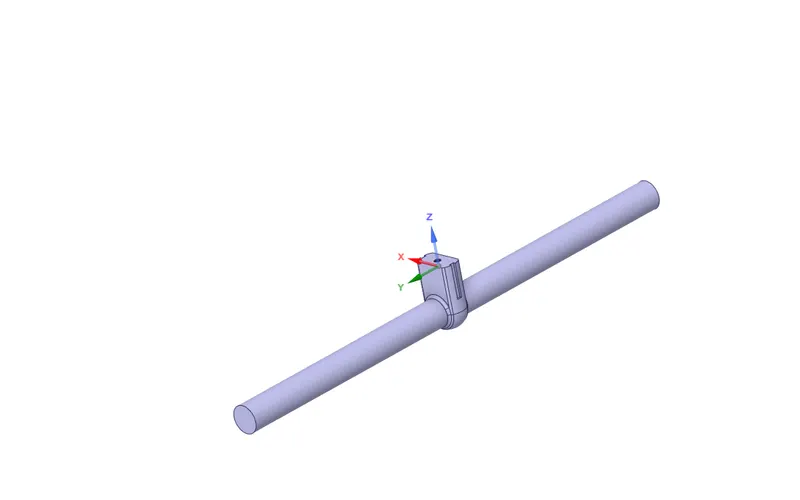
1. Geometry Setup :
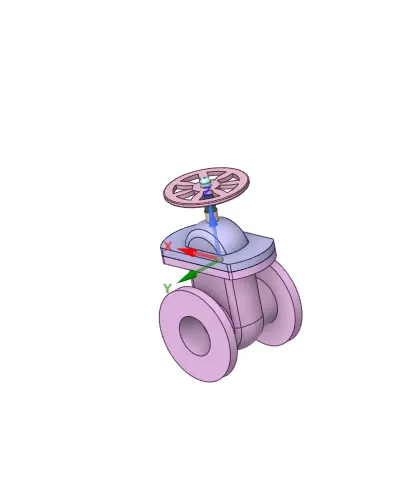
Import the model file
Do the fluid volume extract
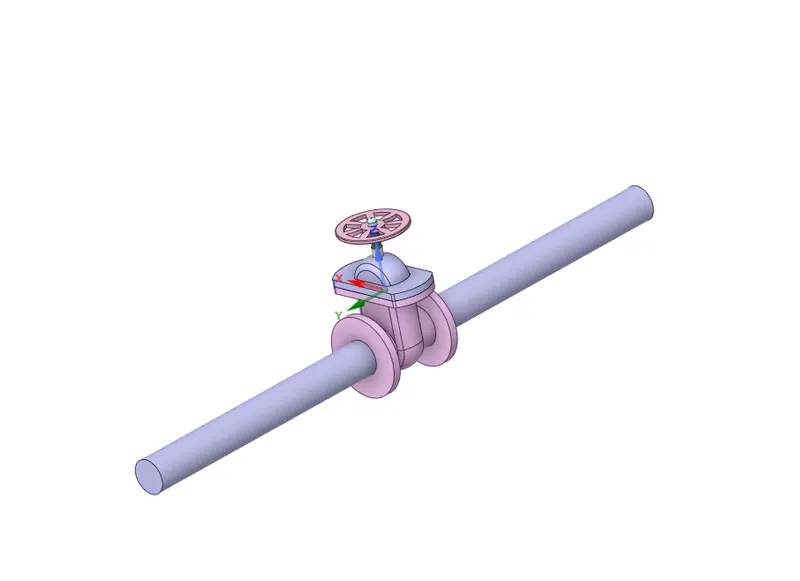
Pull the fluid volume
 \
\
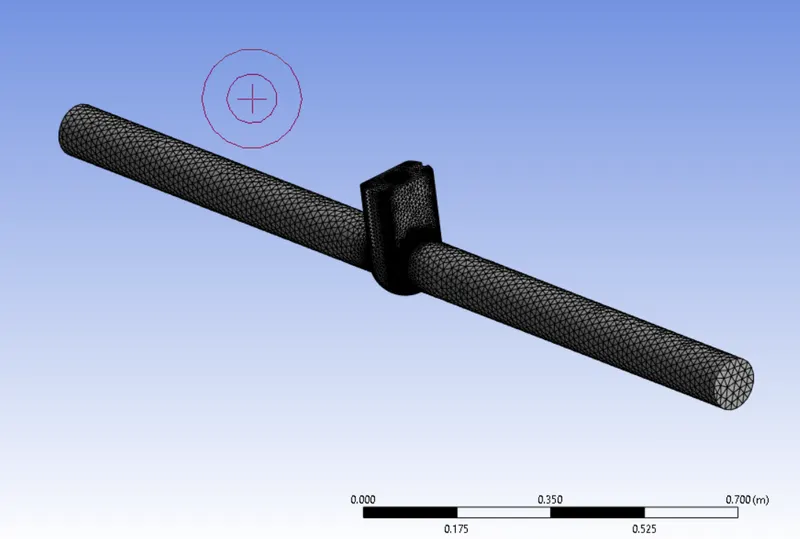
2. Meshing the geometry :
name the zones :
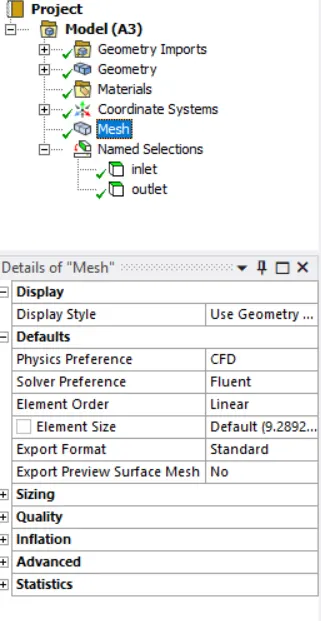
3. Setting up geometry :
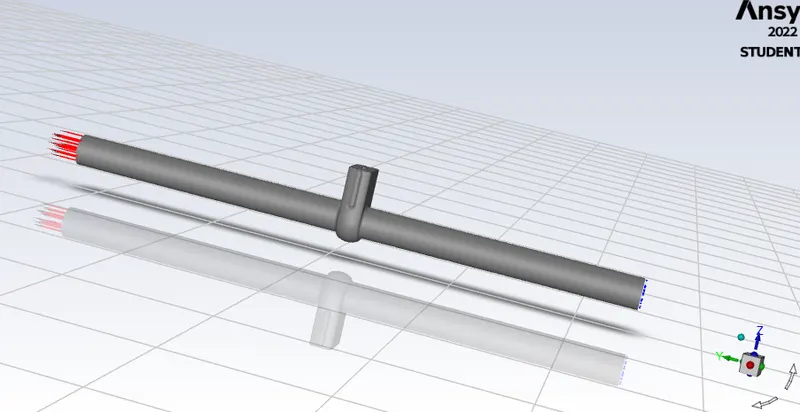
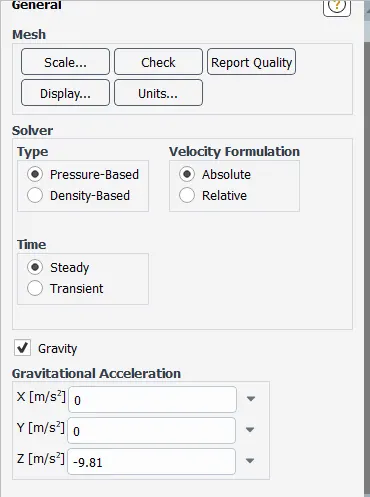
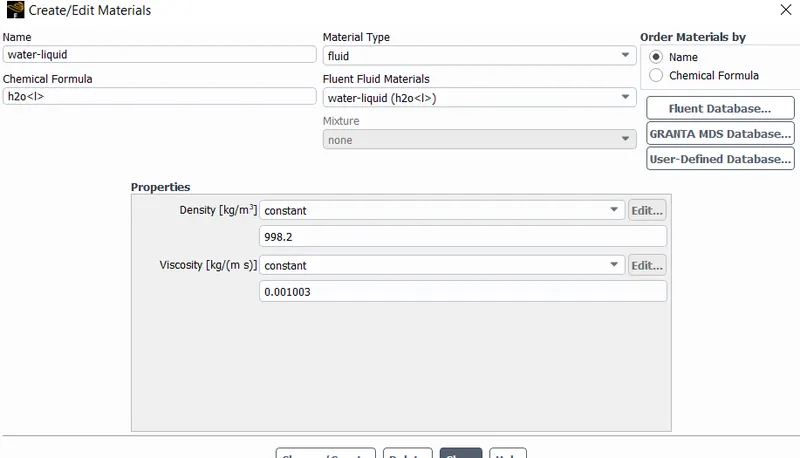
Create Material - Water
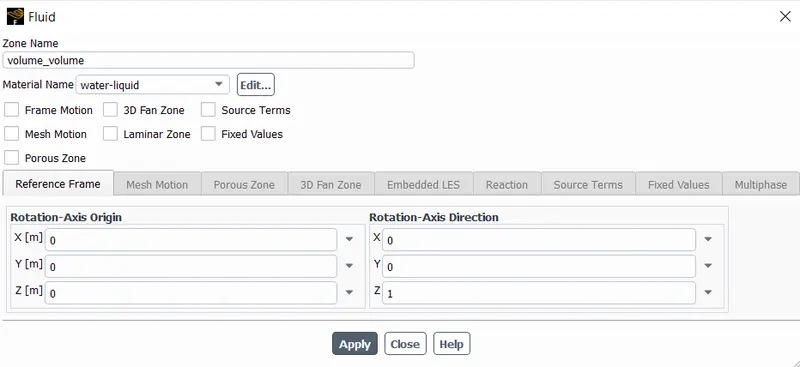
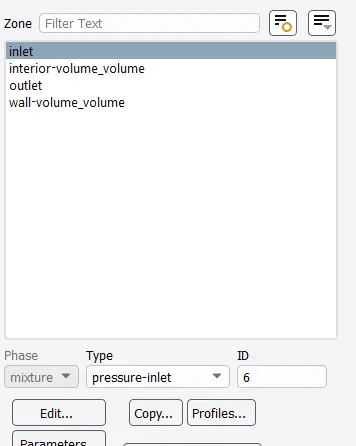
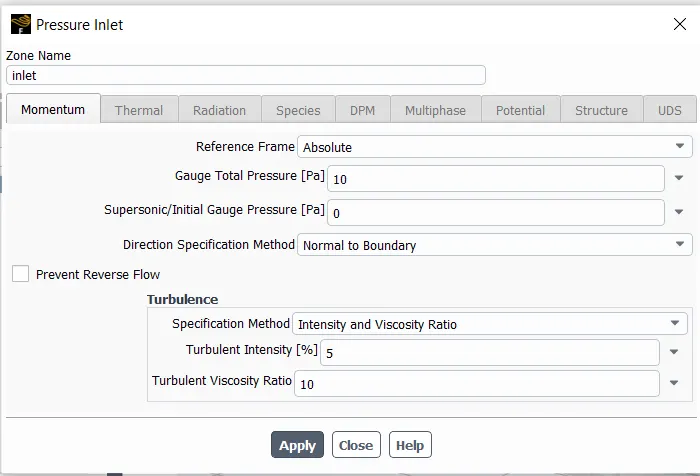
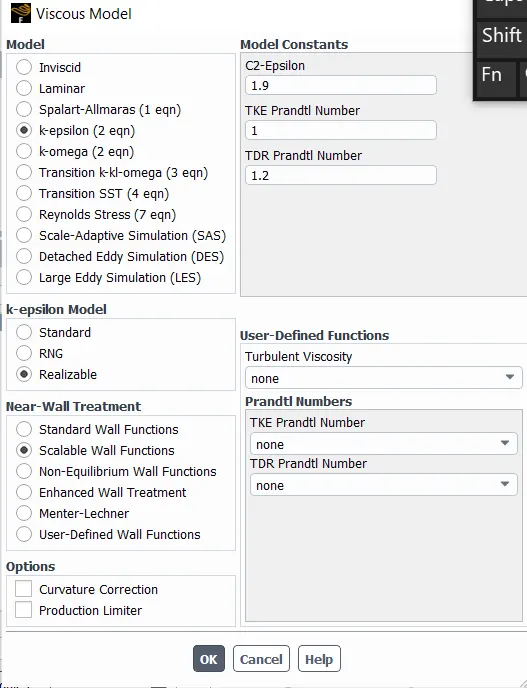
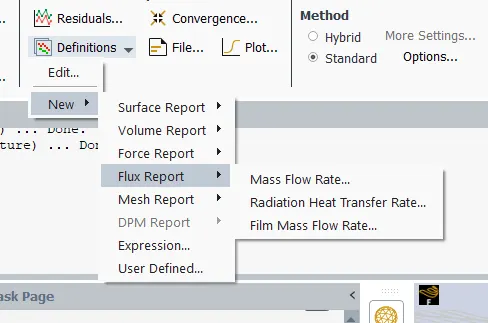
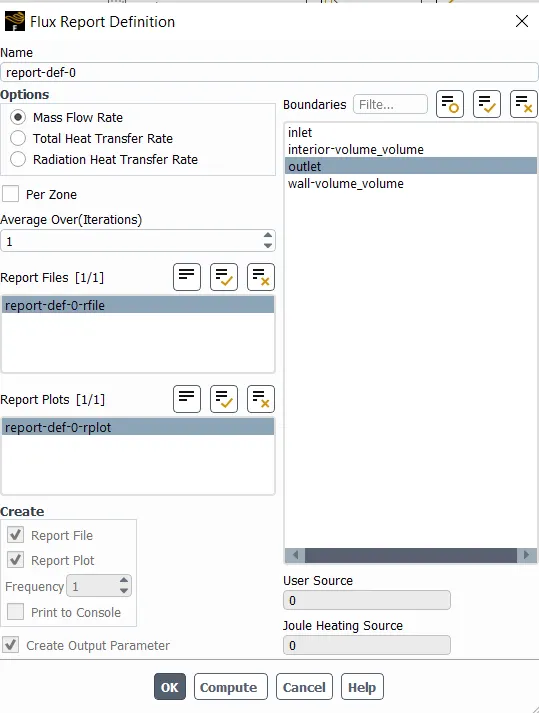
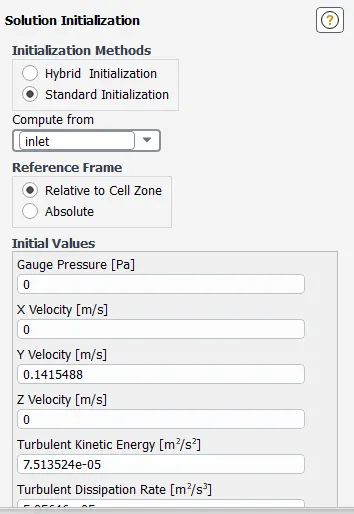
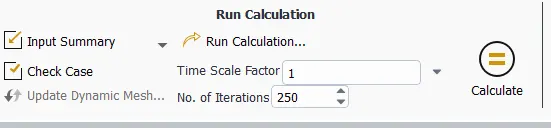
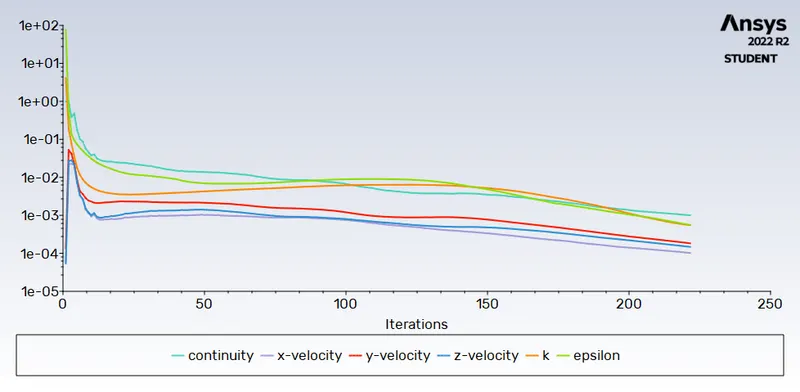
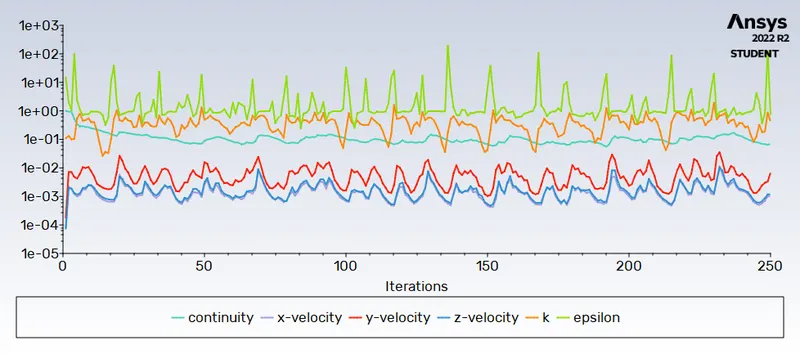
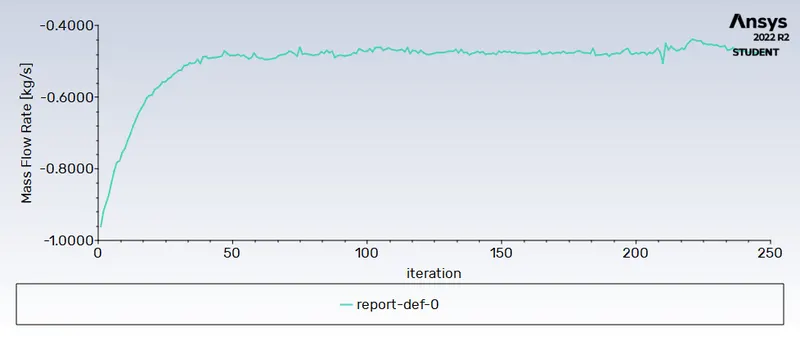
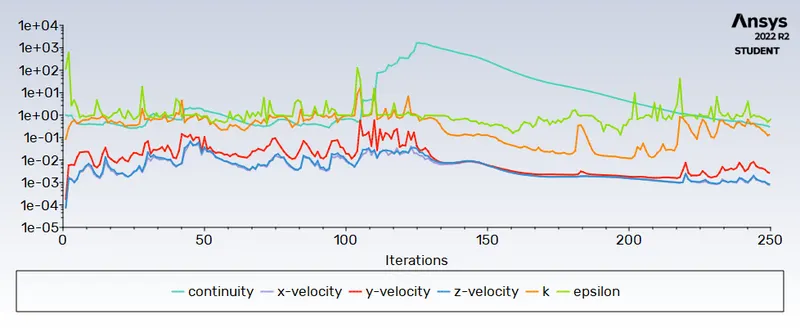
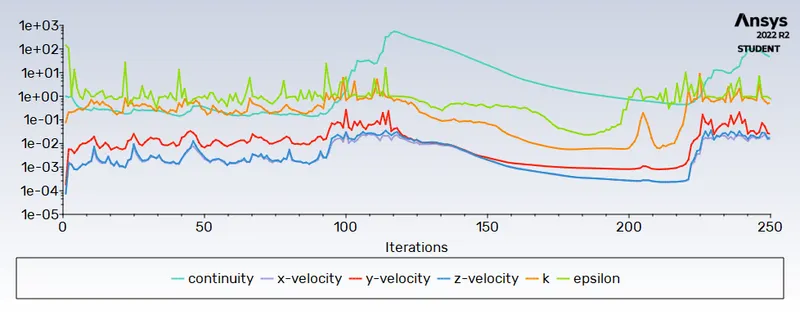
Run for 250 iterations
4. Solution and Results :
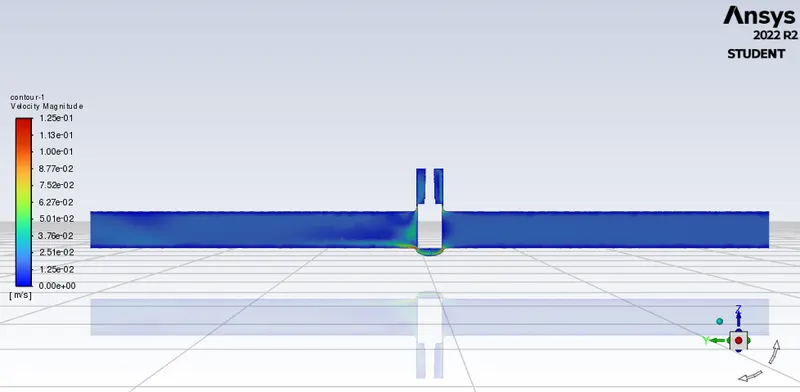
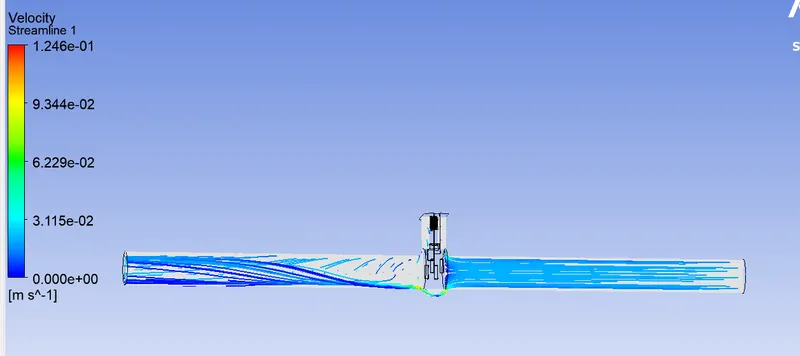
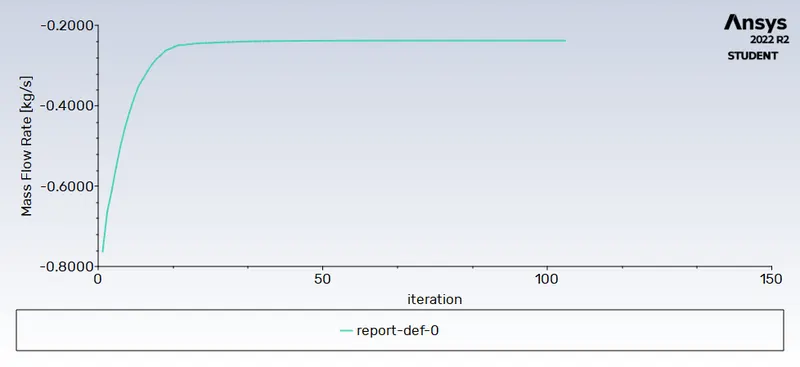
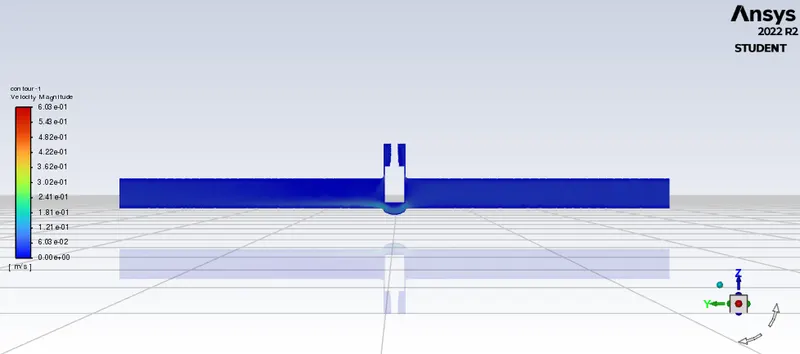
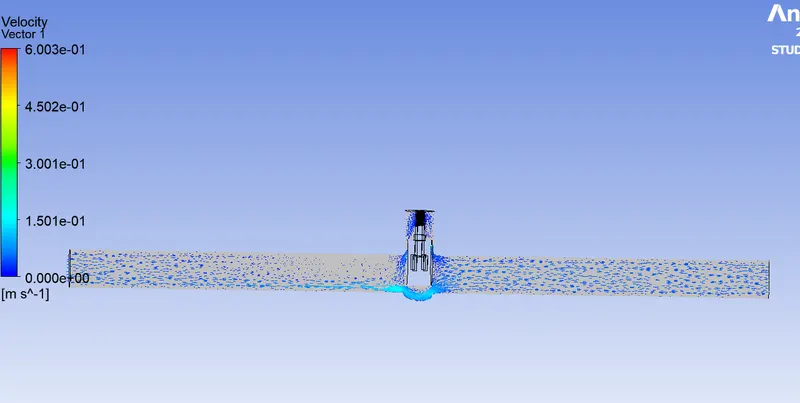
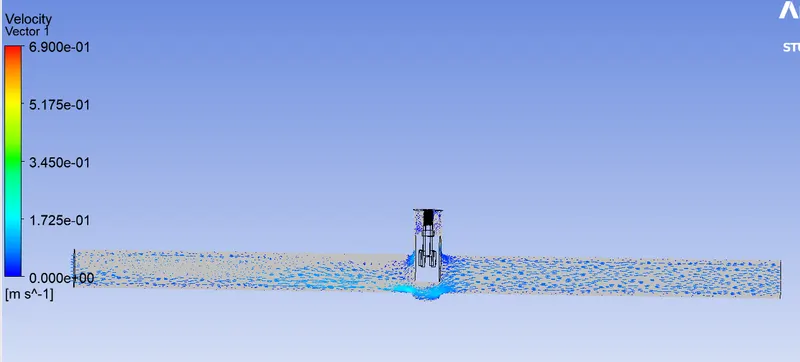
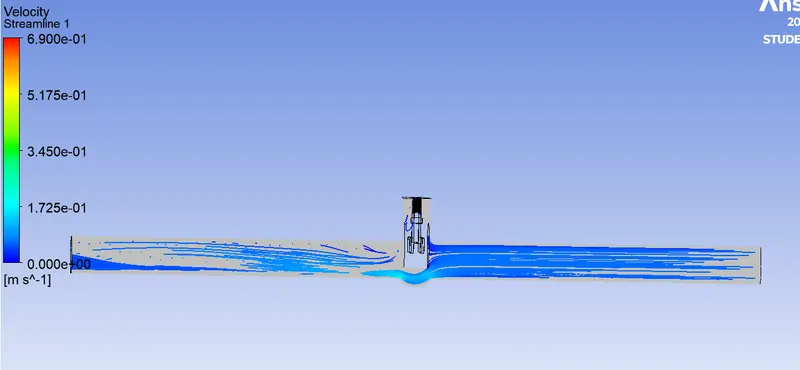
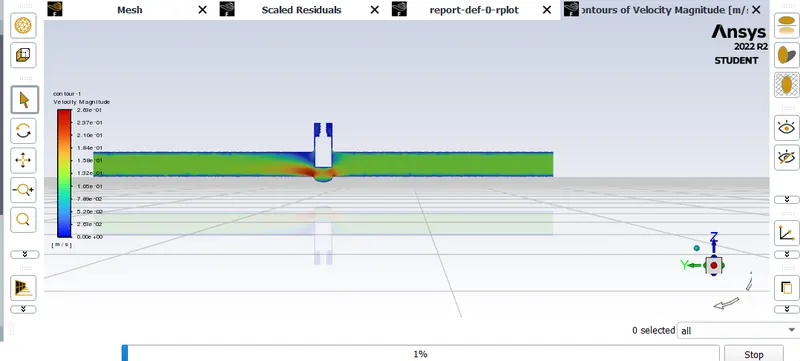
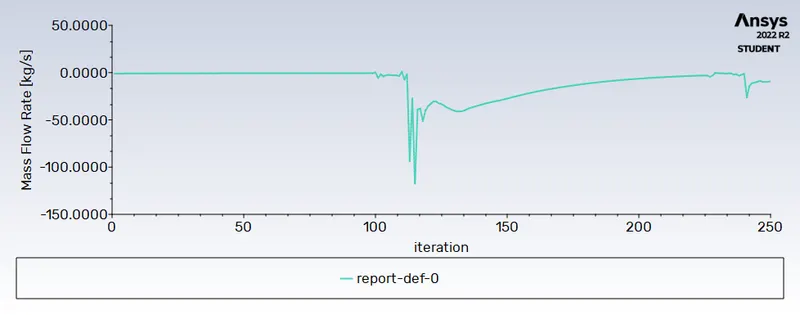
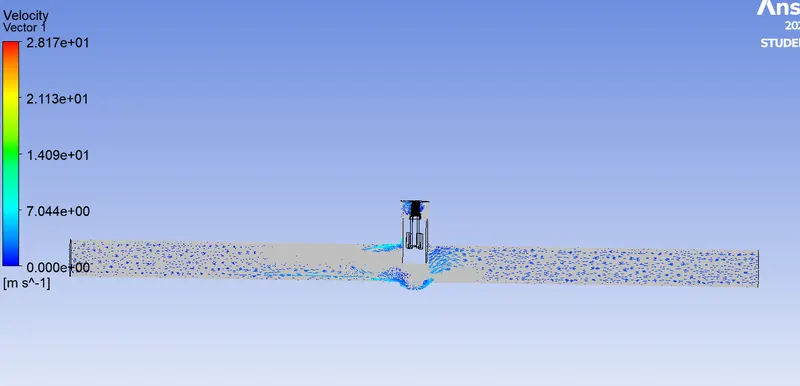
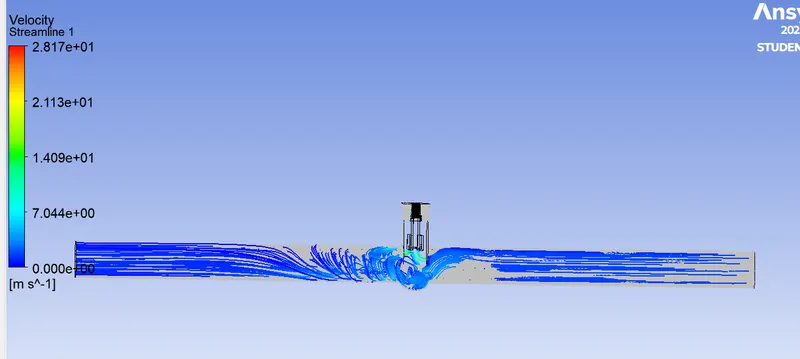
Case 1 : 10 mm lift
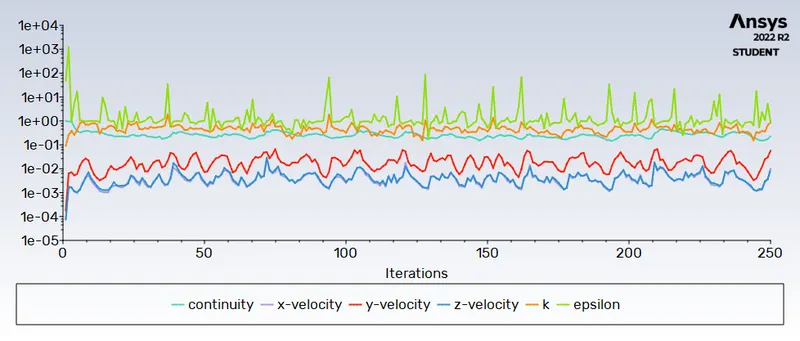
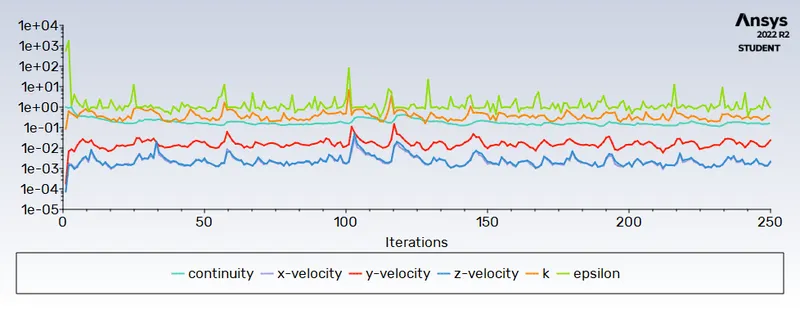
scaled residals :
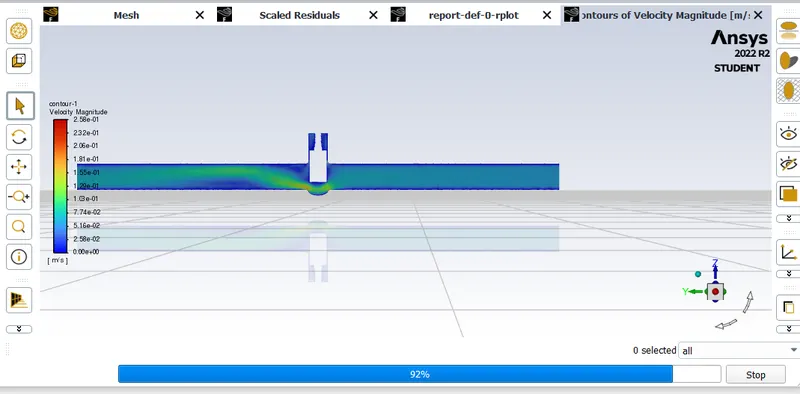
Cotor :
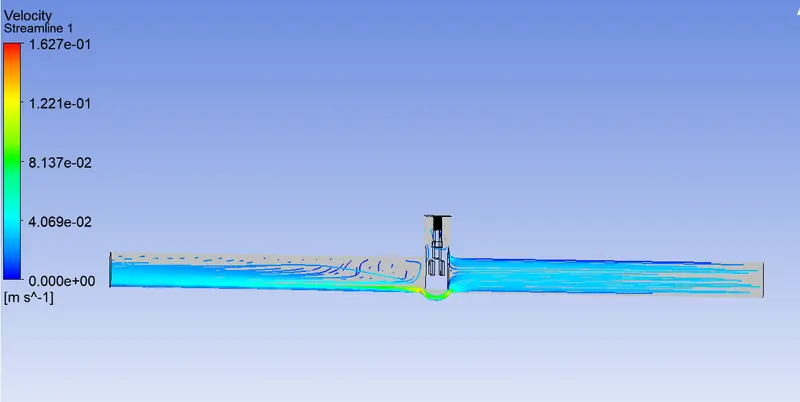
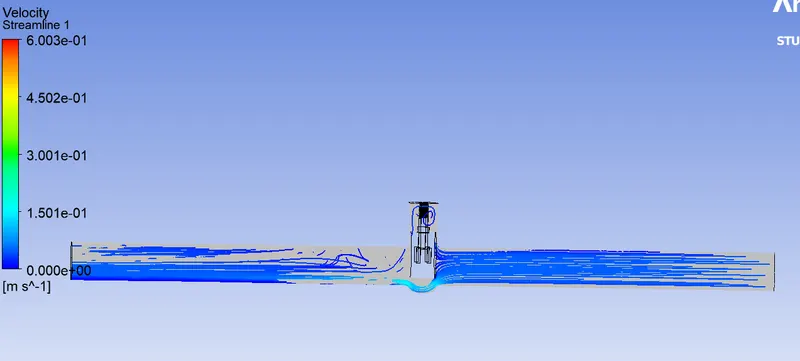
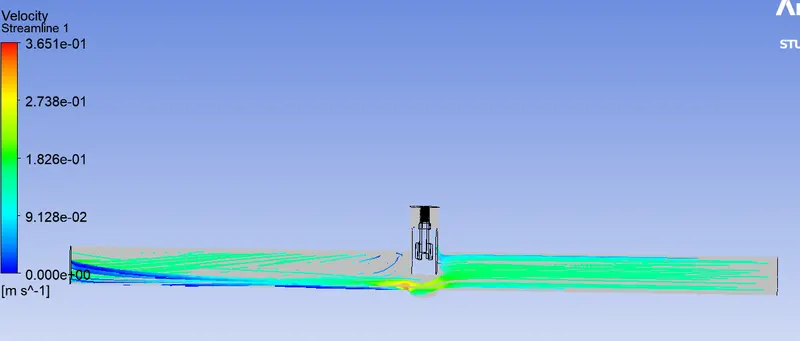
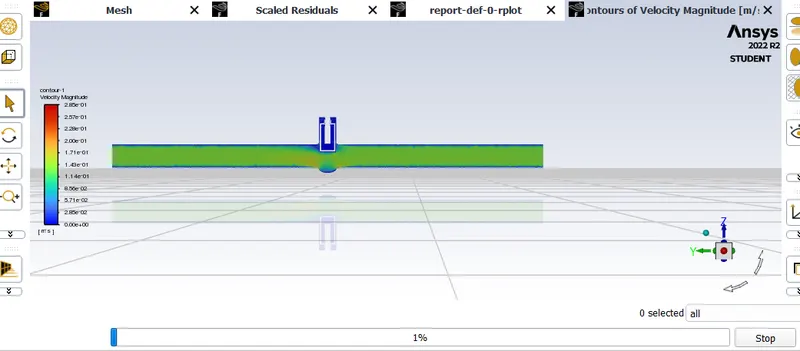
Velocity streamlines :
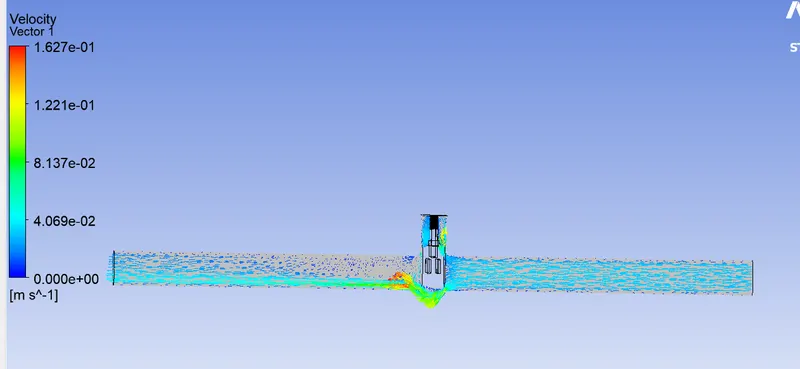
Velocity vectors :
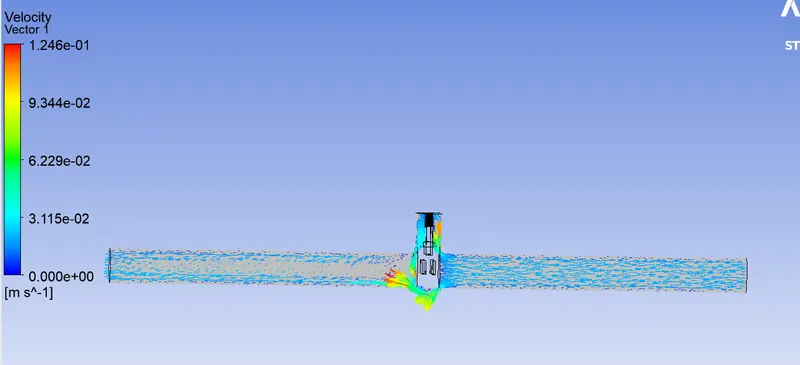
Case 2 : 20 mm lift
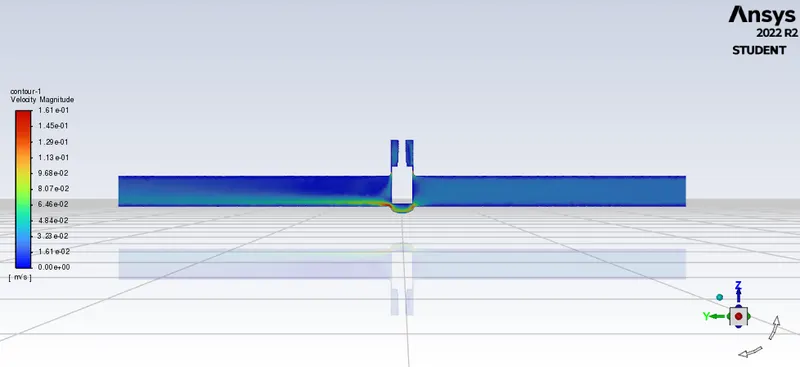
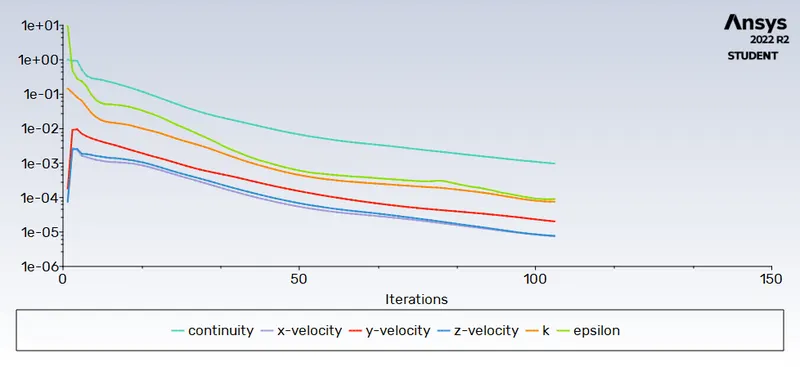
Case 3 : 30 mm lift
Case 4 : 40 mm lift
Case 5 : 50 mm lift
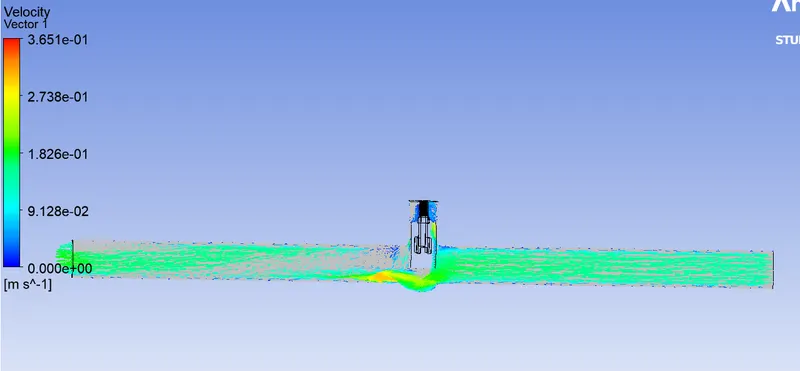
Case 6: 60 mm lift
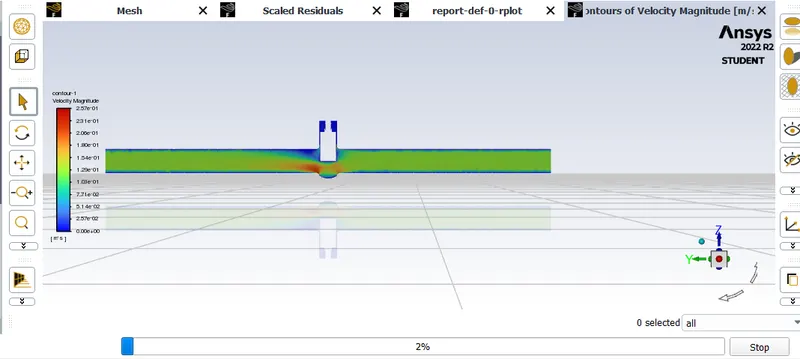
Case 7: 70 mm lift
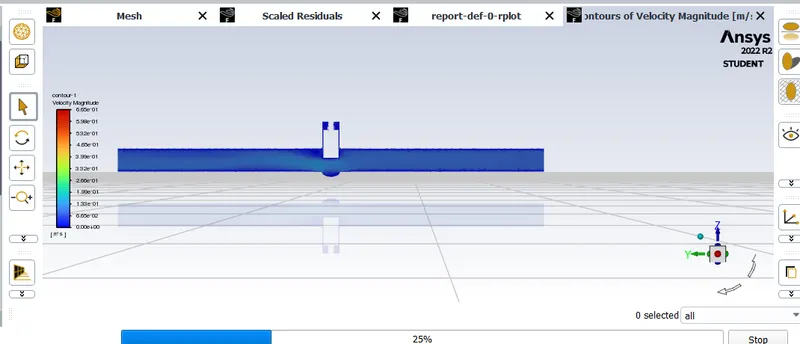
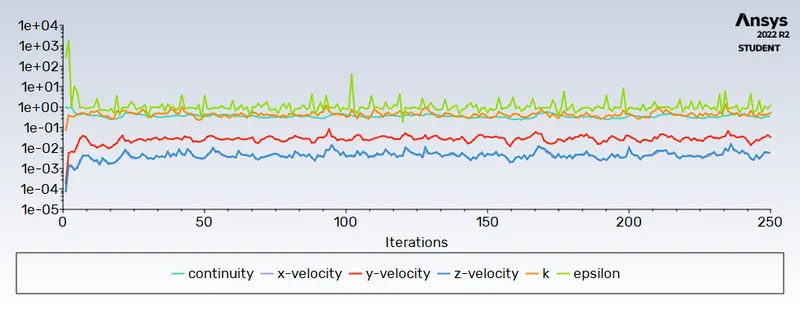
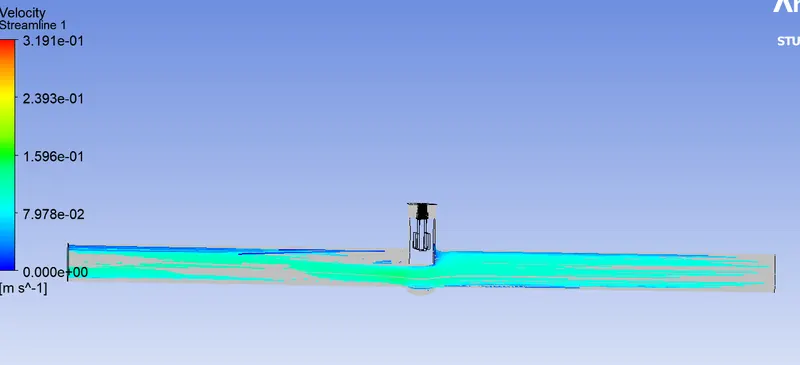
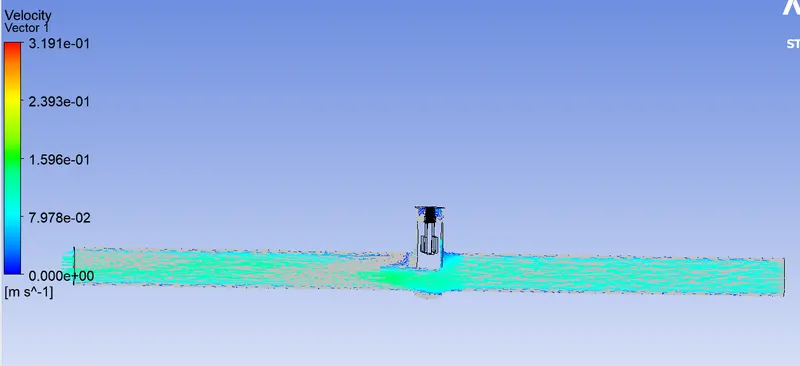
Case 8: 80 mm lift
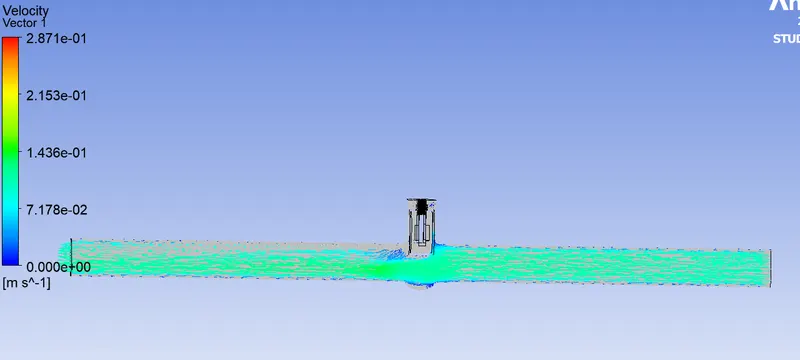
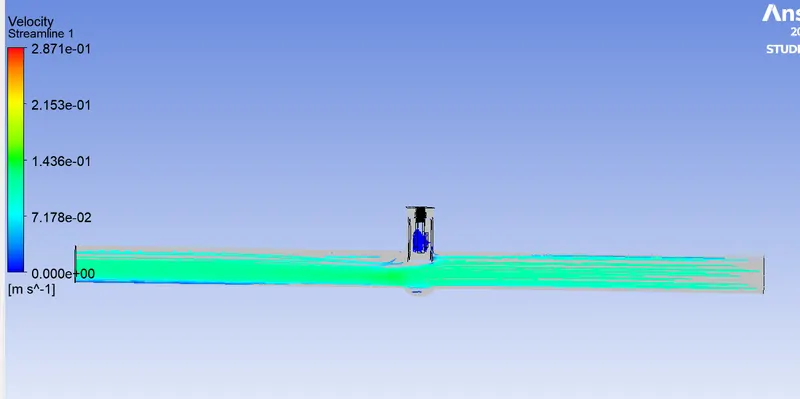
calculations for flow factor and flow co-efficient
Flow factor for 10 mm lift
=mass flow rate x3600/1000xsqrt(1/10x10^-5)
= mass flow rate x360.
=0.14935x360
= 53.76
Flow coefficient = flow factor/0.865
Flow coefficient for 10 mm lift= 53.76/0.865 = 62.157
Similarly calculate for remaining lift values
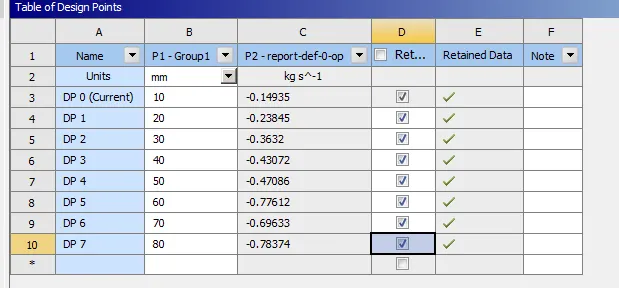
| S.no | Gate Valve Lift(mm) | mass flow rate(kg/s) | flow factor(in PSI drop per GPM) | flow co-efficient |
| 1 | 10 | -0.14935 | 53.76 | 62.157 |
| 2 | 20 | -0.23845 | 85.842 | 99.23 |
| 3 | 30 | -0.3632 | 130.752 | 151.15 |
| 4 | 40 | -0.43072 | 155.05 | 179.25 |
| 5 | 50 | -0.47086 | 169.5 | 195.96 |
| 6 | 60 | -0.77612 | 279.4 | 323 |
| 7 | 70 | -0.69633 | 250.67 | 289.8 |
| 8 | 80 | -0.78374 | 282.14 | 326.18 |
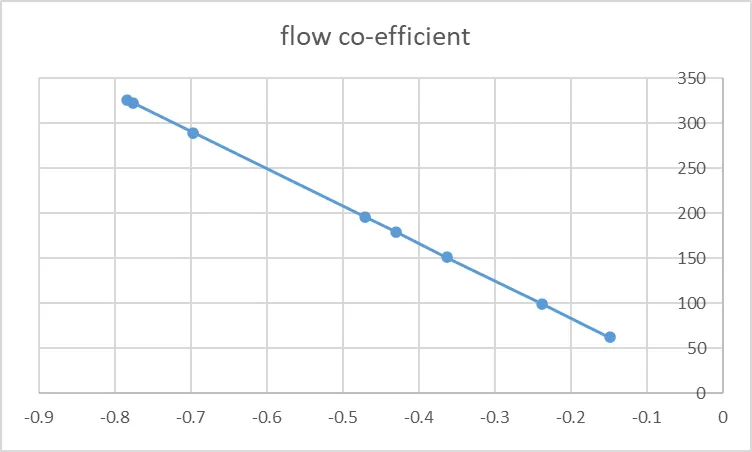
From the above Tabular Data and Graphs, we can observe that
- As the opening of the Gate Valve or Lift of the Gate Disc increases, the Mass Flow Rate increases.
- With Increases in Mass Flow Rate, there is an increment in Flow Coefficient.
- Also, Increases in Flow Factor are observed at each Design Point from 10 to 80 mm Lift.
- So, the Graph of Mass Flow Rate, Flow Coefficient, and Flow Factor goes linearly with Gate Disc Opening.
Conclusion:
1) With increased gate valve opening, mass flow rate rises.
2) High pressure is present on the inflow side and decreases throughout the valve.
3) The flow velocity rises as the valve opening widens.
4) The boundary of the outlet pressure is specified as zero.
5) The parametric study aids in the analysis of various valve opening positions and provides speedy simulation results.
6) The mass flow rate, flow coefficient, and flow factor are all at their maximum when the valve is fully open