Week 9 - Parametric study on Gate valve.
Challenge: Parametric study on Gate valve
Aim:For this challenge, you will have to perform a parametric study on the gate valve simulation by setting the opening from 10 % to 80%.
- Obtain the mass flow rates at the outlet for each design point.
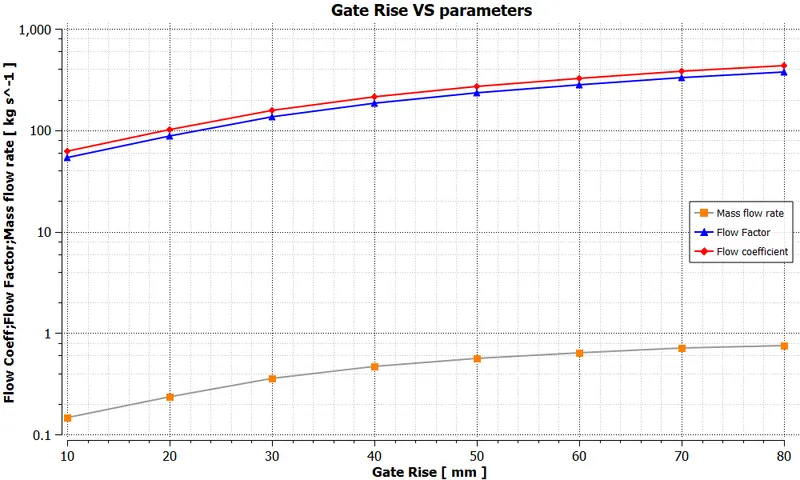
- Calculate the flow coefficient and flow factor for each opening and plot the graph.
- Discuss the results of the mass flow rate and flow coefficient.
Abstract:
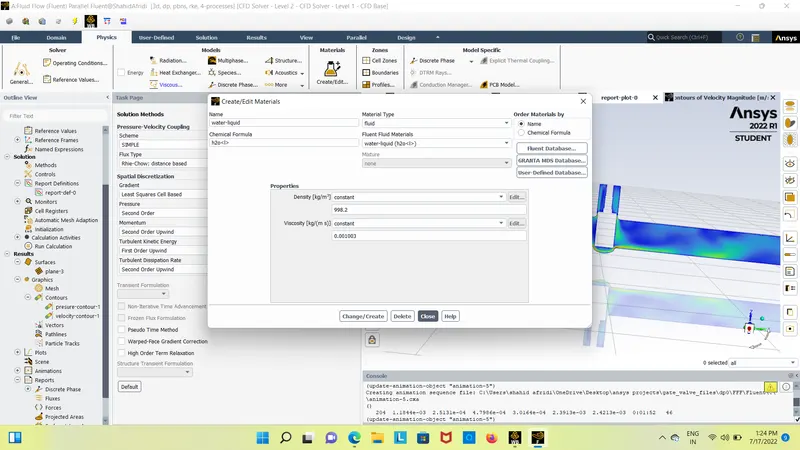
The flow of water (at 20∘">20∘20∘C) through a gate valve is examined for increasing stem travels (valve openings). The study is parametric with stem travel as input parameter and volume flow rate, flow factor & flow coefficient as output parameters in ANSYS Workbench. The simulations are carried out with commercially available CFD tool ANSYS® Fluent® 2021 R2 Student version.
Introduction:
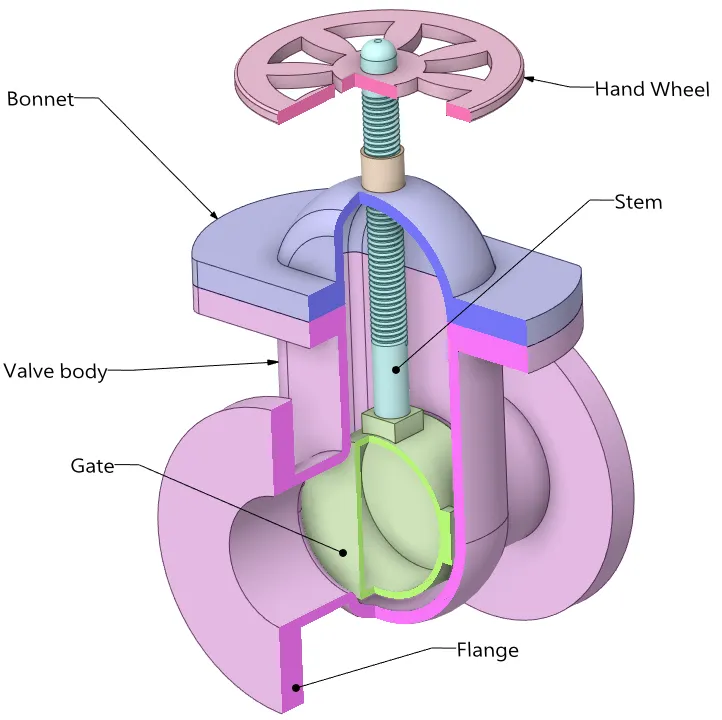
A gate valve, also known as a sluice valve, is a valve that opens by lifting a barrier (gate) out of the path of the fluid. Gate valves require very little space along the pipe axis and hardly restrict the flow of fluid when the gate is fully opened. Gate valves are used to shut off the flow of liquids rather than for flow regulation. The gate valve geometry is shown below.
steps invaling in the study of opening of value fallows below
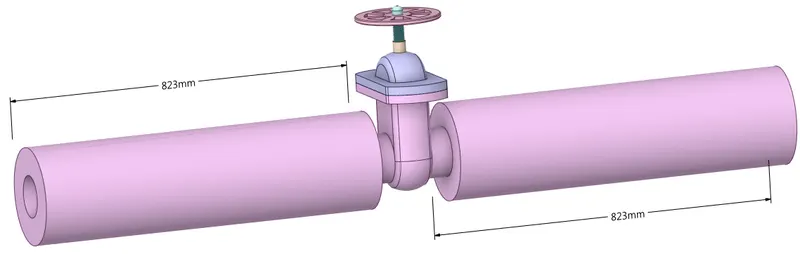
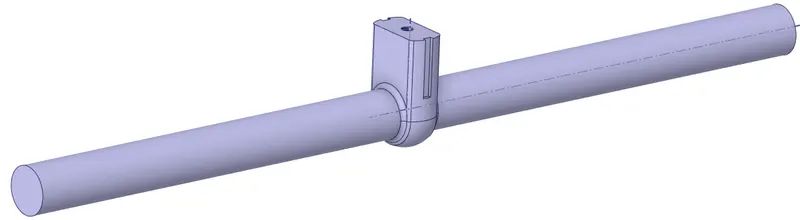
- geometry:The valve inlet & outlet faces are extended in ANSYS Spaceclaim. This is so that the inflow velocity profile is parabolic and outflow conditions are captured adequately. The resulting fluid volume is extracted as shown below.
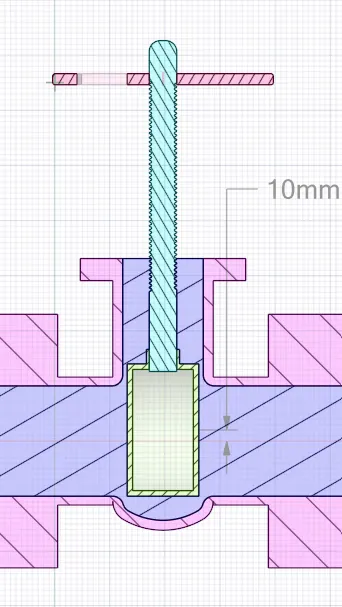
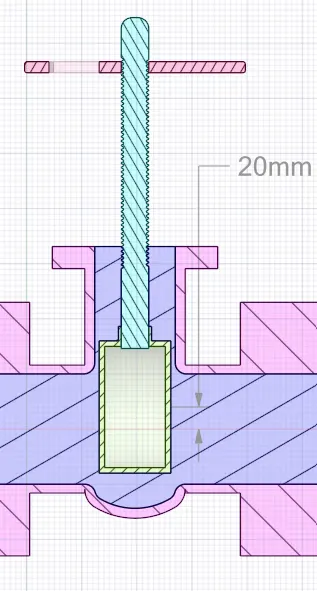
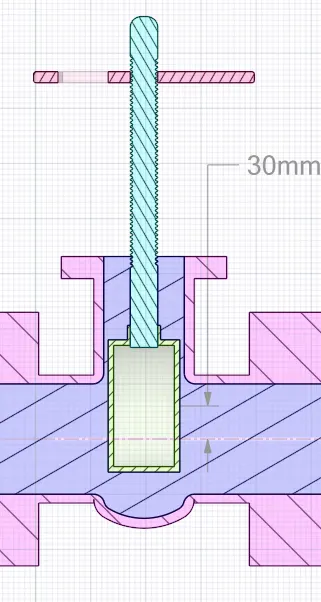
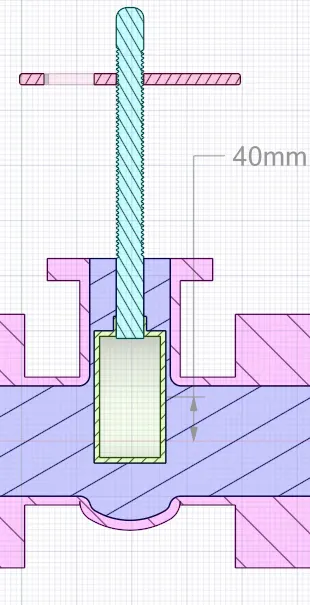
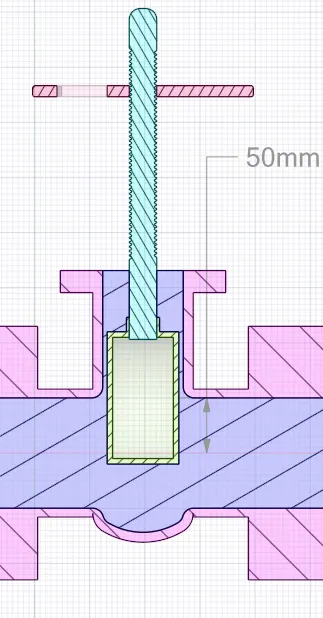
- The pipe diameter is 100 mm so varying the opening from 10% to 80% corresponds to stem rise from 10 mm to 80 mm. The stem travel is parameterized in Spaceclaim and can be seen in the parameters tab of Workbench.
- Changed domain geometry & fluid domain (blue region) for each design point is shown below.
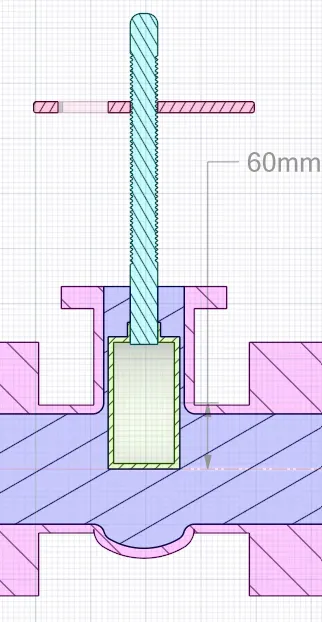
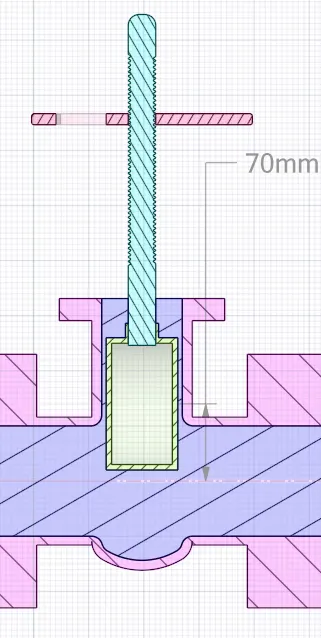
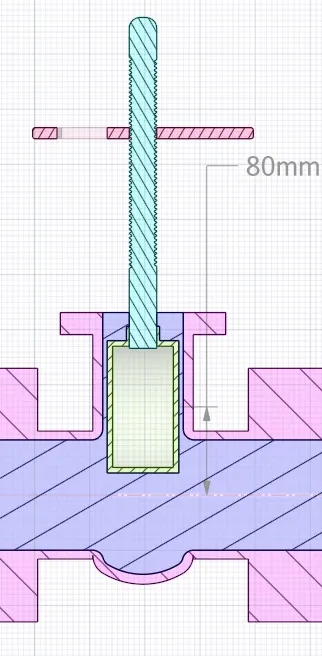
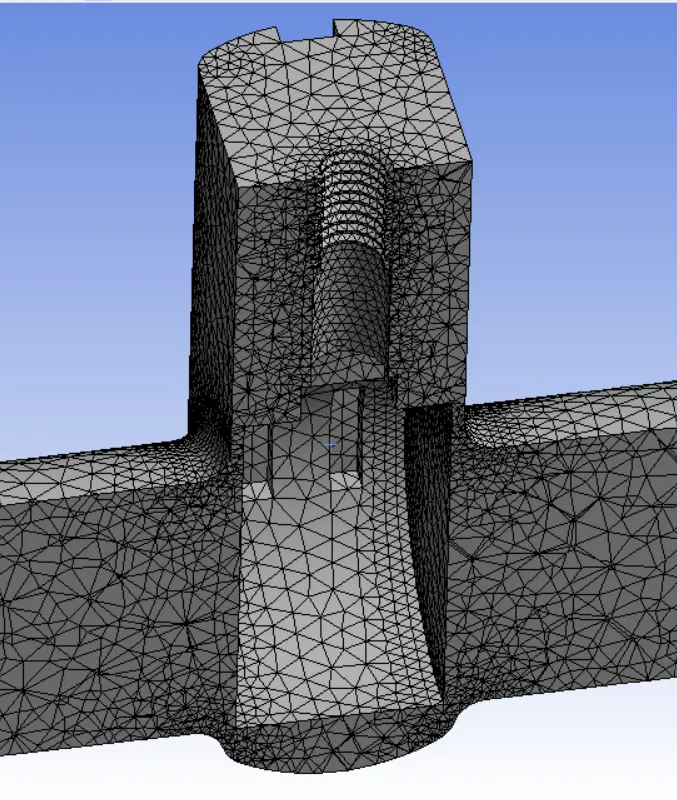
- meshing:The mesh is fine with an element size of 6mm for each design point. The no. of cells change for each design point but the refinement level remains more or less the same. The mesh (for 10 mm gate rise) & mesh settings are as shown below.
- Inlet & outlet faces are named so that fluent can apply wall Boundary conditions on these surfaces.

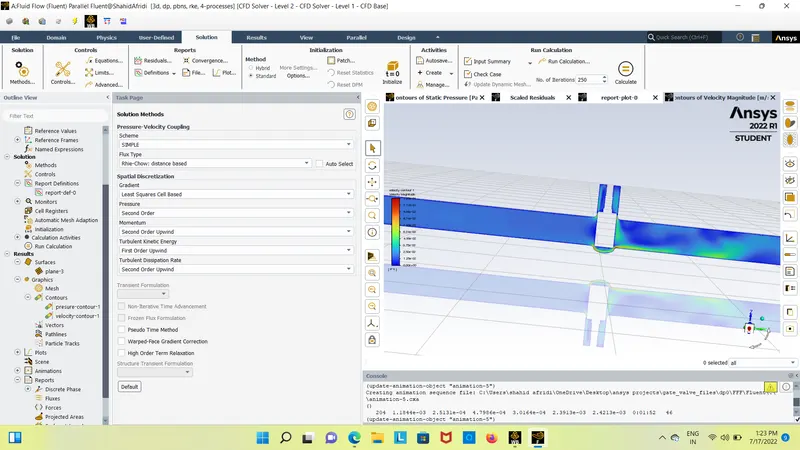
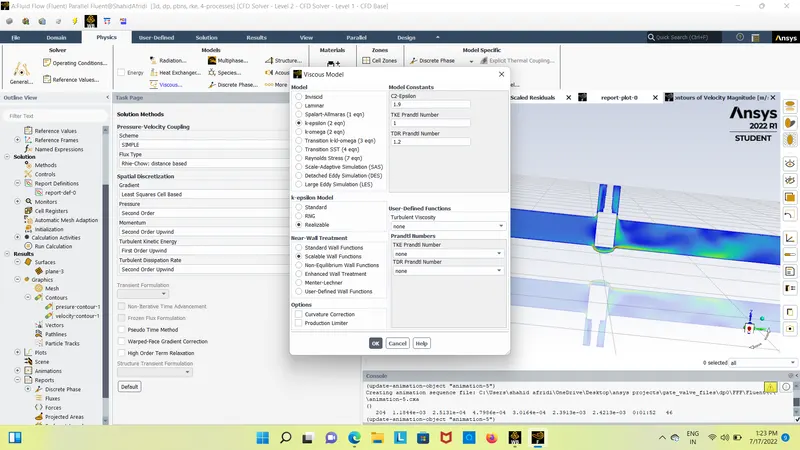
- setup:For reduced computational effort RANS based Realizable k-ε">k−εk-ε turbulence model is used with scalable wall functions for near-wall modeling. Scalable wall functions enforce the usage of the log law in conjunction with the standard wall functions approach even in the range 11.225<y+<30. This helps avoid problems of successive refinements in standard wall function meshes.
- Solution method:The solution procedure is iterative and is based on coupled scheme for Pressure-Velocity coupling. The discretization is 2nd">2nd2nd order for pressure and 2nd">2nd2nd order upwind for other variables. The gradient is computed using the Rhie-Chow distance-based method. Commercially available CFD tool ANSYS® Fluent® 2021 R2 Student version is used which has a limit of 512,000 cells in the mesh.
Results:
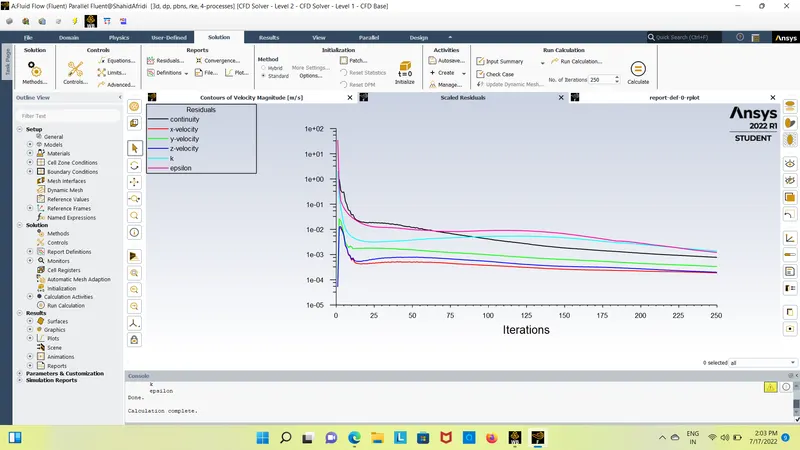
resuduals for 10mm rise in gate value
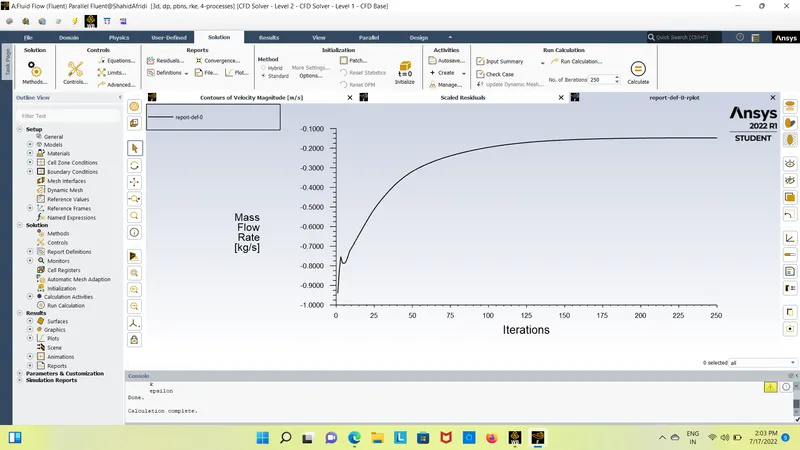
mass flow rate at output for 10mm rise in gate value
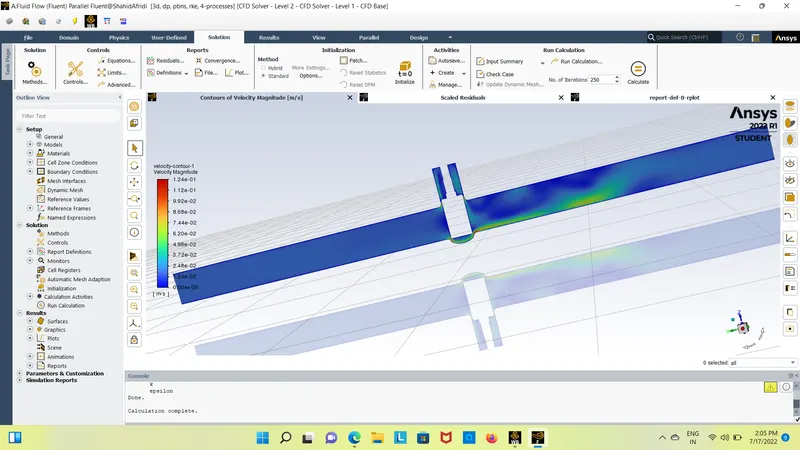
velocity for 10mm rise in gate value
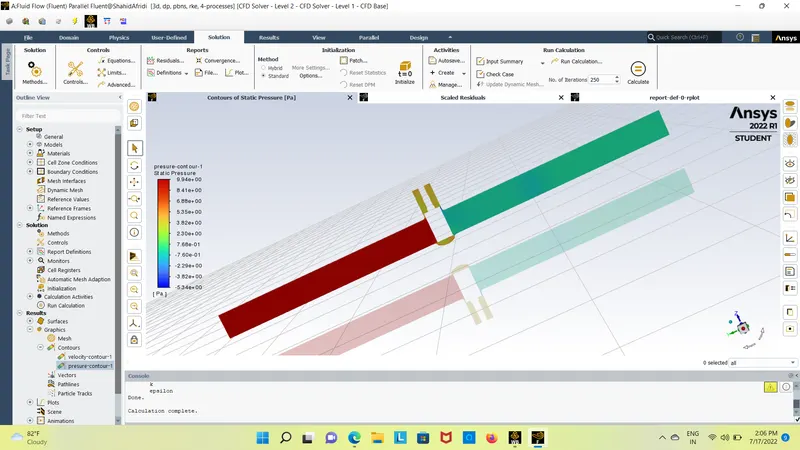
presure for 10mm rise in gate value
calculatin the flow facter and flowcoefficent
Flow factor and Flow coefficient:
Flow coefficient and flow factor values are used as a standard method of comparing valve capacities and sizing valves for specific applications and are widely accepted by the industry. The flow coefficient of a device is a relative measure of its efficiency at allowing fluid flow. It describes the relationship between the pressure drop across a valve or other assembly and the corresponding flow rate. Mathematically,
CV=QSGΔP">CV=Q√SGΔPCV=QSGΔP
Where,
Q=Volumetric flow rate, in gal/min">Q=Volumetric flow rate, in gal/minQ=Volumetric flow rate, in gal/min
SG=Specific gravity of fluid">SG=Specific gravity of fluidSG=Specific gravity of fluid
ΔP=Pressure drop across valve, in psi">ΔP=Pressure drop across valve, in psiΔP=Pressure drop across valve, in psi
Flow factor is exactly the same as flow coefficient but is defined in S.I. units instead of Imperial units. Flow coefficient is used in U.S. while Flow factor is used everywhere else. A conversion between the two values can be done using,
KV=0.865⋅CV">KV=0.865⋅CV
Results for different rise in gate value are fallows below:
for 10mm rise of valve
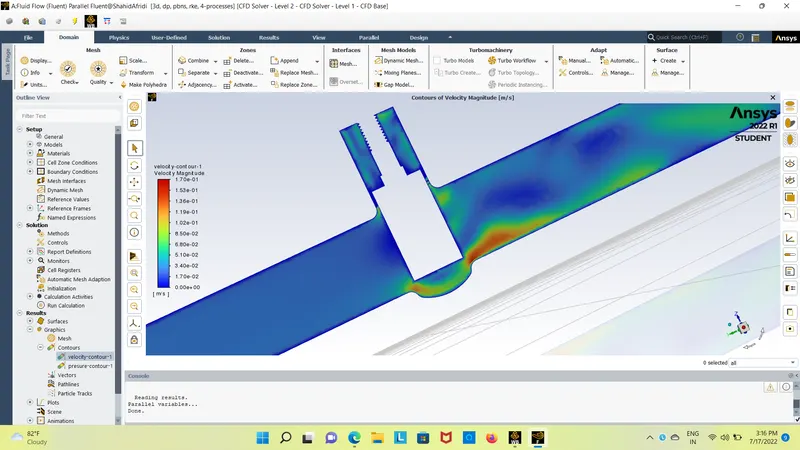
velocity:
presure:
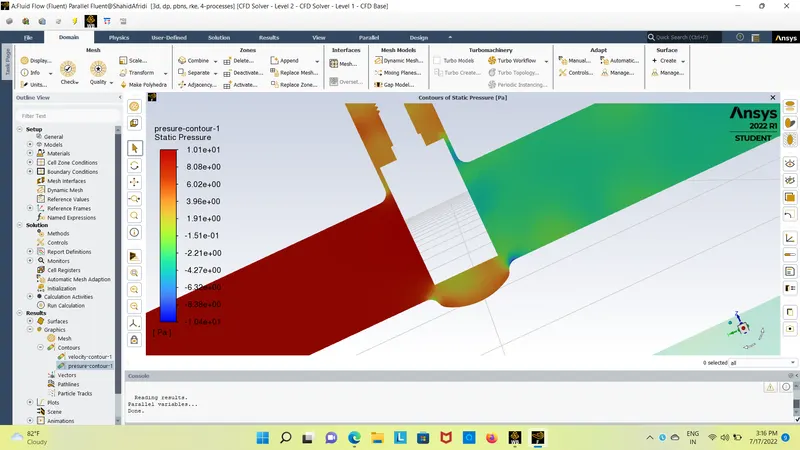
for 20mm rise of valve
velocity:
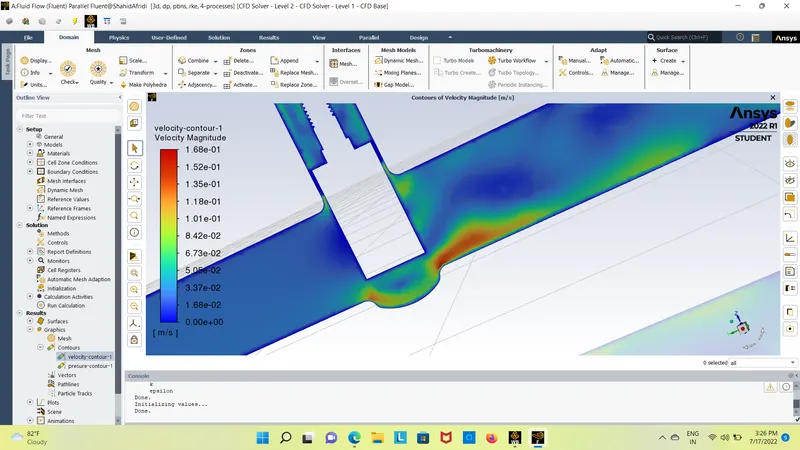
presure:
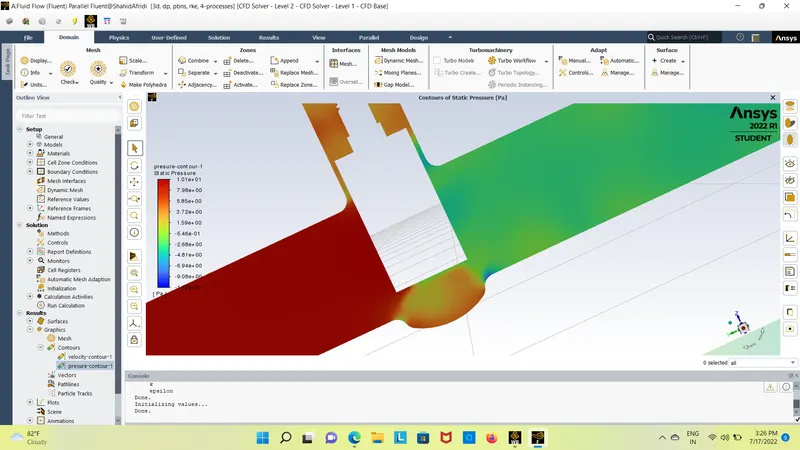
for 30mm rise of valve
velocity:
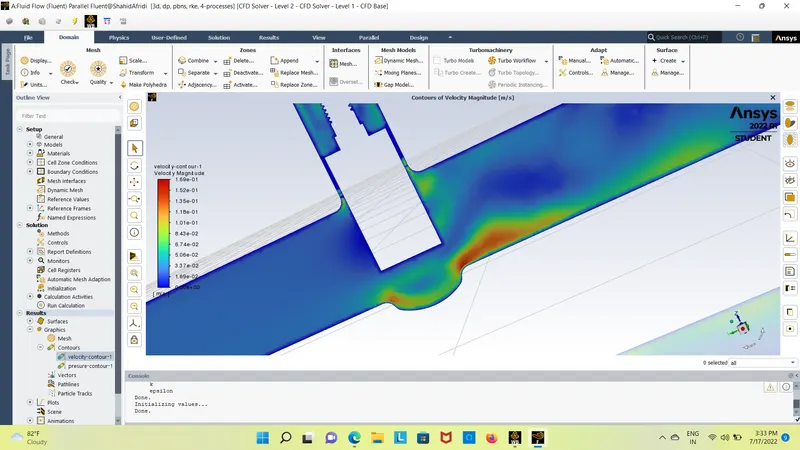
presure:
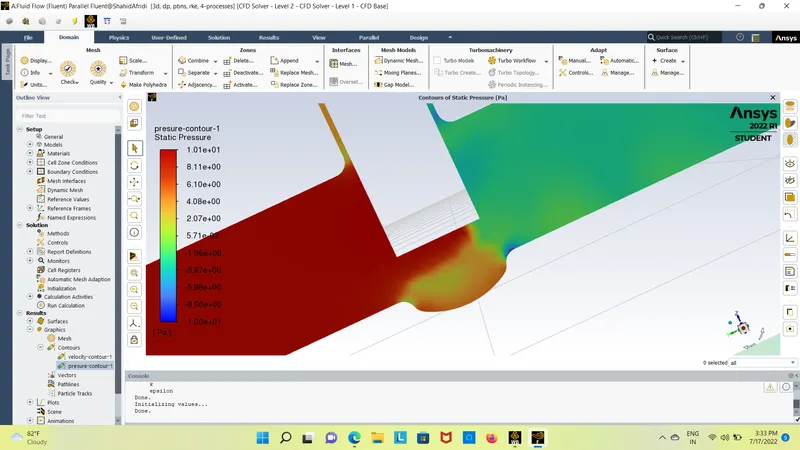
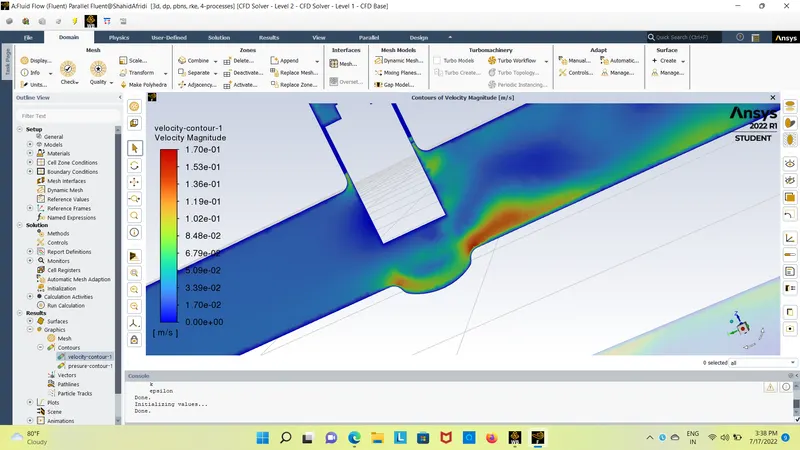
for 40mm rise of valve
velocity:
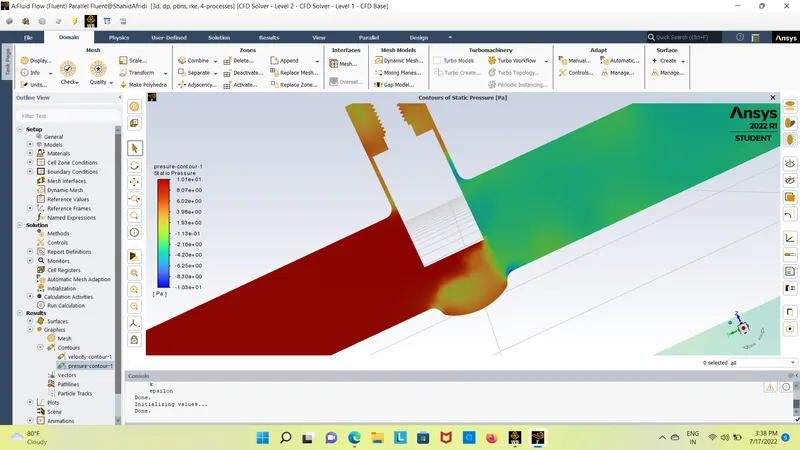
presure:
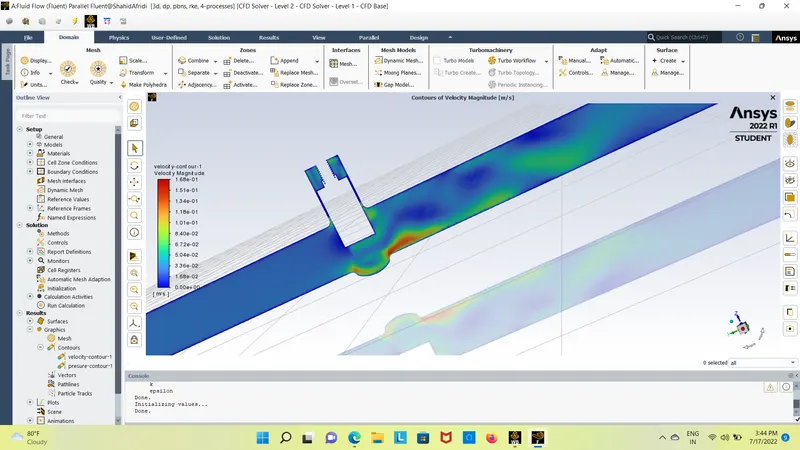
for 50mm rise of valve
velocity:
presure:
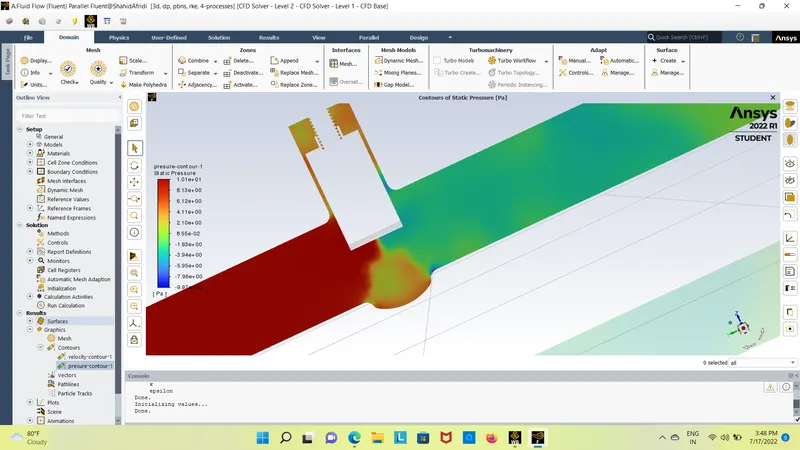
for 60mm rise of valve
velocity:
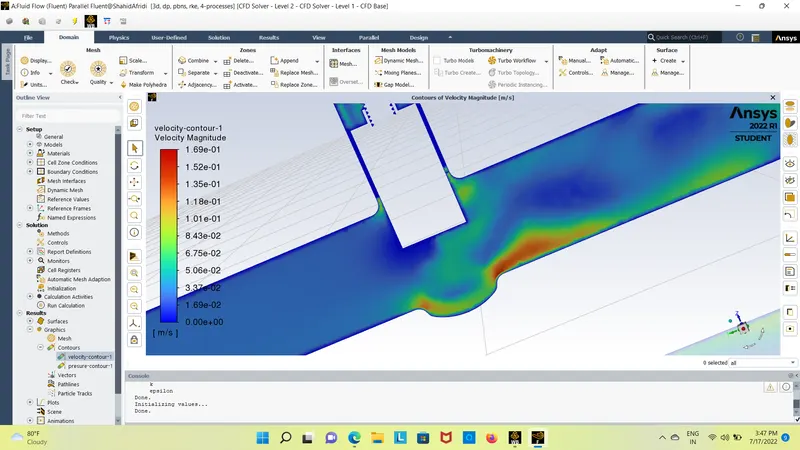
presure:
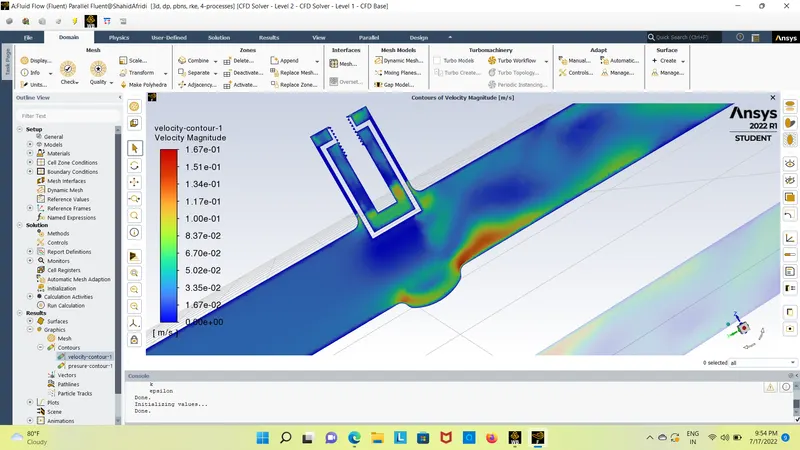
for 80mm rise of valve
velocity:
presure:
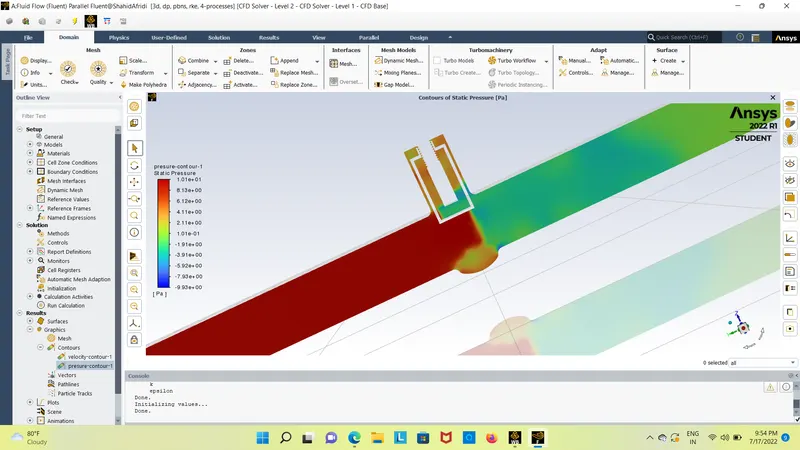
Table of design points
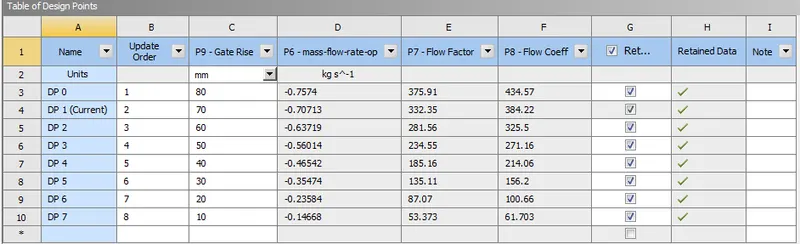
Chart plots:
Inferences:
- The negative value of mass flow rate simply indicates that mass is flowing out of our domain which gets more negative with gate rise as expected.
- From the pressure contours, it can be seen that pressure everywhere is much above the vapor pressure of water (at 20∘C">20∘C20∘C). This is desirable as below vapor pressure cavitation takes place which shortens valve life and can even damage pipeline downstream.
- From the graph, it can be seen that mass flow increases rather slowly than flow factor & flow coefficient which show their exponential nature.
- Hence much larger flow coefficient & flow factor each time there is an increment in mass flow rate.