Week 9 - Parametric study on Gate valve.
Aim -
To perform a parametric study on the gate valve simulation by setting the opening from 10 % to 80%.
- Obtain the mass flow rates at the outlet for each design point.
- Calculate the flow coefficient and flow factor for each opening and plot the graph.
- Discuss the results of the mass flow rate and flow coefficient.
Introduction -
Gate valve basically employed in the flow to control the flow of fluid in pipe . In this challenge we will be varying the valve position from 10 % - 80 % and will check the mass flow rate variation and pressure drop. The variation of velocity and pressure will be analysed at the end .
Parametric study -
It is study in which once we setup the case we can generate different output for different defined inputs . We dont need to set the case setup again and again. It saves the tim eof simulation as well.
Geometry –
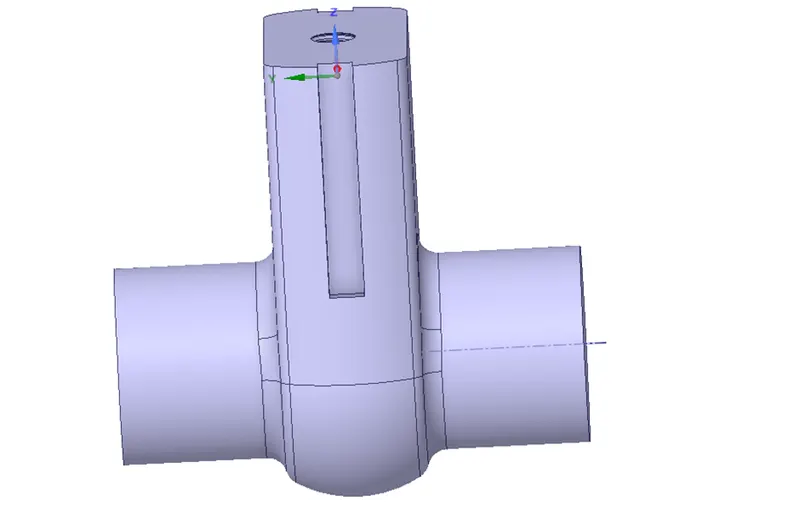
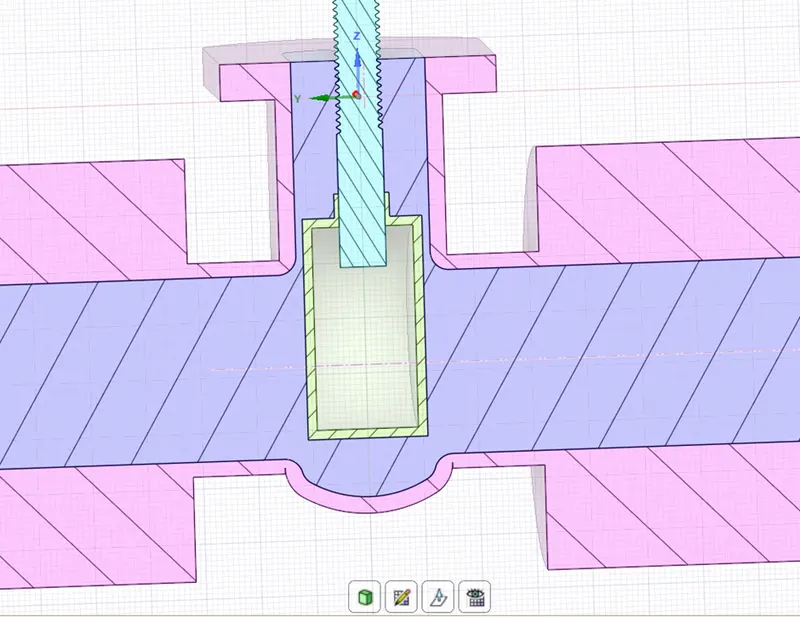
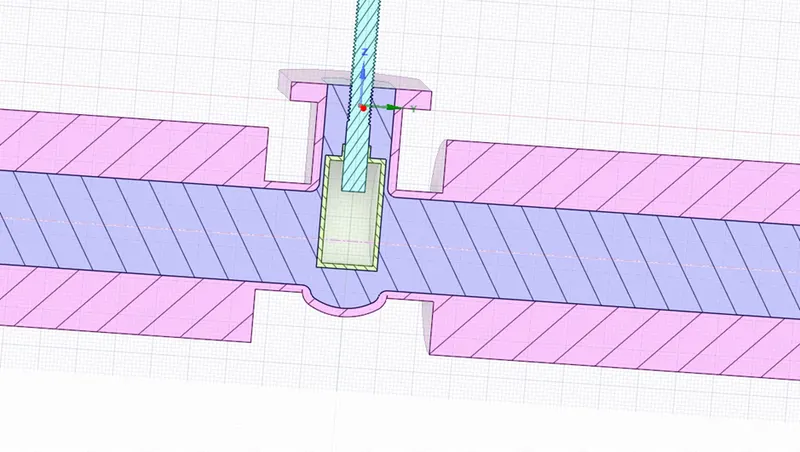
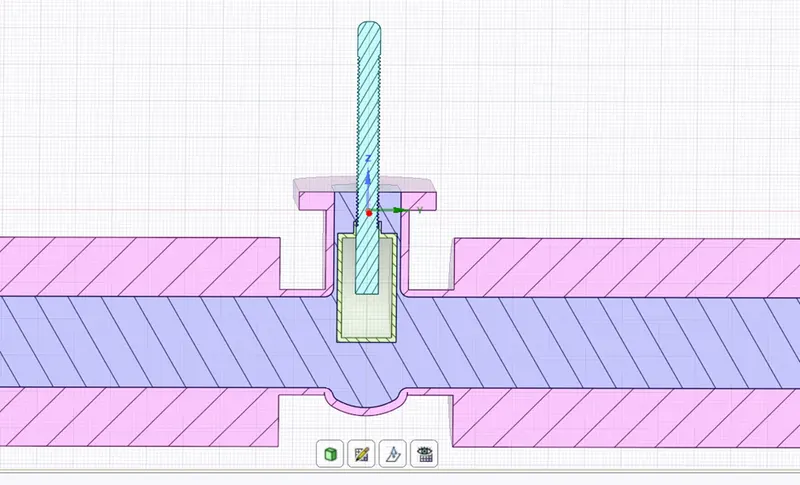
Import the geometry in space claim and extract the volume.
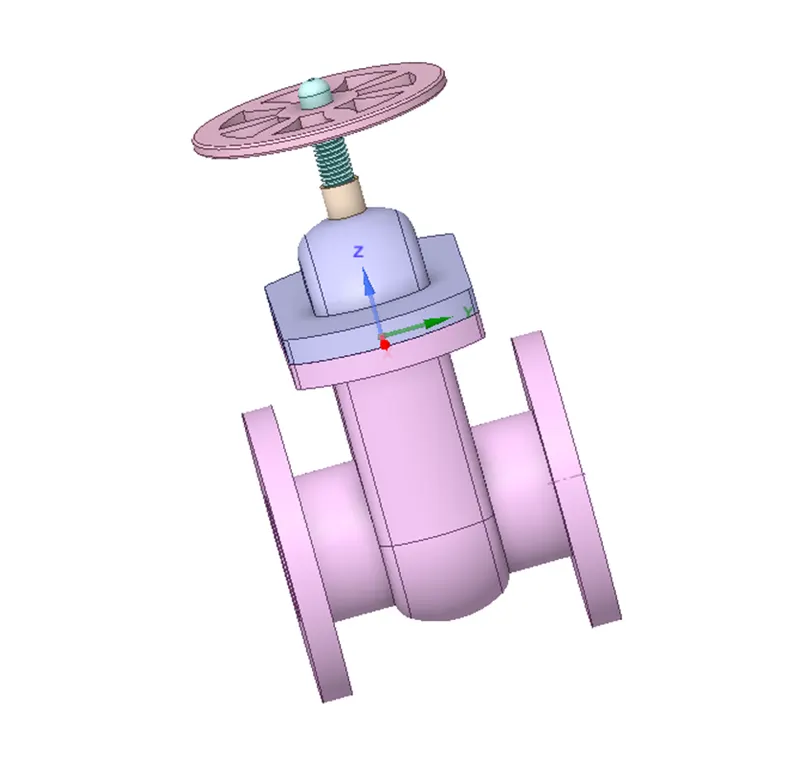
Do the volume extraction for better understanding of the fluid .
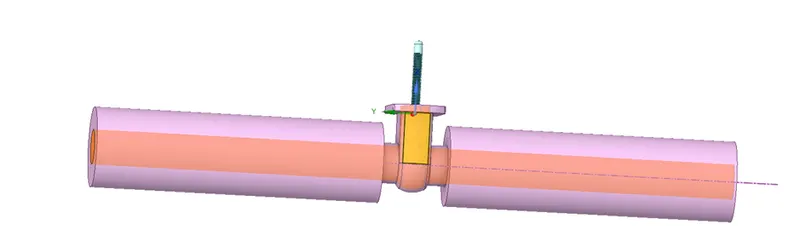
Initially we provide the 10mm lift for the disc and extend the volume.
Meshing -
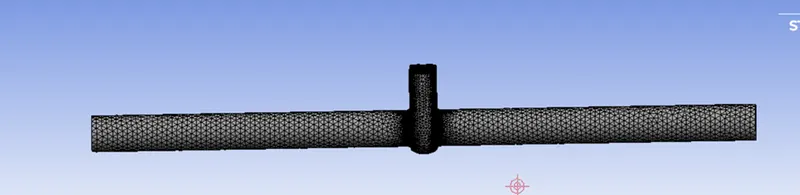
Define the inlet and outlet of the pipe and do meshing of element size of 20 mm.
Setup
Solver Type – Pressure based and Steady
velocity formulation – Absolute
Tick marks the gravity and define the gravitational acceleration as - 9.81 m/sec.
Material - Water fluid
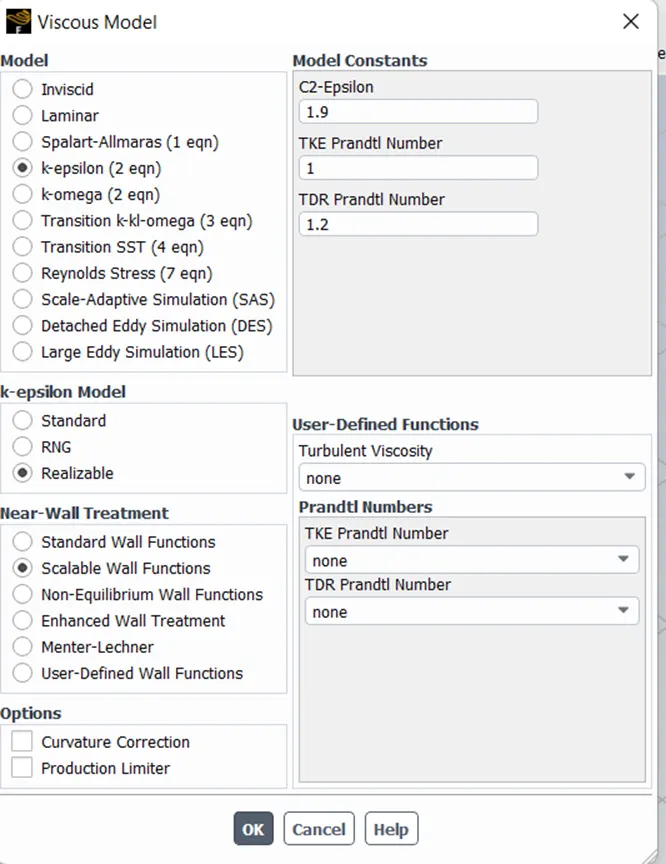
Viscous Model –
Boundaries -
Inlet - Pressure based , 10 Bar
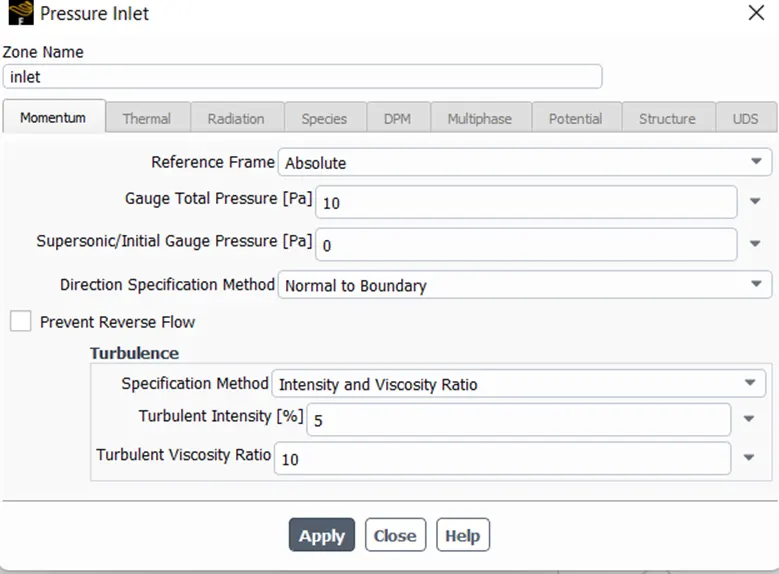
Outlet - Pressure based
Initialization - Standardised , Defined at inlet .
No of iteration - 250 nos
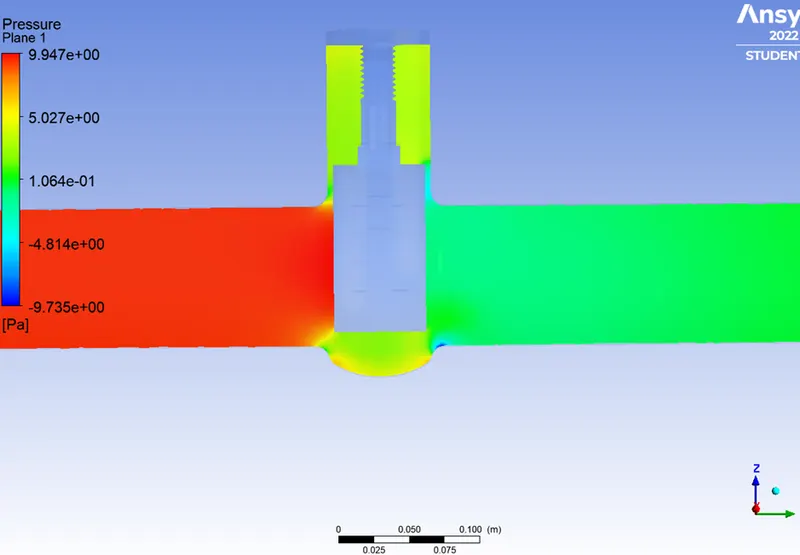
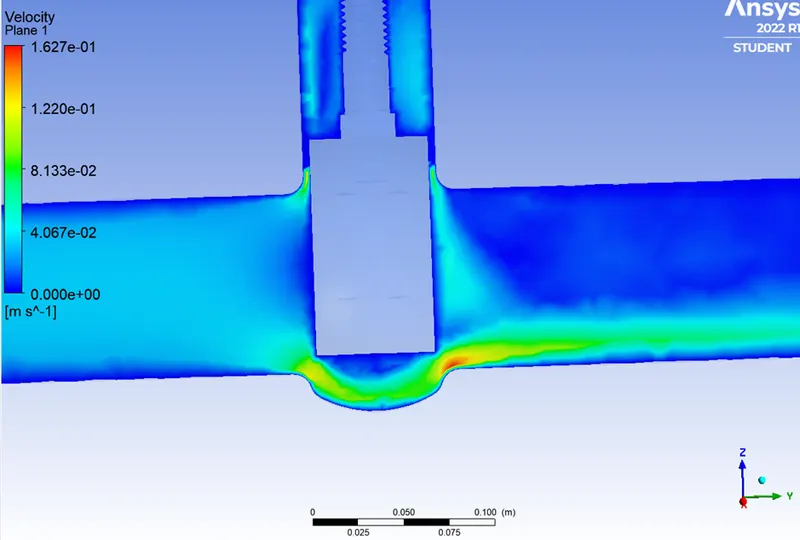
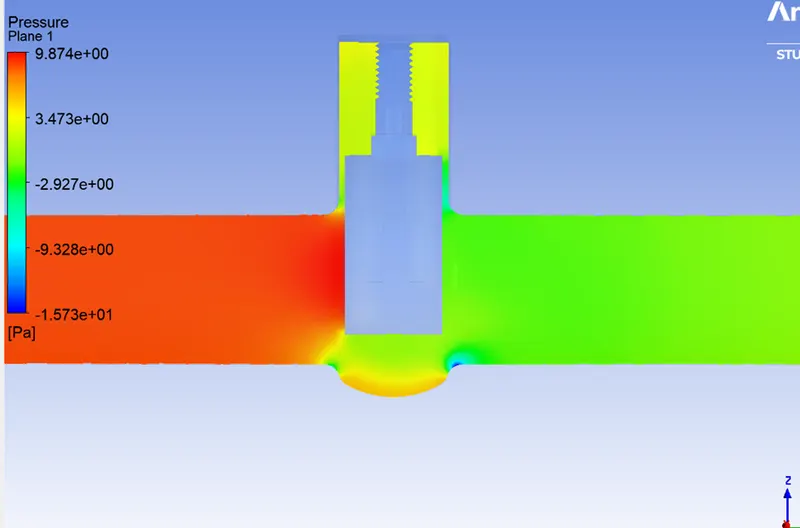
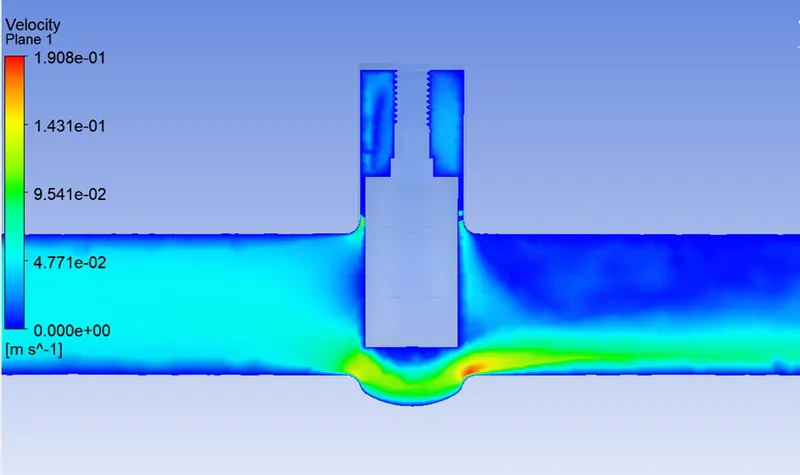
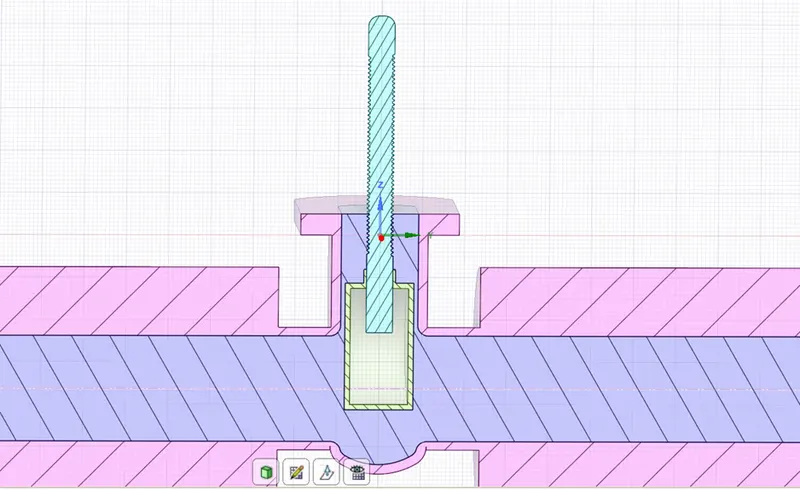
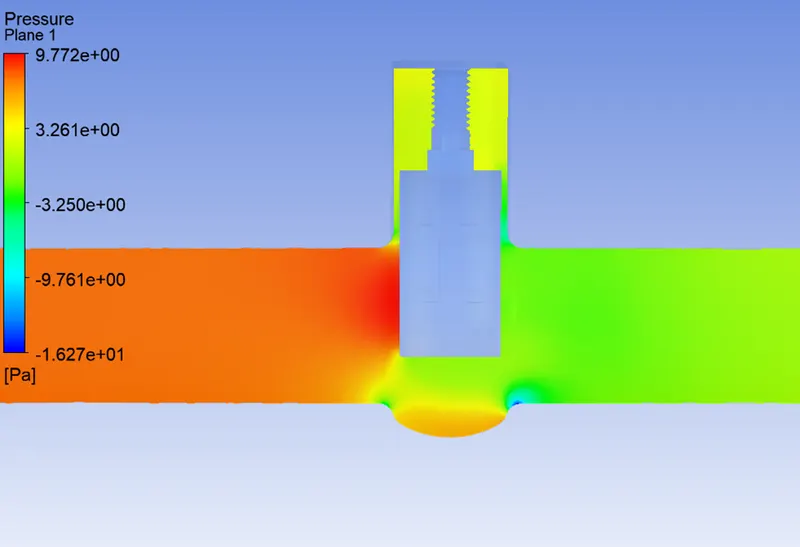
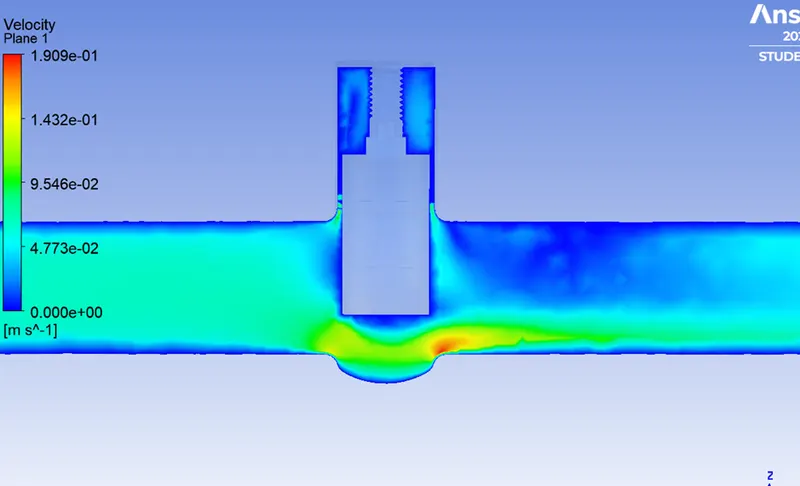
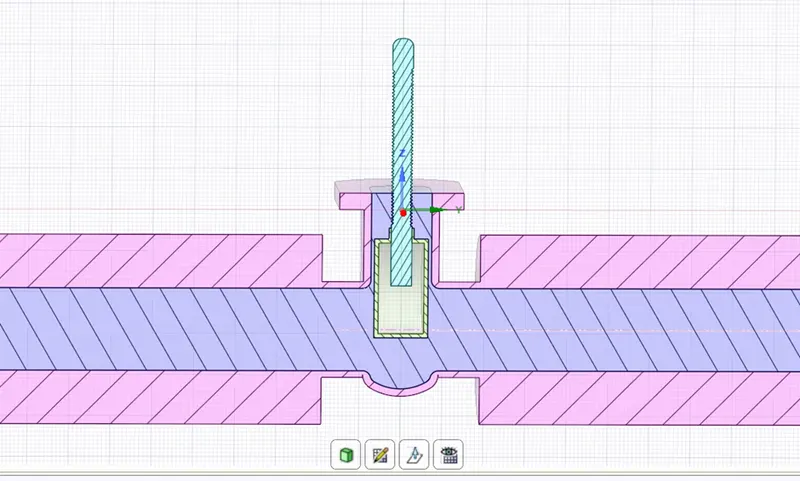
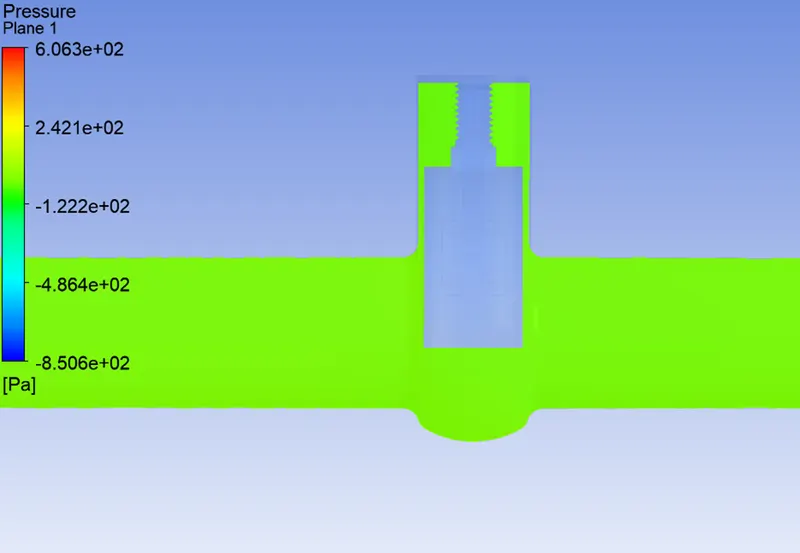
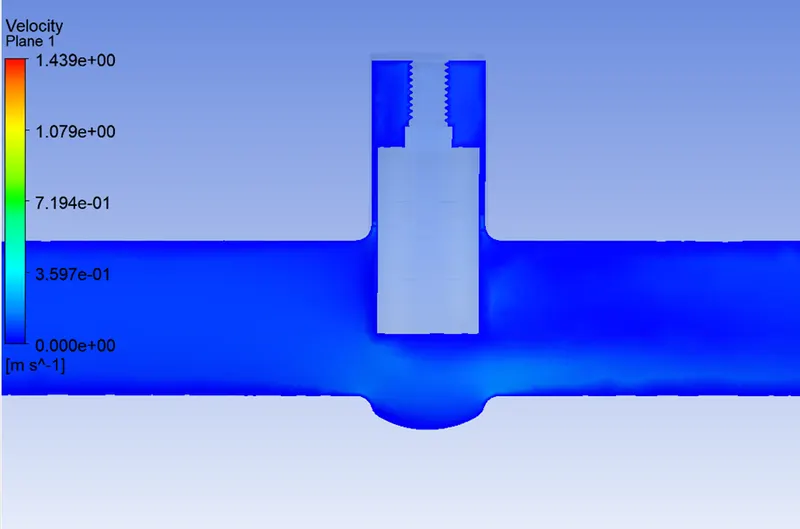
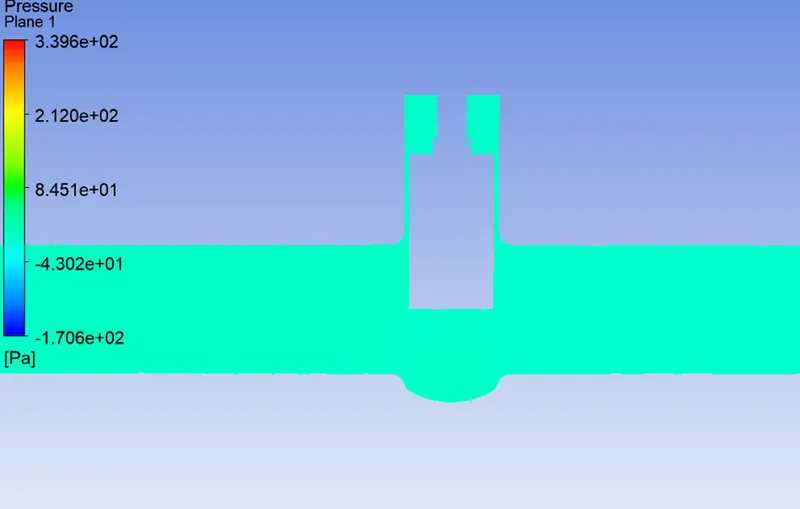
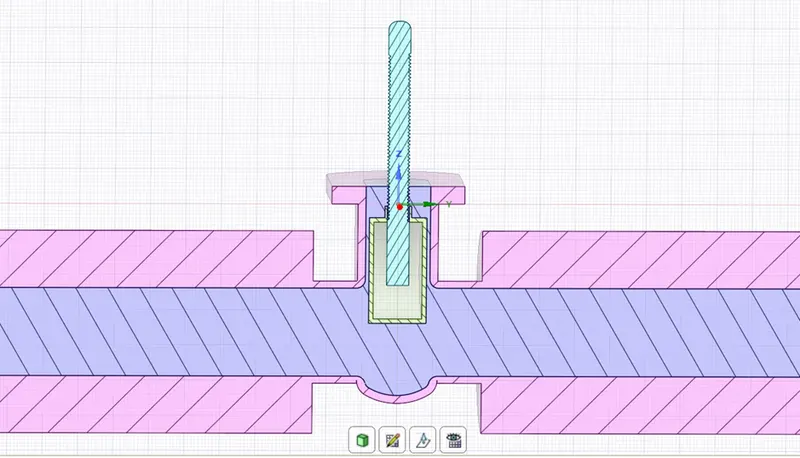
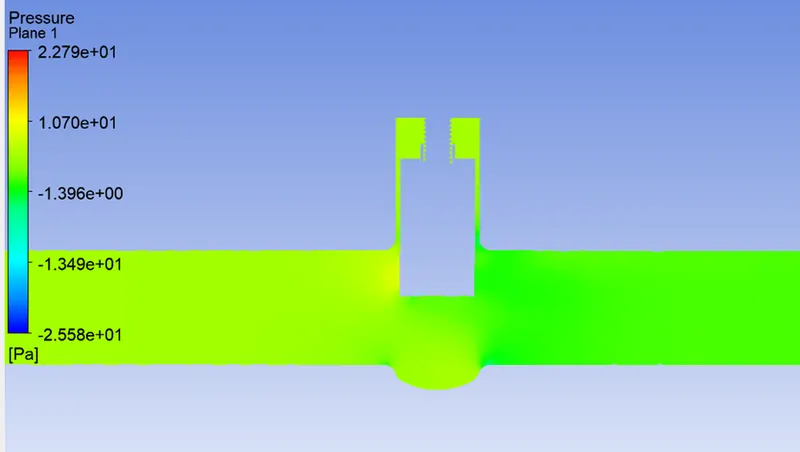
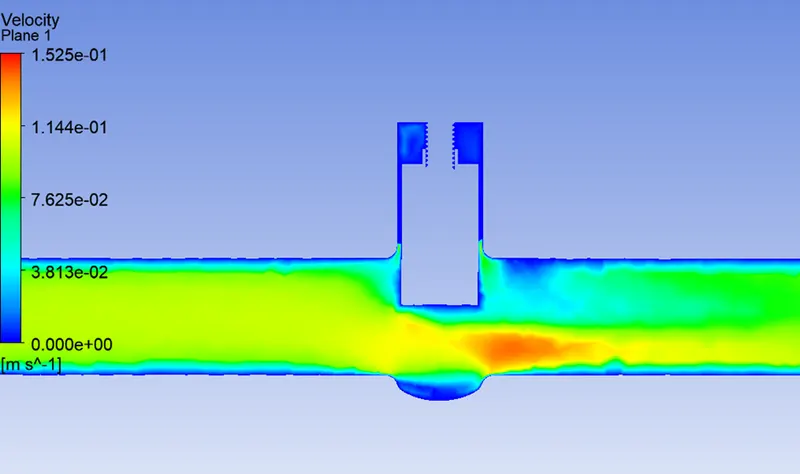
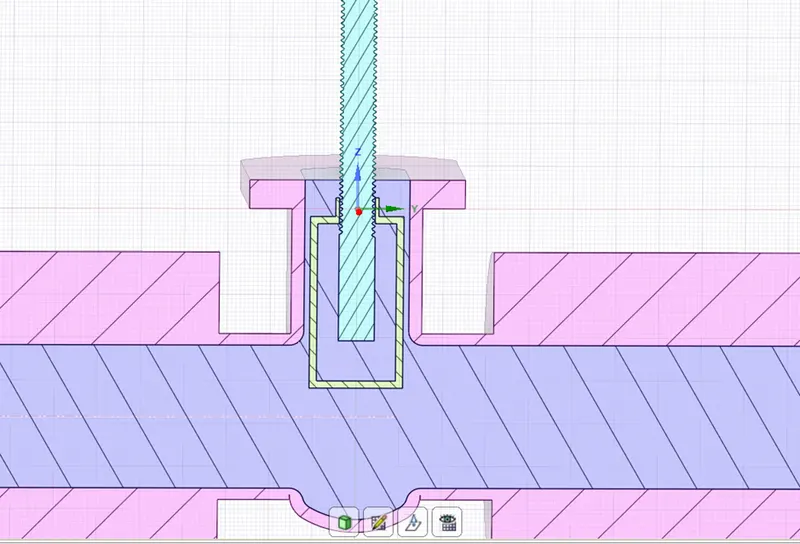
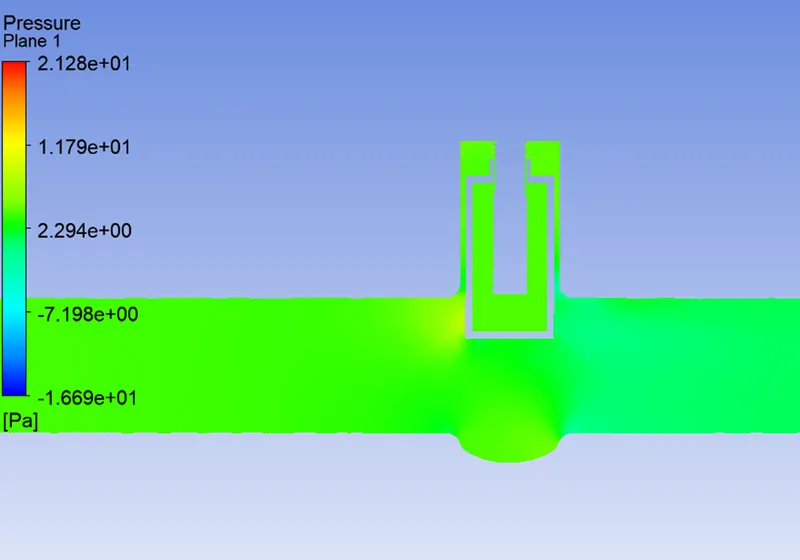
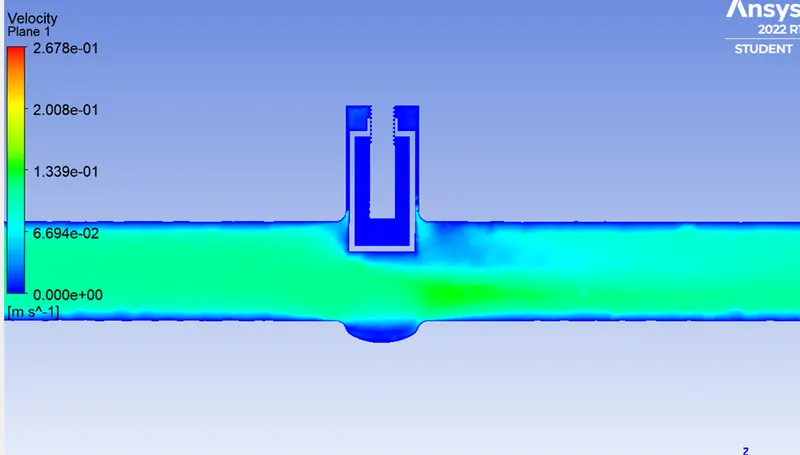
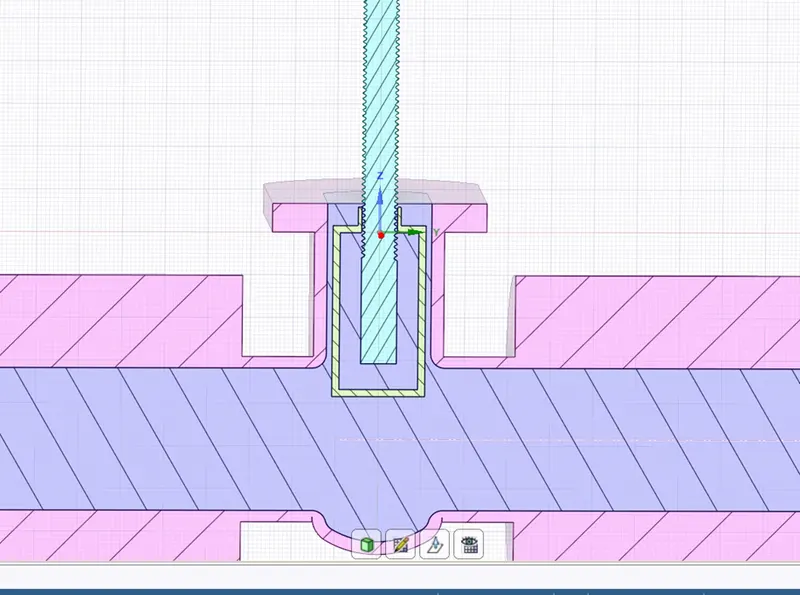
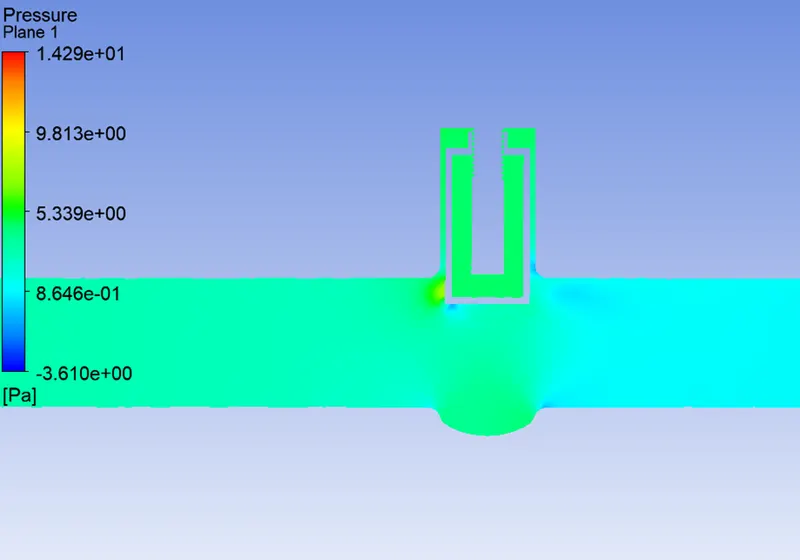
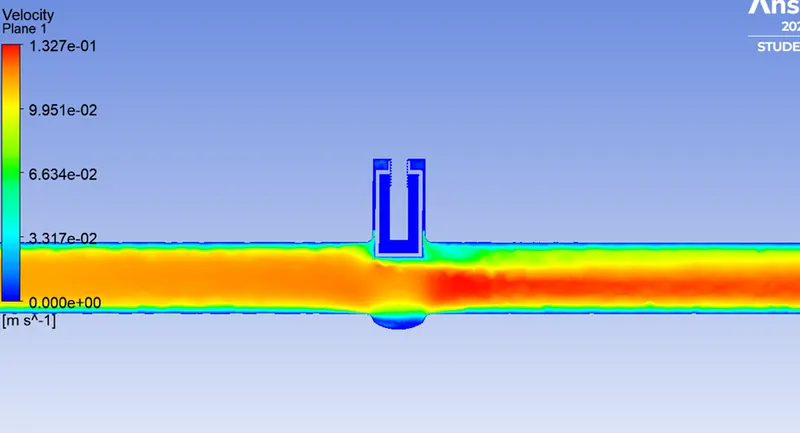
Results - As in this study we will varies the disc opening position from 10 % to 80 % , The valve geometry , pressure and velocity contour for each case is shown below.
For 10 % lift
Pressure Contour
Velocity Contour
For 20 % lift
Pressure Contour
Velocity Contour
For 30 % lift
Pressure Contour
Velocity Contour
For 40 % lift
Pressure Contour
Velocity Contour
For 50 % lift
Pressure Contour
Velocity Contour
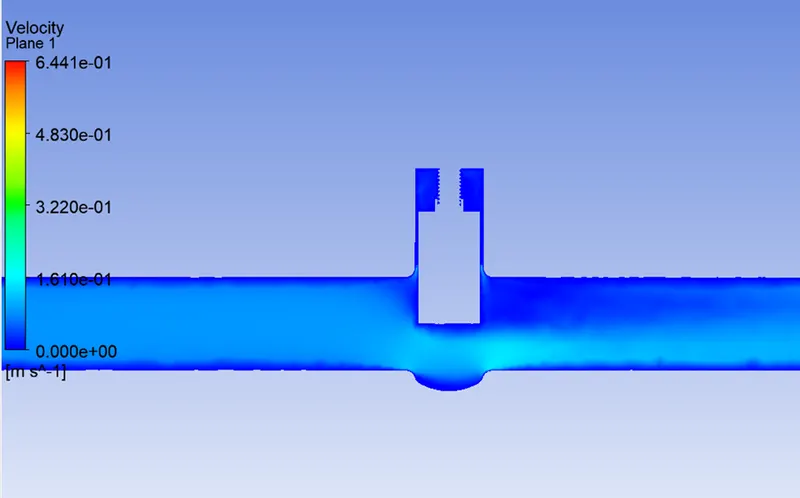
For 60 % lift
Pressure Contour
Velocity Contour
For 60 % lift
Pressure Contour
Velocity Contour
For 70 % lift
Pressure Contour
Velocity Contour
For 80 % lift
Pressure Contour
Velocity Contour
flow coefficient and flow factor
Flow Coffcient –
The flow coefficient of a device is a relative measure of its efficiency at allowing fluid flow. It describes the relationship between the pressure drop across an orifice valve or other assembly and the corresponding flow rate.
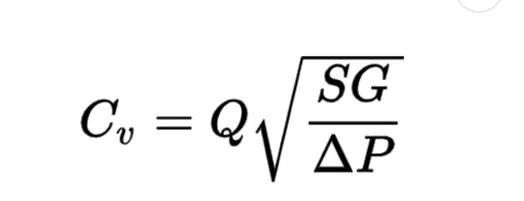
Q is the rate of flow (expressed in US gallons per minute)
SG is the specific gravity of the fluid (for water = 1),
ΔP is the pressure drop across the valve (expressed in psi).
Flow Factor -
The metric equivalent flow factor (Kv) is calculated using metric units :
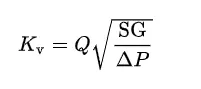
Kv is the flow factor (expressed in m3·h−1).
Q is the flowrate (expressed in cubic metres per hour m3·h−1)
SG is the specific gravity of the fluid (for water = 1)
∆P is the differential pressure across the device (expressed in bar).
Flow cofficient for different valve disc position
|
Lift of disc |
Mass flow rate (kg /sec) |
Flow rate m3 / kg |
Flow rate in Gallon |
Pressure drop |
CV |
|
10 |
0.23800585 |
0.85682106 |
3.77247174 |
0.001380394 |
101.5370253 |
|
20 |
0.36035372 |
1.297273392 |
5.711726099 |
0.001288463 |
159.1224004 |
|
30 |
0.46725997 |
1.682135892 |
7.406225655 |
0.001181698 |
215.4485614 |
|
40 |
0.55514387 |
1.998517932 |
8.799214647 |
0.001058608 |
270.4433644 |
|
50 |
0.61783879 |
2.224219644 |
9.792949944 |
0.000976024 |
313.4608193 |
|
60 |
0.71241108 |
2.564679888 |
11.29195214 |
0.000820275 |
394.2658563 |
|
70 |
0.76679523 |
2.760462828 |
12.15395897 |
0.000721262 |
452.5548964 |
|
80 |
0.8252434 |
2.97087624 |
13.08038187 |
0.000603433 |
532.4832676 |
|
|
|
|
|
|
|
Flow Factor for different valve disc position
|
Lift of disc |
Mass flow rate (kg /sec) |
Flow rate m3 / kg |
Pressure drop |
KV |
|
10 |
0.23800585 |
0.85682106 |
9.51747E-05 |
87.82728845 |
|
20 |
0.36035372 |
1.297273392 |
8.88363E-05 |
137.6373683 |
|
30 |
0.46725997 |
1.682135892 |
8.14751E-05 |
186.3582558 |
|
40 |
0.55514387 |
1.998517932 |
7.29883E-05 |
233.927548 |
|
50 |
0.61783879 |
2.224219644 |
6.72944E-05 |
271.1366981 |
|
60 |
0.71241108 |
2.564679888 |
5.65559E-05 |
341.0312738 |
|
70 |
0.76679523 |
2.760462828 |
4.97292E-05 |
391.4500084 |
|
80 |
0.8252434 |
2.97087624 |
4.16052E-05 |
460.5862874 |
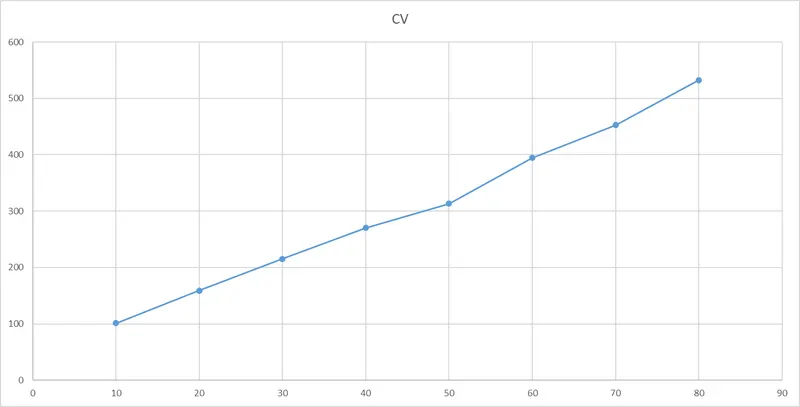
Plot CV vs Disc Lift
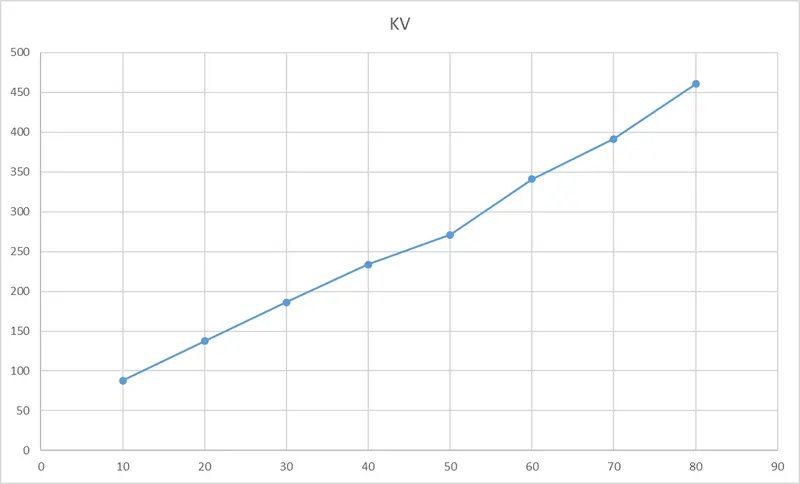
Plot kV vs Disc Lift
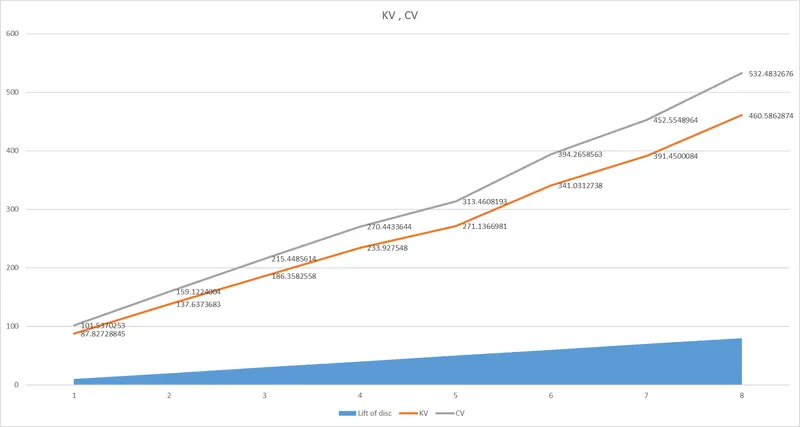
Plot kV , cv vs Disc Lift
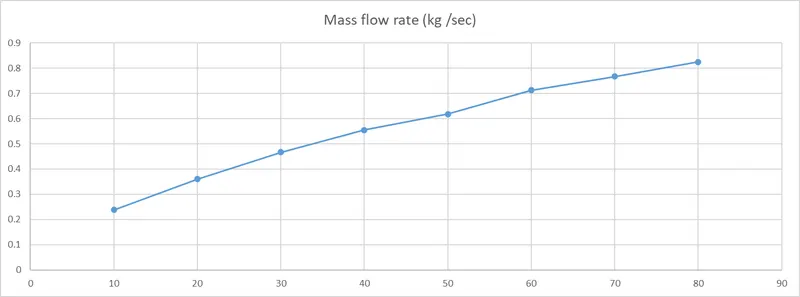
Mass flow rate vs Disc Lift
Conclusion -
1. It is observed that as we increases the disc lift the mas flow rate also increases . The pressure drop also reduces as we increase the valve disc height .
2. The flow factor and coffcient also found increases as we increases the opening of the disc.
3. The variation in th velocity and pressure is also evident from the contour charts.
4. In this we did the Parametric study in this task we come to know that with this feature we can get different desired output for different inputs with once case setup only.